


Ancient agrarian populations across the world created innovative social and environmental strategies to mediate the risk of food shortfall. These strategies included, but are not limited to, storing food, pooling and sharing resources, building infrastructure to divert water and soil to fields, intensifying agricultural production, diversifying food resources, and creating social networks to trade goods or move people when food shortfall occurred (e.g., Cancian Reference Cancian and Barlett1980; Cashdan Reference Cashdan1990; Halstead and O'Shea Reference Halstead and O'Shea1989; Winterhalder et al. Reference Winterhalder, Lu and Tucker1999). Changing climate patterns would have stressed these established strategies, taxing food security in a region and, some have argued, leading to transformations in social systems in an attempt to adapt. Many archaeologists have reconstructed prehispanic climates and linked them to food production and population models in a given place, such as Mesa Verde (Cordell et al. Reference Cordell, Van West, Dean and Muenchrath2007; Schwindt et al. Reference Schwindt, Kyle Bocinsky, Ortman, Glowacki, Varien and Kohler2016), Cahokia (Bird et al. Reference Bird, Wilson, Gilhooly, Steinman and Stamps2017), or the Hohokam region (Ingram Reference Ingram2010). For example, one often-used explanation for agricultural shortfall is that the climatic conditions at an identified place became more challenging with respect to producing food. The climate perhaps became drier (lowering agricultural productivity) or more variable (increasingly unpredictable flooding that could destroy water management structures, such as check dams or weirs, or challenge otherwise reliable agricultural strategies). These arguments provide useful information on possible production shortfalls and their implications for households and villages at a particular location, although they are limited by a lack of concrete information on how these shortfalls may relate to other parts of the social and environmental landscape.
Another (not mutually exclusive) explanation is that the distribution of precipitation across the landscape changed, challenging the strategies established to mediate food shortfall risk (Dean and Funkhouser Reference Dean, Funkhouser and Waugh1995). For example, social relationships between two communities founded on mitigating food shortfalls would be most useful if climatic conditions at the two sites were anticorrelated, meaning one site experienced food surplus while the other experienced shortfall. Similarly, communities may have chosen to settle in places where wild resources became more abundant at times of crop stress. This could occur at ecotones or along altitudinal gradients (e.g., Fish and Fish Reference Fish and Fish1992). If the spatial structure of climate conditions on the landscape changed, it could have challenged decades- or centuries-old risk-buffering strategies. It is this possibility and perspective that we use to explore risk from a landscape perspective. Specifically, we model risk by evaluating how the spatial structure of ancient climate conditions may have affected the reliability of three major strategies used to reduce risk: drawing upon social networks in time of need, hunting and gathering of wild resources, and storing surplus food. We then explore how climate-driven changes to this reliability may relate to archaeologically observed social transformations. An underlying assumption of this work is that it is not marginal environments per se that create subsistence risk, but instead the changes in those environments—both in a particular locale and across a region—that could threaten the strategies that had evolved over generations to mitigate that risk. Social relationships that have lasted for decades or centuries, for instance, are not easily abandoned, even if their original purposes (subsistence risk mitigation being one possibility) are not being served.
We first introduce a methodology for modeling and visualizing risk landscapes, and we advance preliminary interpretations anchored in rich archaeological data. We then explore the intersection of three risk-buffering strategies and the way they change over time, in concert (or not) with archaeologically observed social transformations through case studies in the Cibola and Salinas regions in New Mexico (Figure 1). Social transformations in these two regions include aggregation of small villages into larger towns, movement of people into new areas, and/or the creation of new exchange networks. An initial analysis of the Salinas region identified patterns between increasing anticorrelation of rainfall in later prehispanic time periods (AD 1351–1450) and growing evidence of the exchange of ceramics between anticorrelated areas at that time (Strawhacker et al. Reference Strawhacker, Snitker, Spielmann, Wasiolek, Sandor, Kinzig, Kintigh and Spielmann2017). These data suggest the improved potential for the development of mutually beneficial social networks based on the spatial structure of the risk landscape. We build upon this preliminary study of the Salinas region, adding additional analysis of other risk mediation strategies, and we present an additional case study—the Cibola region—to more fully demonstrate the utility of our proposed landscape approach. This study is an extension of the work developed through the Long-Term Vulnerability and Transformation Project (LTVTP), an interdisciplinary, multi-institution collaborative effort led by Dr. Margaret Nelson at Arizona State University that focused on developing detailed comparisons among major social transformations throughout the prehispanic U.S. Southwest.
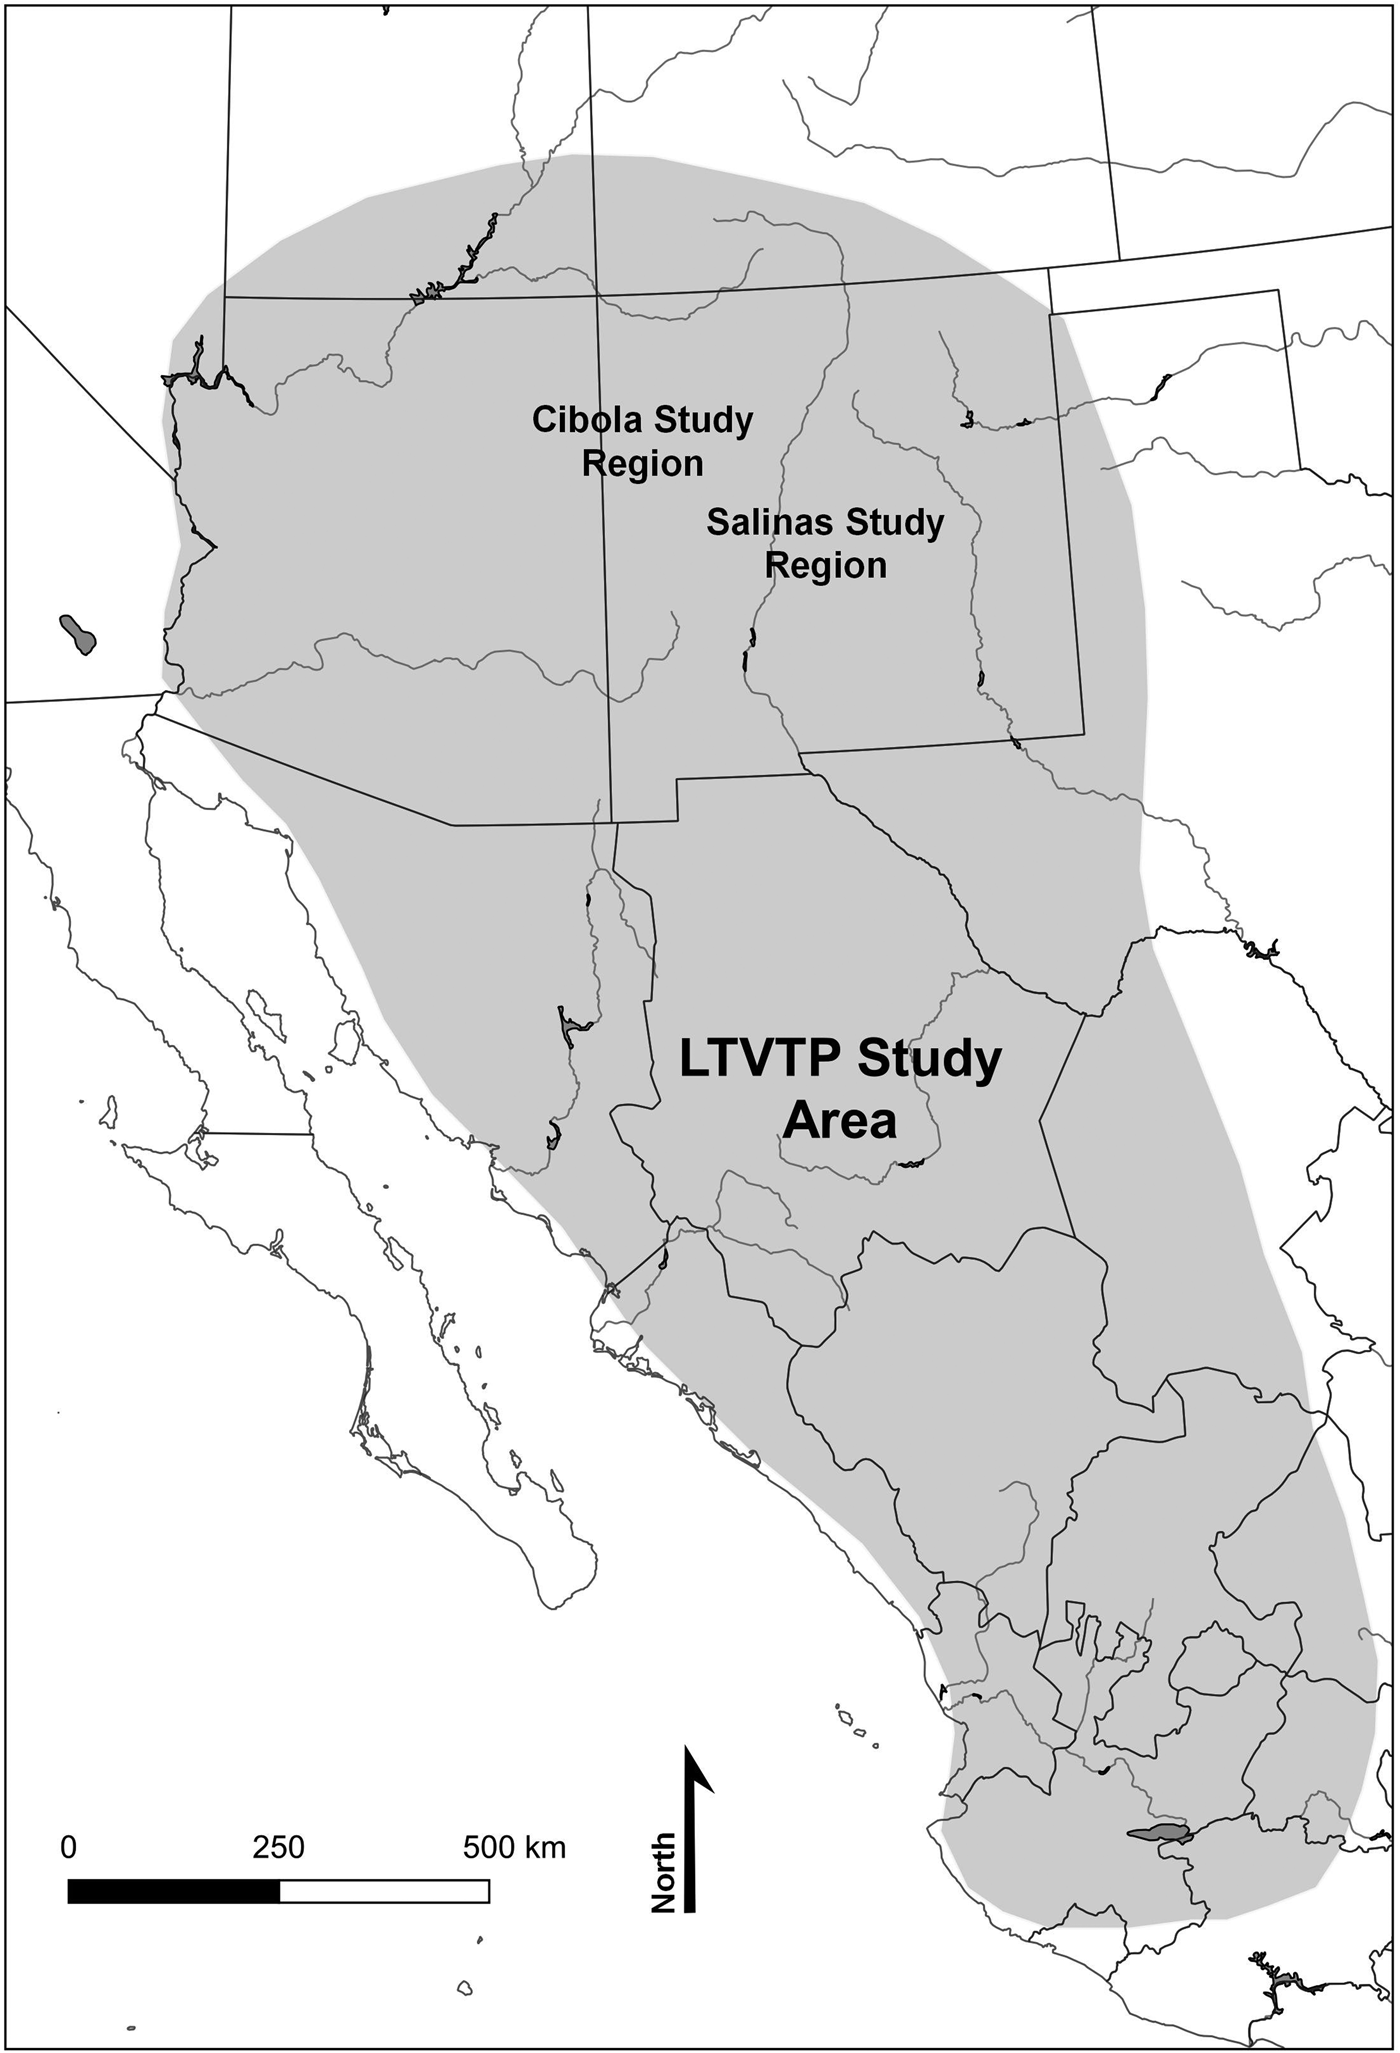
Figure 1. Map of our study areas—the Cibola and Salinas Regions—within the context of the larger Long-Term Vulnerability and Transformation Project.
Risk Landscapes in Subsistence Societies
Strategies to mediate risk to food security in subsistence societies are globally observed phenomena, and research to better understand them has been a critical aspect of anthropological literature for decades. These strategies often come as a suite of tactics that work in concert, having been tailored to the socioecological system in which food is procured. Communities extensively modify their agricultural landscape to ensure productivity over time and space by building check dams, terraces, irrigation canals, and gridded gardens (e.g., Denevan Reference Denevan2001; Doolittle Reference Doolittle2000). Others establish extensive social networks or religious practices to ensure sufficient productivity over time (e.g., Lansing Reference Lansing1991). Wiessner (Reference Wiessner, Leacock and Lee1982), for example, documents the ability of social networks to mitigate food shortfall, which lies in the anticorrelation of factors that affect food availability or production among members of hunter-gatherer peoples in Botswana. Winterhalder and colleagues (Reference Winterhalder, Lu and Tucker1999) also document an extensive review of risk-mediating strategies in subsistence societies and provide a model for conceptualizing the range of strategies that could be incorporated into a subsistence system to ensure food security. We build upon this extensive literature, which often centers on a given place on the landscape, focusing on climate-driven risk to agricultural food security in marginal environments at a landscape scale.
Climate-driven food shortages were a key source of risk to prehispanic peoples of the northern U.S. Southwest. Farmers in this region relied on rainfall for agricultural production, yet in the time periods we are considering (AD 900–1670), paleoclimate reconstructions show that people across much of this region would not have been able to rely on rainfall amounts alone to support crop production (Dean Reference Dean, Doyel and Dean2006). Moreover, given that rainfall is spatially and temporally unpredictable, this area is classified as a highly marginal environment for modern agricultural production (Prevost et al. Reference Prevost, Ahrens and Kriz1984; Sandor and Homburg Reference Sandor, Homburg, Ingram and Hunt2015). Despite these environmental challenges, prehispanic farmers in these areas supported thousands of people for hundreds of years through shrewd agricultural and risk-mitigating strategies that we can observe archaeologically today (Gumerman Reference Gumerman1988; Spielmann et al. Reference Spielmann, Nelson, Ingram and Peeples2011; Tainter and Tainter Reference Tainter and Tainter1996).
Many case studies illustrate the innovative nature of these risk-mediating strategies across the northern Southwest, illuminating how people expanded exchange networks, sharing, and storage facilities during times of stress (e.g., Spielmann and Aggarwal Reference Spielmann, Aggarwal and Hegmon2017:252–254). Dean (Reference Dean, Doyel and Dean2006), for example, provides a case study from Kiet Siel in northeastern Arizona where rainfall became increasingly unpredictable and the water table lowered in the late AD 1200s, making agriculture a riskier endeavor. He documents increasing numbers of storage facilities over time as living room space decreased, supporting the assertion that storage was more heavily relied upon during this time of stress. Hegmon (Reference Hegmon1989, Reference Hegmon1991) models sharing patterns of Hopi communities using ethnographic data on their agricultural strategies. She finds that over half of all Hopi households would have failed within 20 years if sharing had not been incorporated into their economic system, highlighting the risky nature of agriculture in the area in the absence of social networks. Hegmon concludes that a restricted sharing strategy, in which households share part, but not all, of their harvest with selected households, provides the highest rate of success for Hopi communities. These strategies would have lessened the impact of climate change (either sudden shocks or more gradual shifts) on agricultural food security in these prehispanic communities.
The people living in the Salinas and Cibola regions did not construct any substantial irrigation systems to divert water to crops in a desert environment. Instead, they chose favorable locations for rainfed agriculture—in alluvial fans where runoff frequently concentrated or in areas with high water tables. They also diverted and conserved water through rock alignments, check dams, and gridded gardens (Doolittle Reference Doolittle2000; Sandor and Homburg Reference Sandor, Homburg, Ingram and Hunt2015; Sandor et al. Reference Sandor, Norton, Homburg, Muenchrath, White, Williams, Havener and Stahl2007). Farmers would have mitigated the risk of agricultural subsistence shortfall in the many different ways that have been outlined by anthropological and archaeological literature, but here, we focus on storage, gathering of wild resources, and/or drawing upon social networks for our analysis. Critically, the success of these strategies depended on deeply embedded local knowledge that would have enhanced overall food security.
Methodology for Quantifying and Evaluating Risk in the U.S. Southwest: Social Networks, Storage, and Wild Resources
Our study seeks to evaluate the relationship between major social transformations and risk mitigation strategies, which may have been stressed due to changing patterns in climate at a landscape scale. To understand the potential for stress on these risk-buffering strategies and how they may have related to social transformations in the past, we model the spatiotemporal patterns of agricultural failure, and then we examine how patterns of predicted crop failure may have correlated with other places across the landscape, the availability of wild resources, and the reliability of storage over time. Because the main driver of food security in the northern Southwest was rainfed agriculture, we focus on temporal and spatial variability in precipitation during the agricultural growing season (May through October), which would have largely determined agricultural success. Experimental studies in the Cibola region and other parts of the Southwest have demonstrated a strong relationship between growing-season precipitation and maize production, making it a reasonable proxy for this analysis (Benson Reference Benson2011; Bocinsky and Varien Reference Bocinsky and Varien2017; Muenchrath et al. Reference Muenchrath, Sandor, Norton and Homburg2017).
To understand how the structure of the risk landscape changed through time, we evaluate our risk reduction strategies via modeled paleoenvironmental reconstructions. We approach these as a suite of strategies that can be relied on at different times under different conditions. The probability of failure is assessed through the analysis of the spatial and temporal structure of growing-season precipitation and its change through time. We do not attempt to model actual precipitation and yields of particular fields. Instead, we ask how success of agricultural fields and the viability of potential risk-mediation strategies vary across space and time. We then examine what this variability might mean for the reliability of these strategies in times of need. As such, our calculations are standardized to location in order to understand how changes over time and space deviate from previous years. For example, when agricultural crops fail, do farmers have options for reliable access to wild resources or social networks? Or, was agricultural production of previous years successful enough that it allowed for the storage of surplus products?
We do not assume that optimal subsistence shortfall strategies will emerge on particular landscapes. The existence of nearby wild resources, for instance, does not mean that they were exploited. Similarly, we do not assume that investments in near and distant relationships were strategically and optimally designed to minimize the risk of subsistence shortfalls. Instead, we recognize that social relationships and obligations at the household, village, and regional scales were driven by more than subsistence concerns and/or may have emerged under different environmental conditions. The comparison, however, of known social relationships to those that would have emerged were subsistence the only concern can provide important insights into the drivers of social relationships and obligations. Similarly, the placement of communities near regions of abundant wild resources during crop-stressed times can tell us something about how these populations were perceiving and exploiting the landscape. We acknowledge that our identified risk reduction strategies do not represent the complete risk landscape, but they provide an initial exploratory analysis that can be built upon in future studies. Other potential aspects of risk that could be added to the model include temperature, winter precipitation, anthropogenic alterations to the environment, and transportation costs of goods (among many other factors) that could be locally contextualized depending on the region of study.
In order to evaluate the risk landscapes for our case studies, we created a series of maps and figures to visualize the potential for the use of our identified risk mediation strategies and how reliable or ineffective they could have been during a given time period across our case study regions. We assume that farmers from the Salinas and Cibola regions had roughly a two-generation (60-year) memory of past climate, and this knowledge was used to tailor the analysis of the agricultural system to expected conditions. In this way, we compare extant climate conditions at a given time (the current year of analysis) to an antecedent running mean of the previous 60 years (61 years in total to include the current year of analysis). All data were processed and analyzed in R (version 3.3 “Frisbee Sailor”), a free software environment for statistics and graphics. Table 1 illustrates how we evaluated our various strategies via our proposed risk landscape approach.
Table 1. Evaluation of Risks to and Strategies for Food Security in the U.S. Southwest.
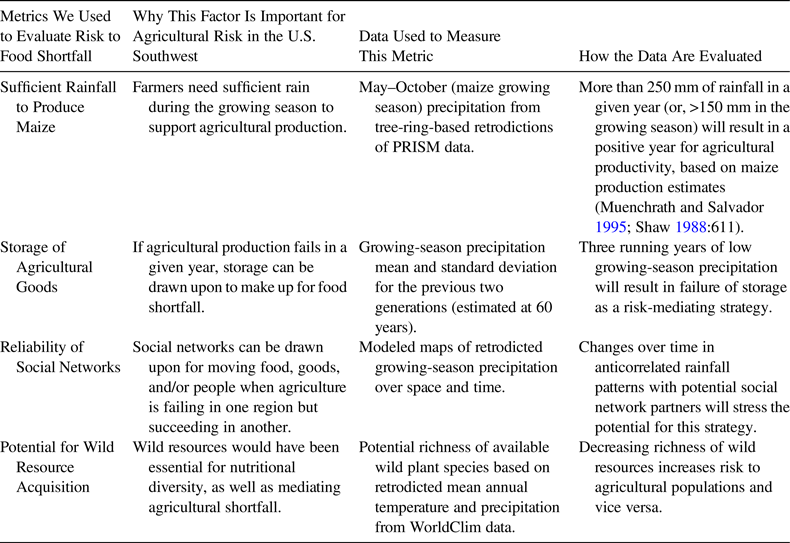
Note: These four metrics comprise our “risk landscape.”
Baseline Growing-Season Precipitation Data
Reconstructing risk landscapes to evaluate the metrics outlined in Table 1 requires retrodicted growing-season precipitation totals for the periods of interest at a high spatial resolution across the case study regions. The PRISM dataset (PRISM Climate Group 2004) provides gridded monthly precipitation data interpolated from weather stations across the contiguous United States, resulting in a raster of 30 arc-second (~800 m × 800 m) pixels of monthly precipitation data dating from 1910 to the present. To link the modern PRISM data to our archaeological case studies, paleoclimate reconstructions of growing-season precipitation were created using the analytical package Paleoclimate Reconstruction from Tree Rings Using Correlation-Adjusted corRelation (PaleoCAR), developed in R (Bocinsky et al. Reference Bocinsky, Rush, Kintigh and Kohler2016). The resulting spatiotemporal paleoclimate reconstruction consists of an approximately 800 m gridded resolution dataset of growing-season precipitation for the entire U.S. Southwest, including the Salinas and Cibola regions, from AD 1 to 2000. Different locations have different uncertainties associated with the reconstructions, depending on the location and number of tree-ring chronologies that PaleoCAR is able to use for each location's reconstruction. At any given location, uncertainties increase the farther we backcast, and PaleoCAR reconstructions have been validated through comparisons with other proxies (Bocinsky and Kohler Reference Bocinsky and Kohler2014). Each cell's retrodicted growing-season (May through October) precipitation can be displayed on a map, with one map produced for each year. From those data, we derive maps displaying the average growing-season precipitation over temporal intervals of interest. These maps and the numbers behind them provide the baseline data from which we calculated our storage shortfall index and anticorrelation measures, described below. To further quantify the analysis, we created a 10 km buffer around a representative selection of sites within the Cibola region. The cells within each buffer were queried to generate a dataset of values for each transformation period and for each data type. These datasets are summarized and plotted as boxplots to illustrate the range of values surrounding each site (see Figure 9).
Reliability of the Storage of Maize over Time
Building upon the retrodicted precipitation measurements, storage failure at a location is assessed through the frequency of growing-season precipitation shortfalls that occurred in that grid cell during three consecutive years (maize is argued to be storable for that amount of time [Stevenson Reference Stevenson1904:353; Whiting Reference Whiting1939:15]). The effectiveness of storage as a risk-mitigating strategy is evaluated through a scripted procedure written in R (Snitker Reference Snitker2019). Precipitation shortfalls are defined as years when the growing-season precipitation is more than 0.5 standard deviationFootnote 1 below the running mean calculated over the previous two generations, including the year of analysis, resulting in a 61-year running mean. For each modeled year, a z-score (number of standard deviations that year's value lies above [ + ] or below [−] the running mean) is calculated for each grid cell in the landscape. Precipitation z-scores for the current and each of the two previous years are then evaluated against the threshold of 0.5 standard deviation (σ) below the running mean. When three years in a row fall below the −0.5σ threshold, we tally that last year as a “storage failure” for that grid cell. The proportion of years with storage failures over the given timespan is then visualized for each cell on a map as the storage shortfall index (Figure 2). Populations in areas that experience high frequencies of storage shortfall due to temporal and spatial variation in precipitation probably could not rely on this strategy to mitigate food shortfall.
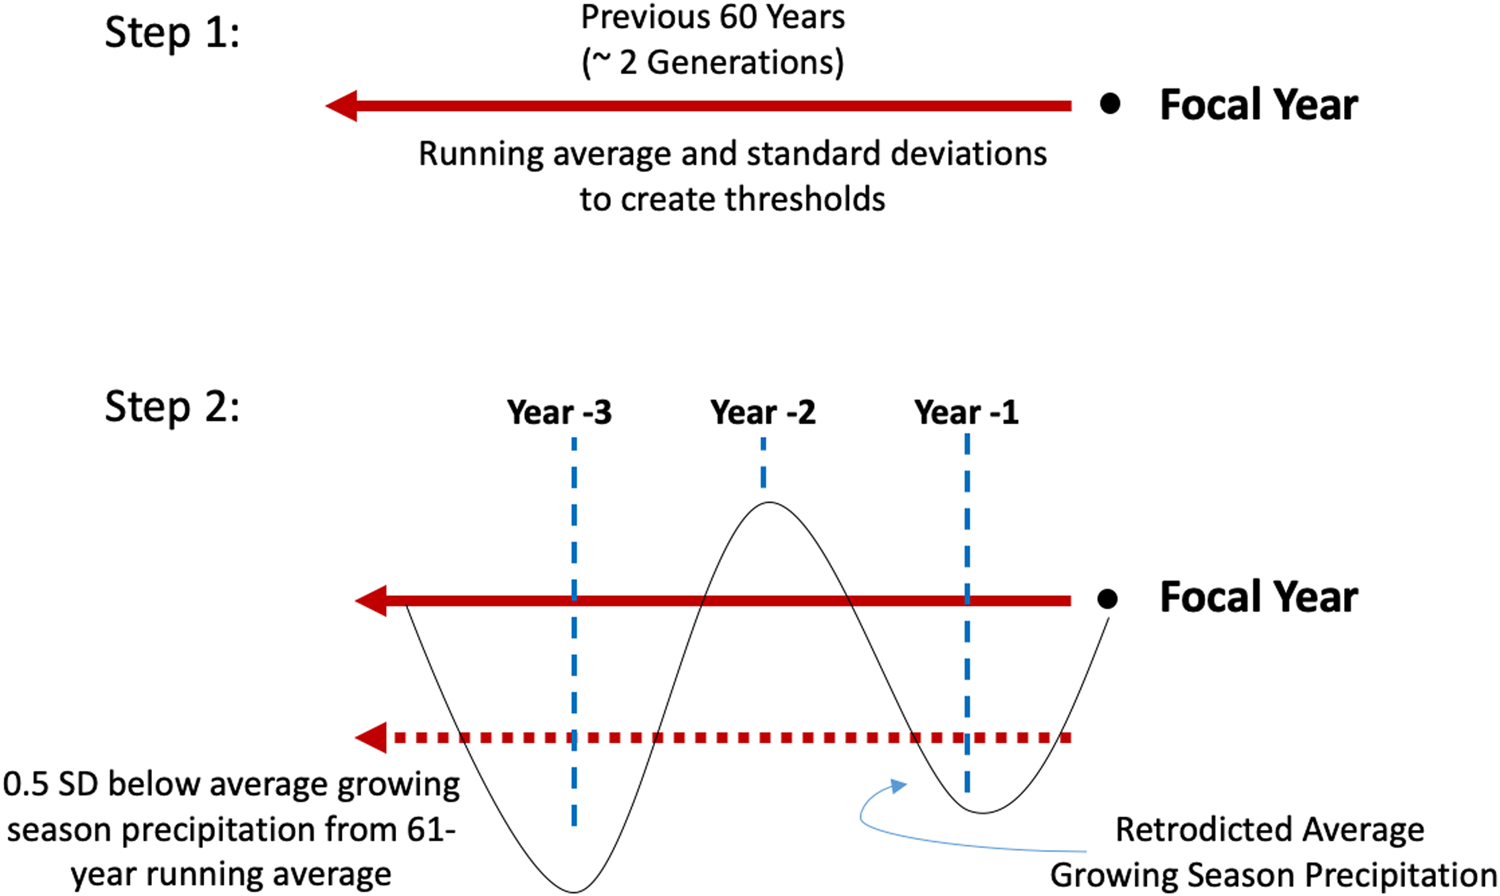
Figure 2. Schematic of the calculation of storage shortfall maps. This calculation will produce a rasterized map (see Figure 6 as an example) that displays the proportion of years during the transformation period (e.g., AD 1201–1300) that precipitation in the three previous years fell below the −0.5σ threshold.
The Reliability of Social Networks Based on Anticorrelated Growing-Season Precipitation
We measure the potential for social networks to mitigate food shortages and assess whether that potential is stressed over time by measuring the anticorrelation of growing-season precipitation within our regions of focus over a defined temporal interval of archaeological interest (for example, when a social transformation has been observed in the archaeological record). For a given cell of interest (what we refer to as “focal cells”), we can indicate by colors on a map the extent to which the growing-season rainfall for every other cell on the map is anticorrelated with the rainfall of that focal cell. The selection of a different cell of interest, however, will produce a different anticorrelation map, given that the risk relationships are relative to the cell of interest. Although an anticorrelation map could, in principle, be produced for each of the 37,000 800 m × 800 m cells in the Cibola case study area, this is impractical.
To structure the archaeological interpretation of the risk landscape, we identified a limited set of these focal cells that are reasonably spaced over occupied portions of the region. They include locations of known archaeological sites and other culturally important locations. We then calculate an anticorrelation map for each focal cell for each temporal interval. To measure anticorrelation for our case study, we choose not to use standard measures, such as Pearson's r or a rank-order correlation coefficient. The reason is that high positive or negative correlations could be produced by very small but patterned variation around a precipitation mean—variation that would be meaningless from the standpoint of food production. We have devised a more meaningful, two-dimensional measure that focuses on good and bad years, as defined above, that allows us to standardize the calculation to location. For this analysis, the date ranges in the two case-study areas were then divided into temporal intervals based on the timing of culturally important transformations in the archaeological record (refer to Table 2 in the next section for identified intervals of interest the Cibola region). Summarizing the data within these temporal intervals allows us to examine how the changing structure of the risk landscape may have been associated with these major cultural transformations.
Table 2. Analysis of Our Risk Landscape Parameters through Time in the Cibola Region.
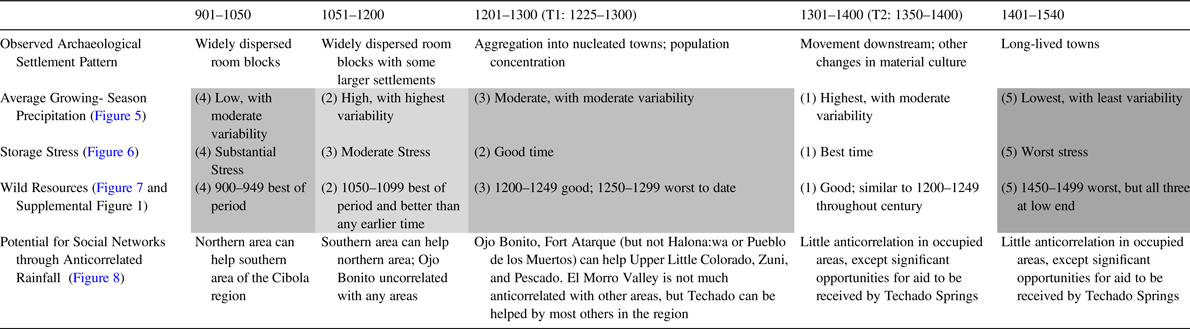
Notes: Cells noted with (1) light gray indicate best times for the reliability of this strategy, whereas (5) dark gray indicates time of relative stress. Dates are in AD.
We assume that the presence of substantial year-round residences indicates that people were employing agricultural strategies that were successful most years. Consequently, we start by characterizing years that were unusually wet or dry for each particular location on the landscape. This calculation is done using an R script (Snitker Reference Snitker2019). For every cell in every year, it calculates a 61-year antecedent running mean (this mean includes the year of focus plus the 60 years previous) and standard deviation for the cell's retrodicted growing-season precipitation. It characterizes that cell's retrodicted precipitation value for that year in terms of the number of standard deviations above or below the running mean (i.e., a z-score). If the cell's precipitation value is at or above 0.5 standard deviation above the mean (z ≥ 0.5), the cell is coded as experiencing an unusually “good year” in terms of potential agricultural production. If the focal cell's precipitation value is at or below a 0.5 standard deviation below the mean (z ≤ −0.5), it is coded as experiencing a particularly “bad year.” Otherwise, it is considered a normal year.
During each of the focal cell's good years, the anticorrelation procedure identifies the subset of cells within the study region that are experiencing bad years (as described above). Similarly, when the focal cell is experiencing a bad year, the anticorrelation procedure identifies all of the cells within the study region that are experiencing good years. Normal years are ignored in this calculation. To create a risk landscape visualization for a temporal interval of interest for a given focal cell, we color every cell on the landscape except the focal cell, using the following procedure. For every nonfocal cell on the landscape, we count the number of years within the temporal interval that it could help the focal cell (good year for nonfocal cell, bad year for focal cell), and we display that value (as a proportion of the number of years in the interval) on a continuum of varying saturations of blue. Similarly, we count the number of years the focal cell could help the nonfocal cell (bad year for nonfocal cell, good year for focal cell), and we display those values on a continuum of varying saturations of red. We can blend the red and blue signatures together to get a two-dimensional range from white to red on one axis, white to blue on the other, and white to dark purple on the diagonal. A deep purple in a cell, for instance, means that the cell and the focal cell are well suited to helping each other—their good and bad years are anticorrelated in a relatively large proportion of the years. White means they can rarely, if ever, help each other. Deep blue means a “one-way” relationship: the nonfocal cell can often help the focal cell, but the focal cell can rarely, if ever, help the nonfocal cell. Figure 3 provides a schematic of this analytical process.
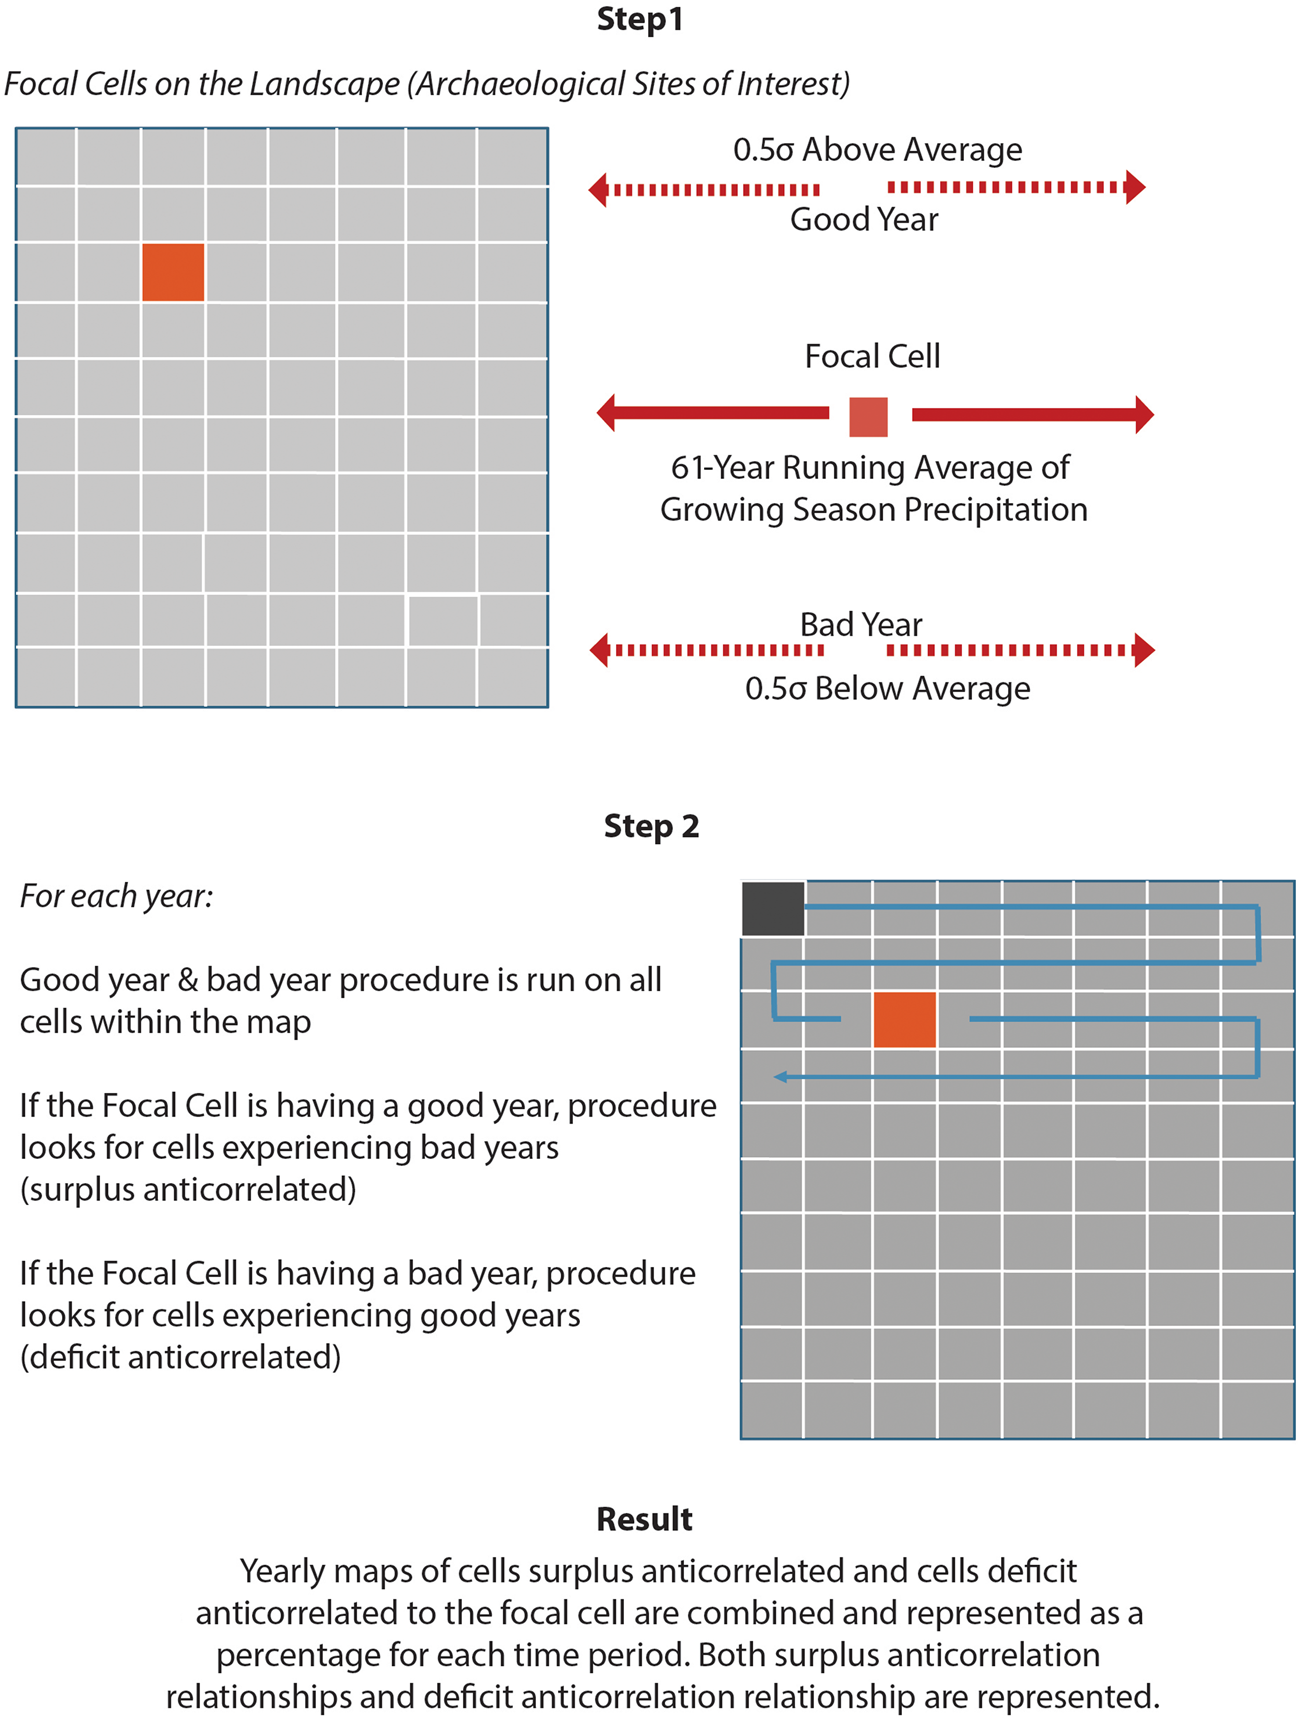
Figure 3. Schematic of the calculation of anticorrelation maps. (Color online)
These calculations are more easily understood by examining a concrete case. Here, we provide an example from the Salinas region, the results of which have been published (Strawhacker et al. Reference Strawhacker, Snitker, Spielmann, Wasiolek, Sandor, Kinzig, Kintigh and Spielmann2017), and we compare it to the Cibola case in this article. In the Salinas maps for the AD 1351–1450 interval, we analyzed the risk landscape relative to the focal points at the sites at Abo, Gran Quivira, and Robinson (Figure 4). The suite of anticorrelation values around each site indicates different potential options for favorable or unhelpful connections. For example, with Abo as the focal cell (top-left map), much of the area to the east could help Abo, including the Jumanos Pueblo of Gran Quivira, as noted by the blue colors. On the other hand, Gran Quivira (top-right map) can help the majority of the case study area with little reciprocation, as indicated by the reds in much of the map. We will revisit this example and expand on its implications at the end of this article when we compare it to the Cibola case study.
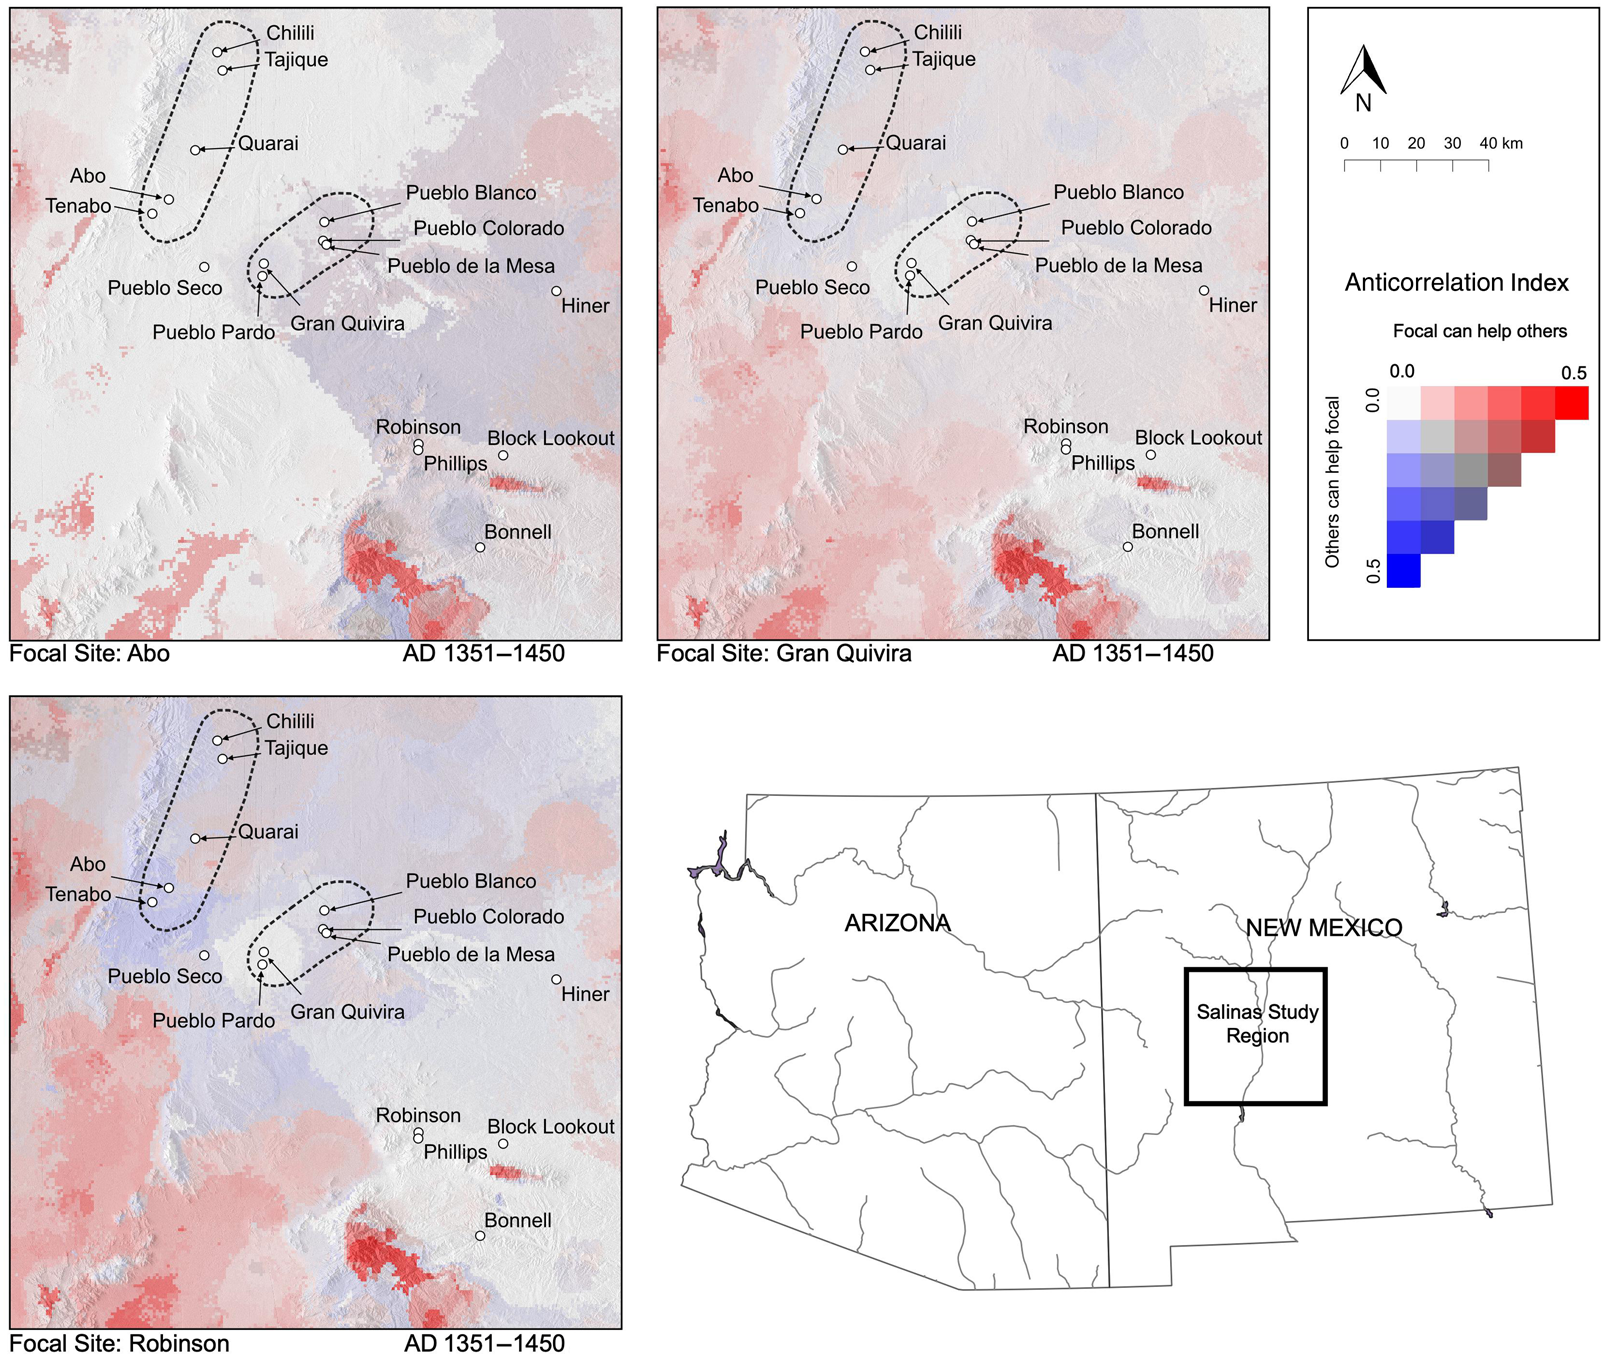
Figure 4. Example anticorrelation map from three focal sites in the Salinas Region, AD 1351–1450.
Wild Resources
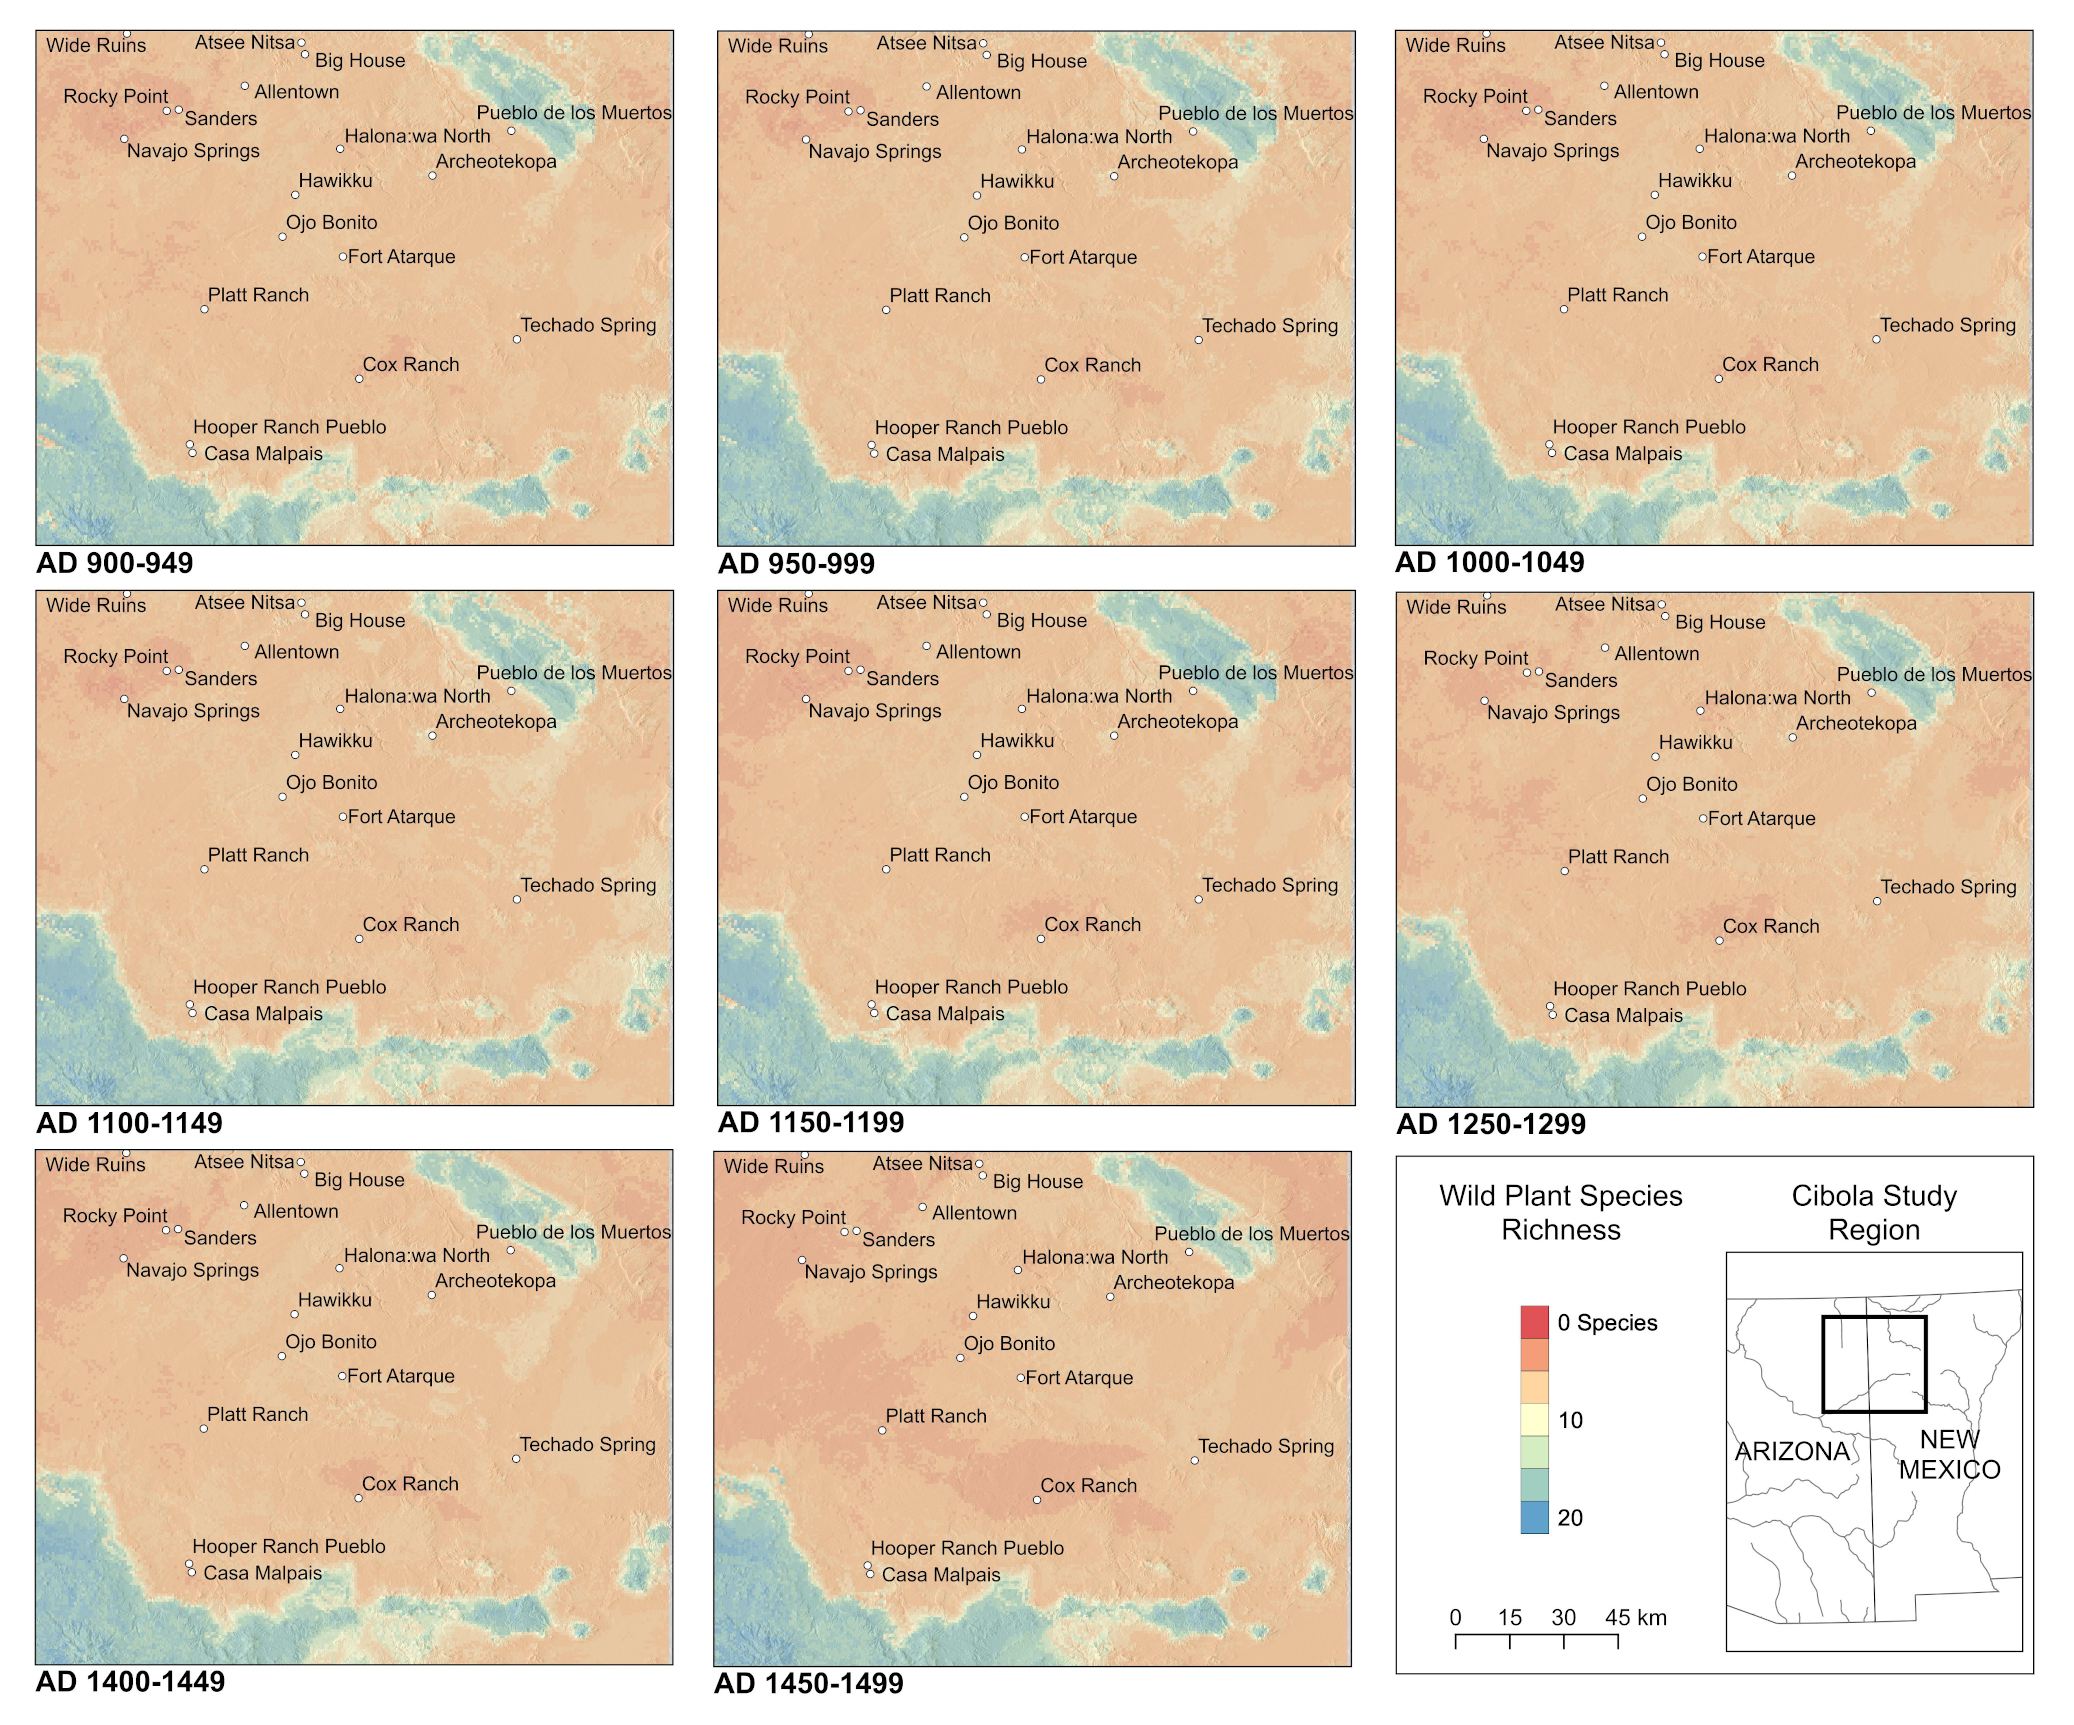
We estimate climate-driven changes to potential wild plant diversity by first identifying a list of historic staple “wild” plant species from the North American Ethnobotany Database (NAEB 2018) and drawing on archaeological knowledge of wild plant use. This data collation yields a list of 100 species important for the subsistence of prehispanic farmers in the northern Southwest. Ecological niche models are then developed for each of these species by implementing the Maxent software (Phillips et al. Reference Phillips2011) in the “biomod2” package in R (Thuiller et al. Reference Thuiller, Georges, Engler and Breiner2014) to understand the potential ranges of each species during our time periods of interest. Models are based on retrodicted annual temperature and precipitation reconstructions from WorldClim v. 1.4 (Hijmans et al. Reference Robert J., Cameron, Parra, Jones and Jarvis2005), which provides global 30 arc-second interpolated, gridded climate data. WorldClim data are used for fitting ecological niche models for our wild resource analysis to extend this analysis into Northern Mexico and encapsulate the full distributions of many of the species present in the Southwest (PRISM data do not extend into this region). The expected range for each species is defined individually as the geographic space within 1.5σ of the climate limits for occurrences with respect to both mean annual temperature (MAT) and mean annual precipitation (MAP). This method generates species ranges that are proportional to the climatic niche breadths of individuals species, eliminating the potential for selecting ranges with extreme values that could bias model results. This approach allows us to create maps that display the potential species richness of those 100 plants at 50-year intervals from AD 900 to 1549, a subset of those intervals important to the Cibola social transformations of focus that we display in Figure 7 with remaining maps in Supplemental Figure 1. We acknowledge that a variety of factors can influence the availability and distribution of wild resources—including overhunting or gathering resulting in species depletion, complex fire landscapes, and other anthropogenic and natural alterations to the landscape—but this analysis provides a baseline understanding of the potential species richness that can be built upon in future modeling efforts.
Assessing Risk Landscapes in the Cibola Region of the U.S. Southwest
To demonstrate the concepts introduced above, we focus on the well-researched and data-rich Cibola region and compare the results to those previously published from the Salinas region. We assess how the risk landscape changed over time, potentially stressing food security and established risk-mediating strategies, and how that changing risk landscape may have related to major social transformations observed in the archaeological record.
Social Transformations in the Cibola Region
We examine the risk landscapes before and after two major transformations in the Cibola area (refer to Figure 10 for a map of the subregions): one at AD 1225–1300 and the second at approximately AD 1350–1400. From approximately AD 900 to 1200, the population was widely dispersed across the landscape in thousands of villages composed of one or more masonry room blocks, nearly all of which had fewer than 35 rooms. By AD 1240, clusters of room blocks with up to 500 rooms had appeared, although smaller settlements continued to be occupied (Table 2; Kintigh Reference Kintigh, Wills and Leonard1994, Reference Kintigh, Gregory and Wilcox2007).
In what we identify as the initial transformation (population nucleation) between about AD 1225 and 1300, the entire population aggregated into a relatively small number of towns, with numbers of rooms ranging from 60 to as many as 1400, usually within a single block of rooms (Huntley and Kintigh Reference Huntley, Kintigh, Adams and Duff2004). Most of these towns were in higher-elevation areas east of modern Zuni Pueblo and in the El Morro Valley or along the upper Little Colorado River between St. Johns and Springerville. The end of this transformation, between AD 1300 and 1350, was marked by a decrease in the number of towns; the smallest and the largest of the higher-elevation towns were depopulated at this time.
During the second transformation, dating between AD 1350 and 1400, the entire population moved to nine large closely spaced protohistoric towns, ranging from 170 to 900 rooms, at lower elevations along the Zuni River. These villages occupied an area from just east of Zuni Pueblo to the Arizona state line, an area that had only been lightly populated previously (Kintigh Reference Kintigh1985). Consequently, population was entirely concentrated in the center of the Cibola region, leaving the remainder of the region without large habitation sites. Substantial changes in material culture accompanied this second transformation, with the introduction of cremation and greater access to nonlocal ceramics and other exotic artifacts that likely represented the arrival of migrants from other portions of the Southwest and increased exchange with more distant areas (Peeples Reference Peeples2018).
Occupied Areas and Their Environments
Substantial population never occupied the high-elevation areas of the Zuni Mountains (above 7,400 ft. in elevation), which cut diagonally across the NE corner of the map, or in the White Mountains in the SW corner of the map (Figure 5). Prior to AD 1200, few people occupied the El Morro Valley south and west of the base of the Zuni Mountains. Most other parts of the study area were occupied during the AD 900–1050 period. Between AD 1050 and 1200, the population of the southern and western thirds of the study area became progressively sparser. The area along the Rio Puerco (northwest corner of the map) was mostly depopulated—with the exception of one large town near the Arizona/New Mexico border—by the time of the first transformation when the population of El Morro Valley and Pescado areas increased dramatically. Between AD 1050 and 1400, the population was very mobile, and nearly all settlements had short occupations, probably on the order of a generation or less. Notably, most of the very large towns dating between AD 1250 and 1350 had similarly short occupations. In contrast, all towns established during the protohistoric transformation had occupations of a century or more.
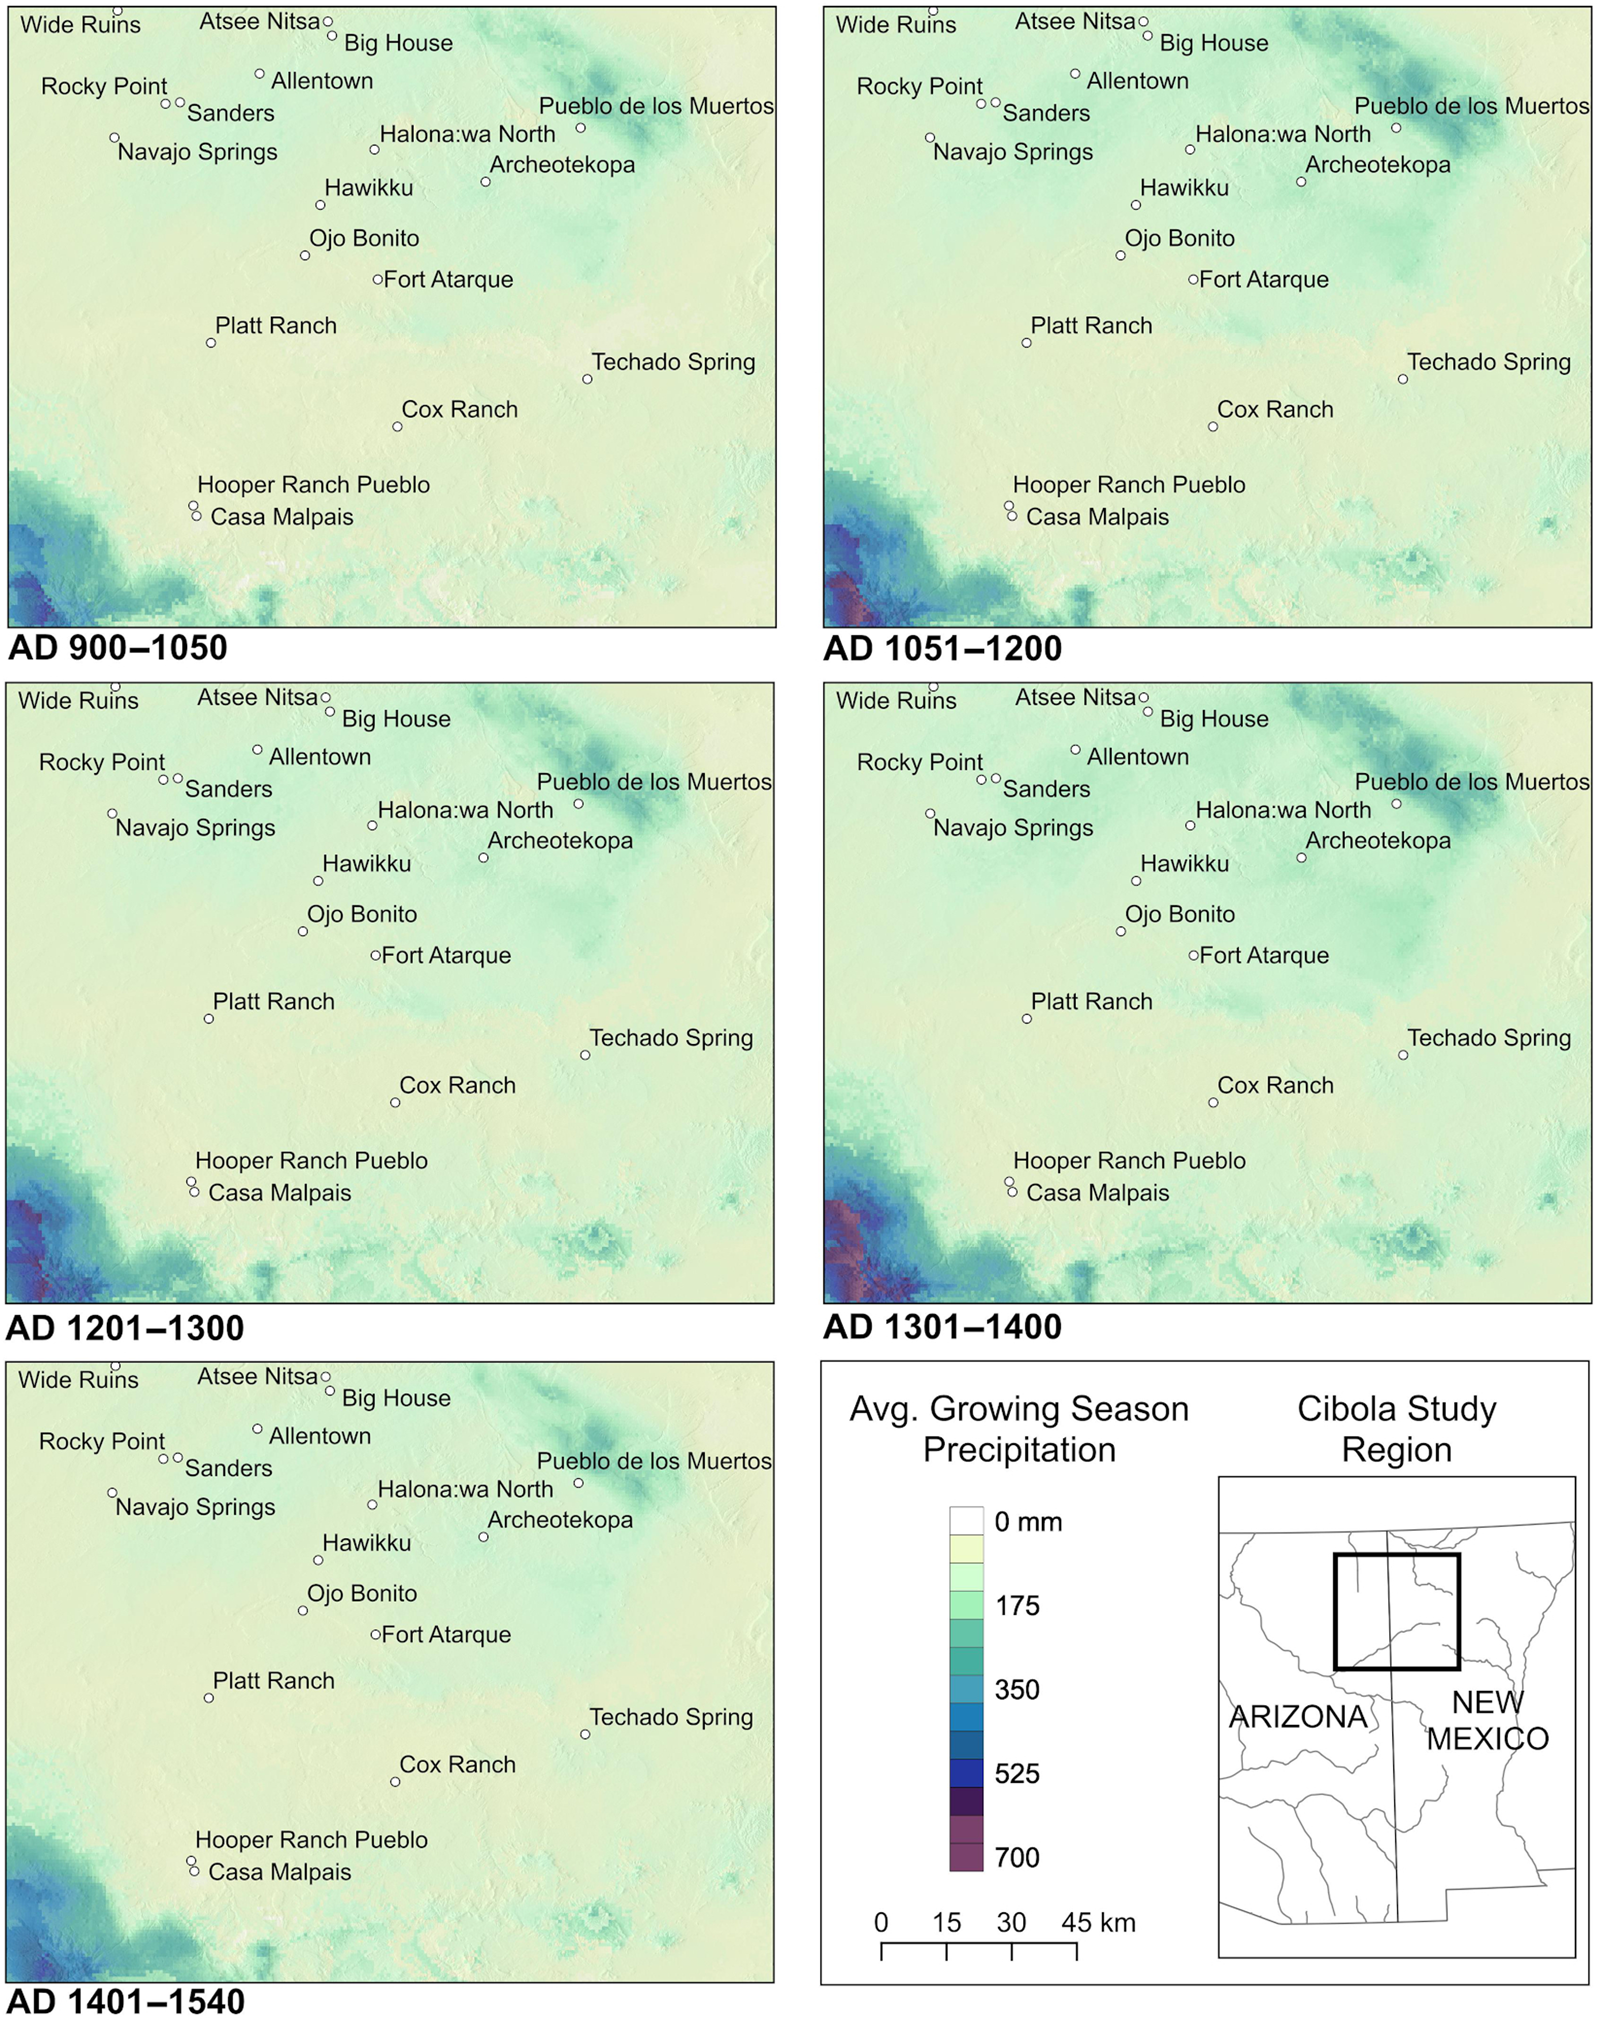
Figure 5. Growing-season precipitation from AD 901 to 1540 in the Cibola Region. (Color online)
Growing-Season Precipitation
The structure of the average growing-season precipitation across the landscape (Figures 5 and 9a) remained largely unchanged, although the AD 1300–1400 period was generally the wettest and AD 1400–1540 the driest. Unsurprisingly, the Zuni Mountains (with the boxplots from Pueblo de los Muertos being the closest site) and the White Mountains were the wettest areas, given their higher elevations relative to the rest of the Cibola region. It was also the case that, from AD 1250 on, most of the population lived in villages and towns in the better-watered areas to the south and west of the Zuni Mountains. Within the occupied areas, however, there was some variation in the average rainfall.
Storage Deficit
A clearer picture of precipitation-induced subsistence stress is evident in the storage deficit maps (Figures 6 and 9b). Across the Cibola area, storage deficits decreased over most of the occupied areas from the AD 900–1050 period through the AD 1300–1400 period. The largest deficits occurred in the AD 1400–1540 period, including in the 30 km stretch of the Zuni River from the vicinity of Halona:wa to Hawikku, which was the only area that remained occupied during this period.
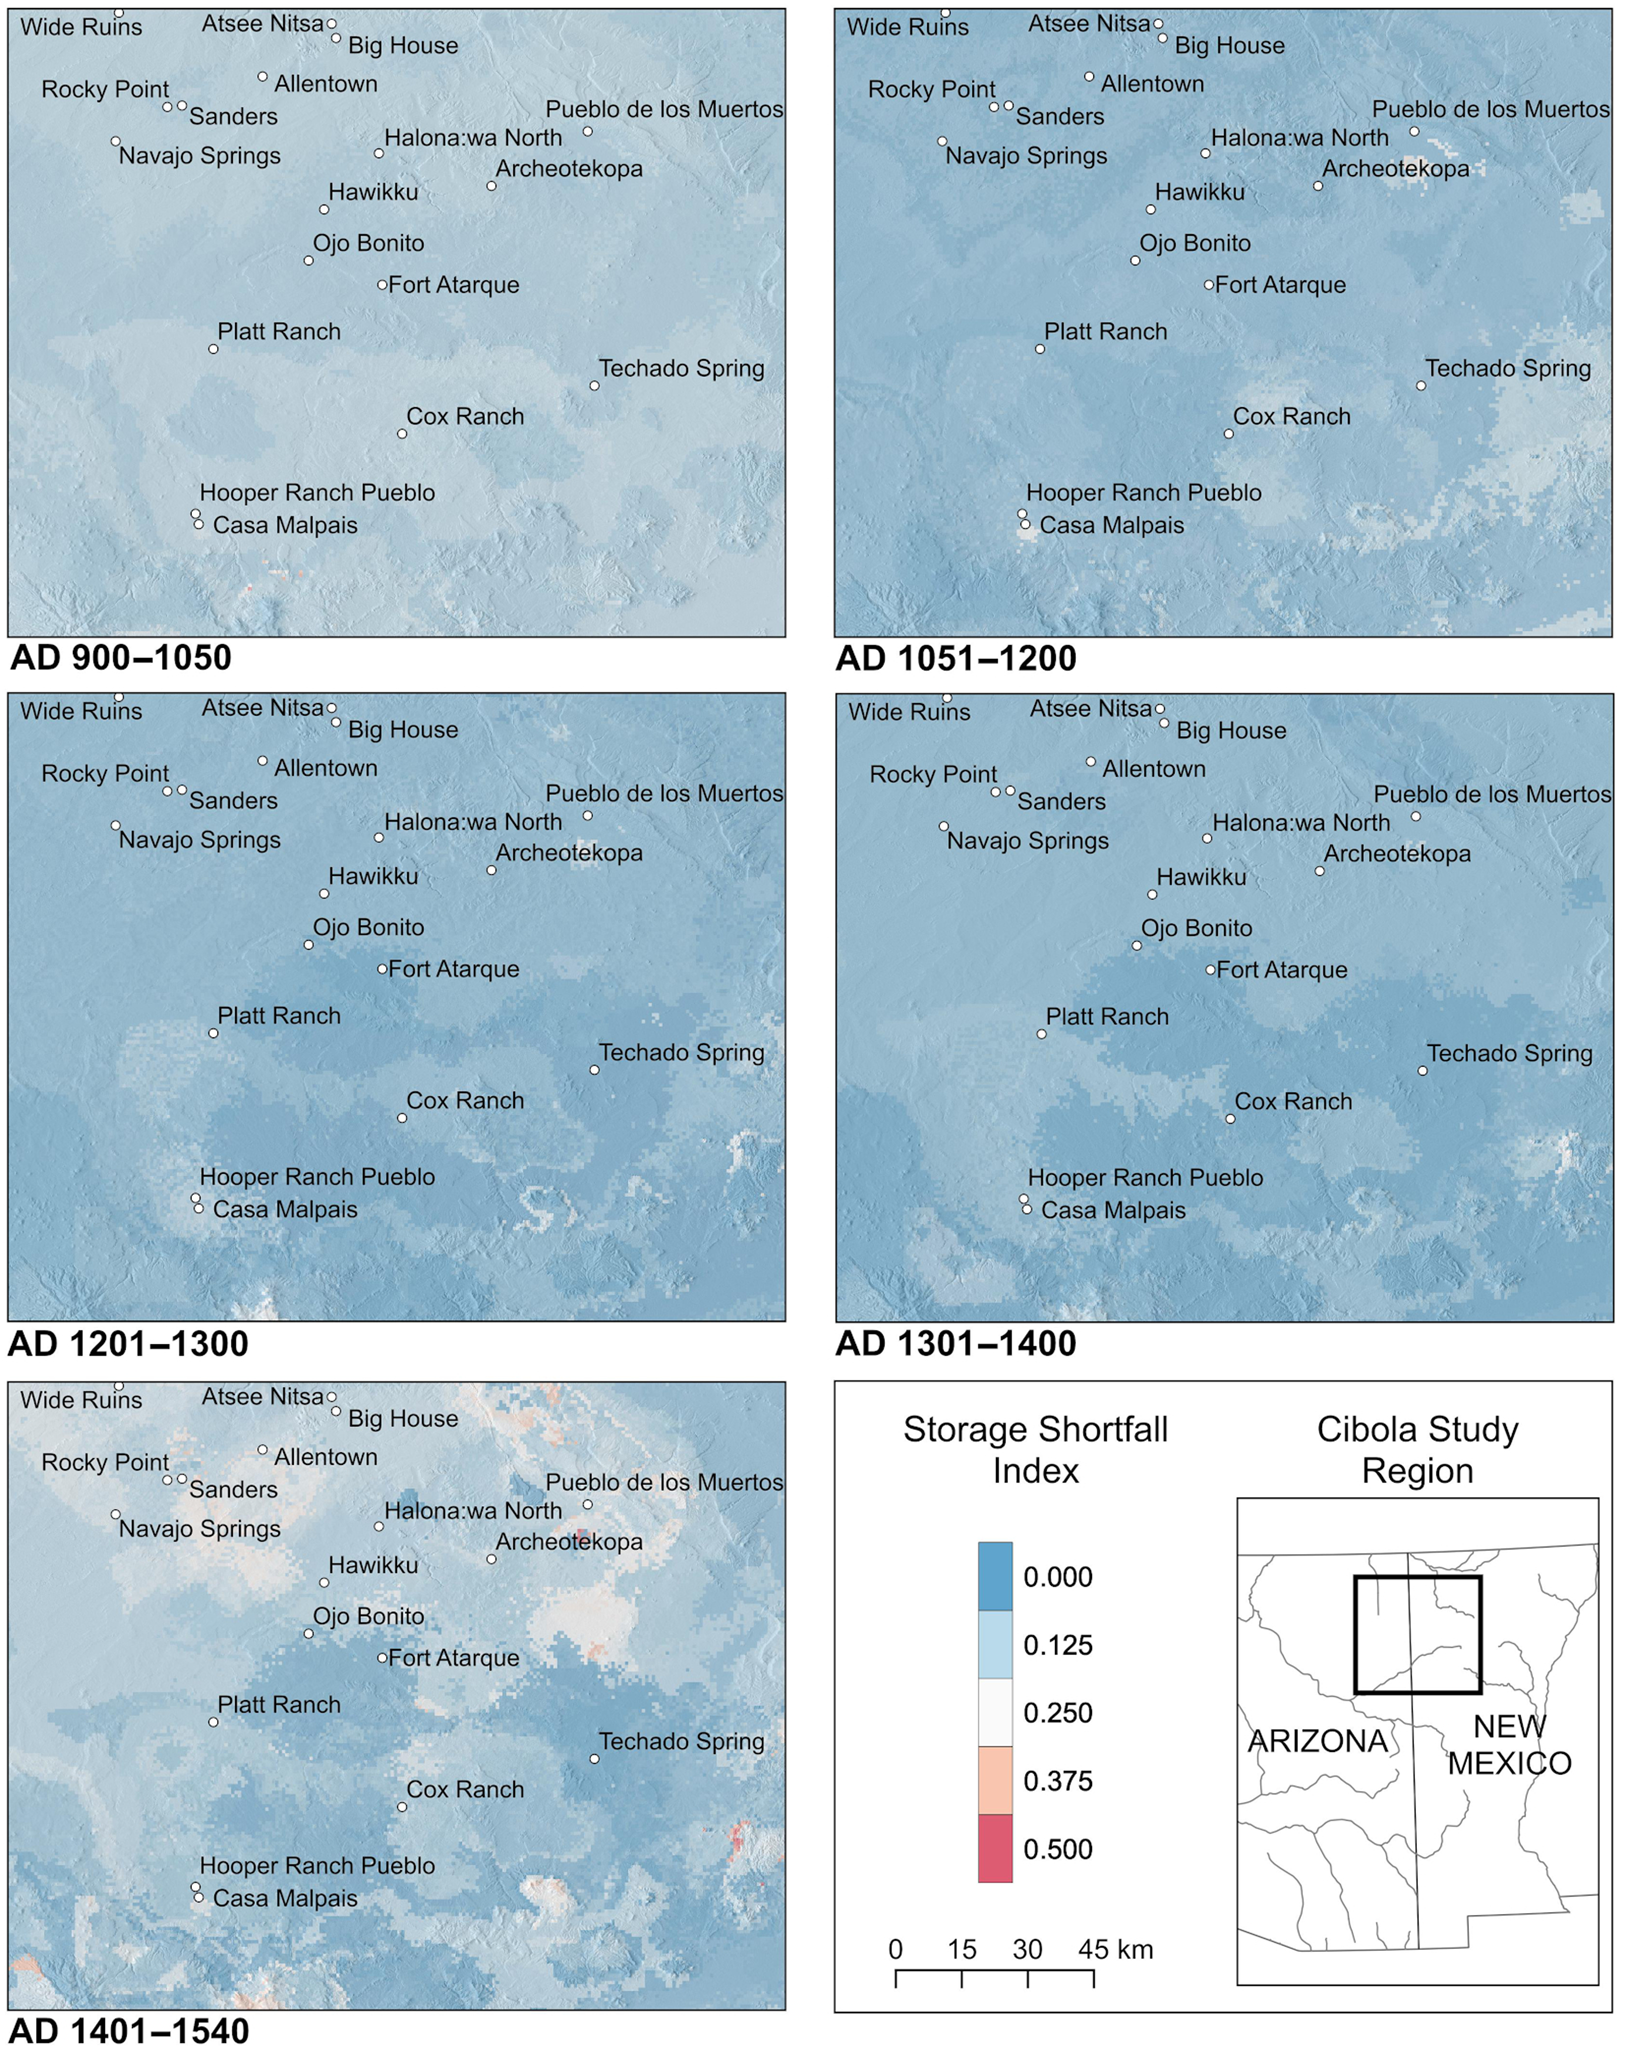
Figure 6. Evaluation of storage stress in the Cibola region through time. The map displays the proportion of years during each transformation period that precipitation in the three previous years fell below the −0.5σ threshold. (Color online)
Consequently, for most people, the long-term storage deficits that they experienced went from moderate stress before the first transition to relatively low stress during the first transition. Storage stress continued to ameliorate during the second transition, indicating a decreasing need for interaction or reliance on wild plants from the AD 900–1050 interval to the AD 1300–1400 interval. The low storage deficit of the second transition period (AD 1300–1400) changed to a high storage deficit in the AD 1400–1540 interval following the second transition, indicating a substantially increased need for access to food through social networks and/or acquisition of wild resources. During the second transition, however, archaeological evidence indicates a major shift in agricultural technologies—from heavy dependence on runoff agriculture to an increased reliance on spring and riverine irrigation along the Zuni River, which were less precipitation dependent (Kintigh Reference Kintigh1985). These new agricultural strategies could have ameliorated the impact of climate change on storage potential.
We should note that this storage deficit calculation does not take temperature into account. Low temperatures in the higher-elevation areas could shorten growing seasons to the point that crops would likely fail more frequently, leading to storage deficits that we do not model here. Temperature would have been a key variable for the El Morro Valley, for instance, which was initially—and heavily—occupied during the AD 1200–1300 and 1300–1400 intervals that were both relatively high in precipitation (despite the AD 1276–1299 drought) and low in temperature. The second transition was marked by movement of people into lower elevations along the Zuni River valley, where temperatures were higher and the growing season substantially longer, although the Zuni River can become dry during times of low precipitation (Kintigh Reference Kintigh1985).
Staple Wild Plant Diversity
Within the Cibola region, the baseline wild plant diversity of the occupied areas (calculated in 50-year time intervals) varied somewhat through the AD 900–1540 interval (Figures 7 and 9c; Supplemental Figure 1). It increased substantially from the AD 900–1049 period to AD 1050–1099 period and then decreased during the AD 1100–1199 period. It increased again in the AD 1200–1249 interval and then again decreased for the AD 1250–1299 interval. But the (new) occupation of the El Morro Valley and the continued occupation of the Pescado area, both immediately to the southwest of the Zuni Mountains, provided accessibility for a large percentage of the population to this area of very high wild plant diversity. From the AD 1250–1299 interval to the AD 1300–1349 interval, the staple wild plant diversity across the occupied area further improved. At this transition, however, the dramatic increase in typical village size (by more than an order of magnitude) worked against the utility of using wild plants to reduce food stress because these resources would have been depleted more easily.Footnote 2 Nonetheless, the wild plant diversity evidence indicates that the AD 1200–1349 period was highly favorable to rely on wild resources to mitigate food stress.
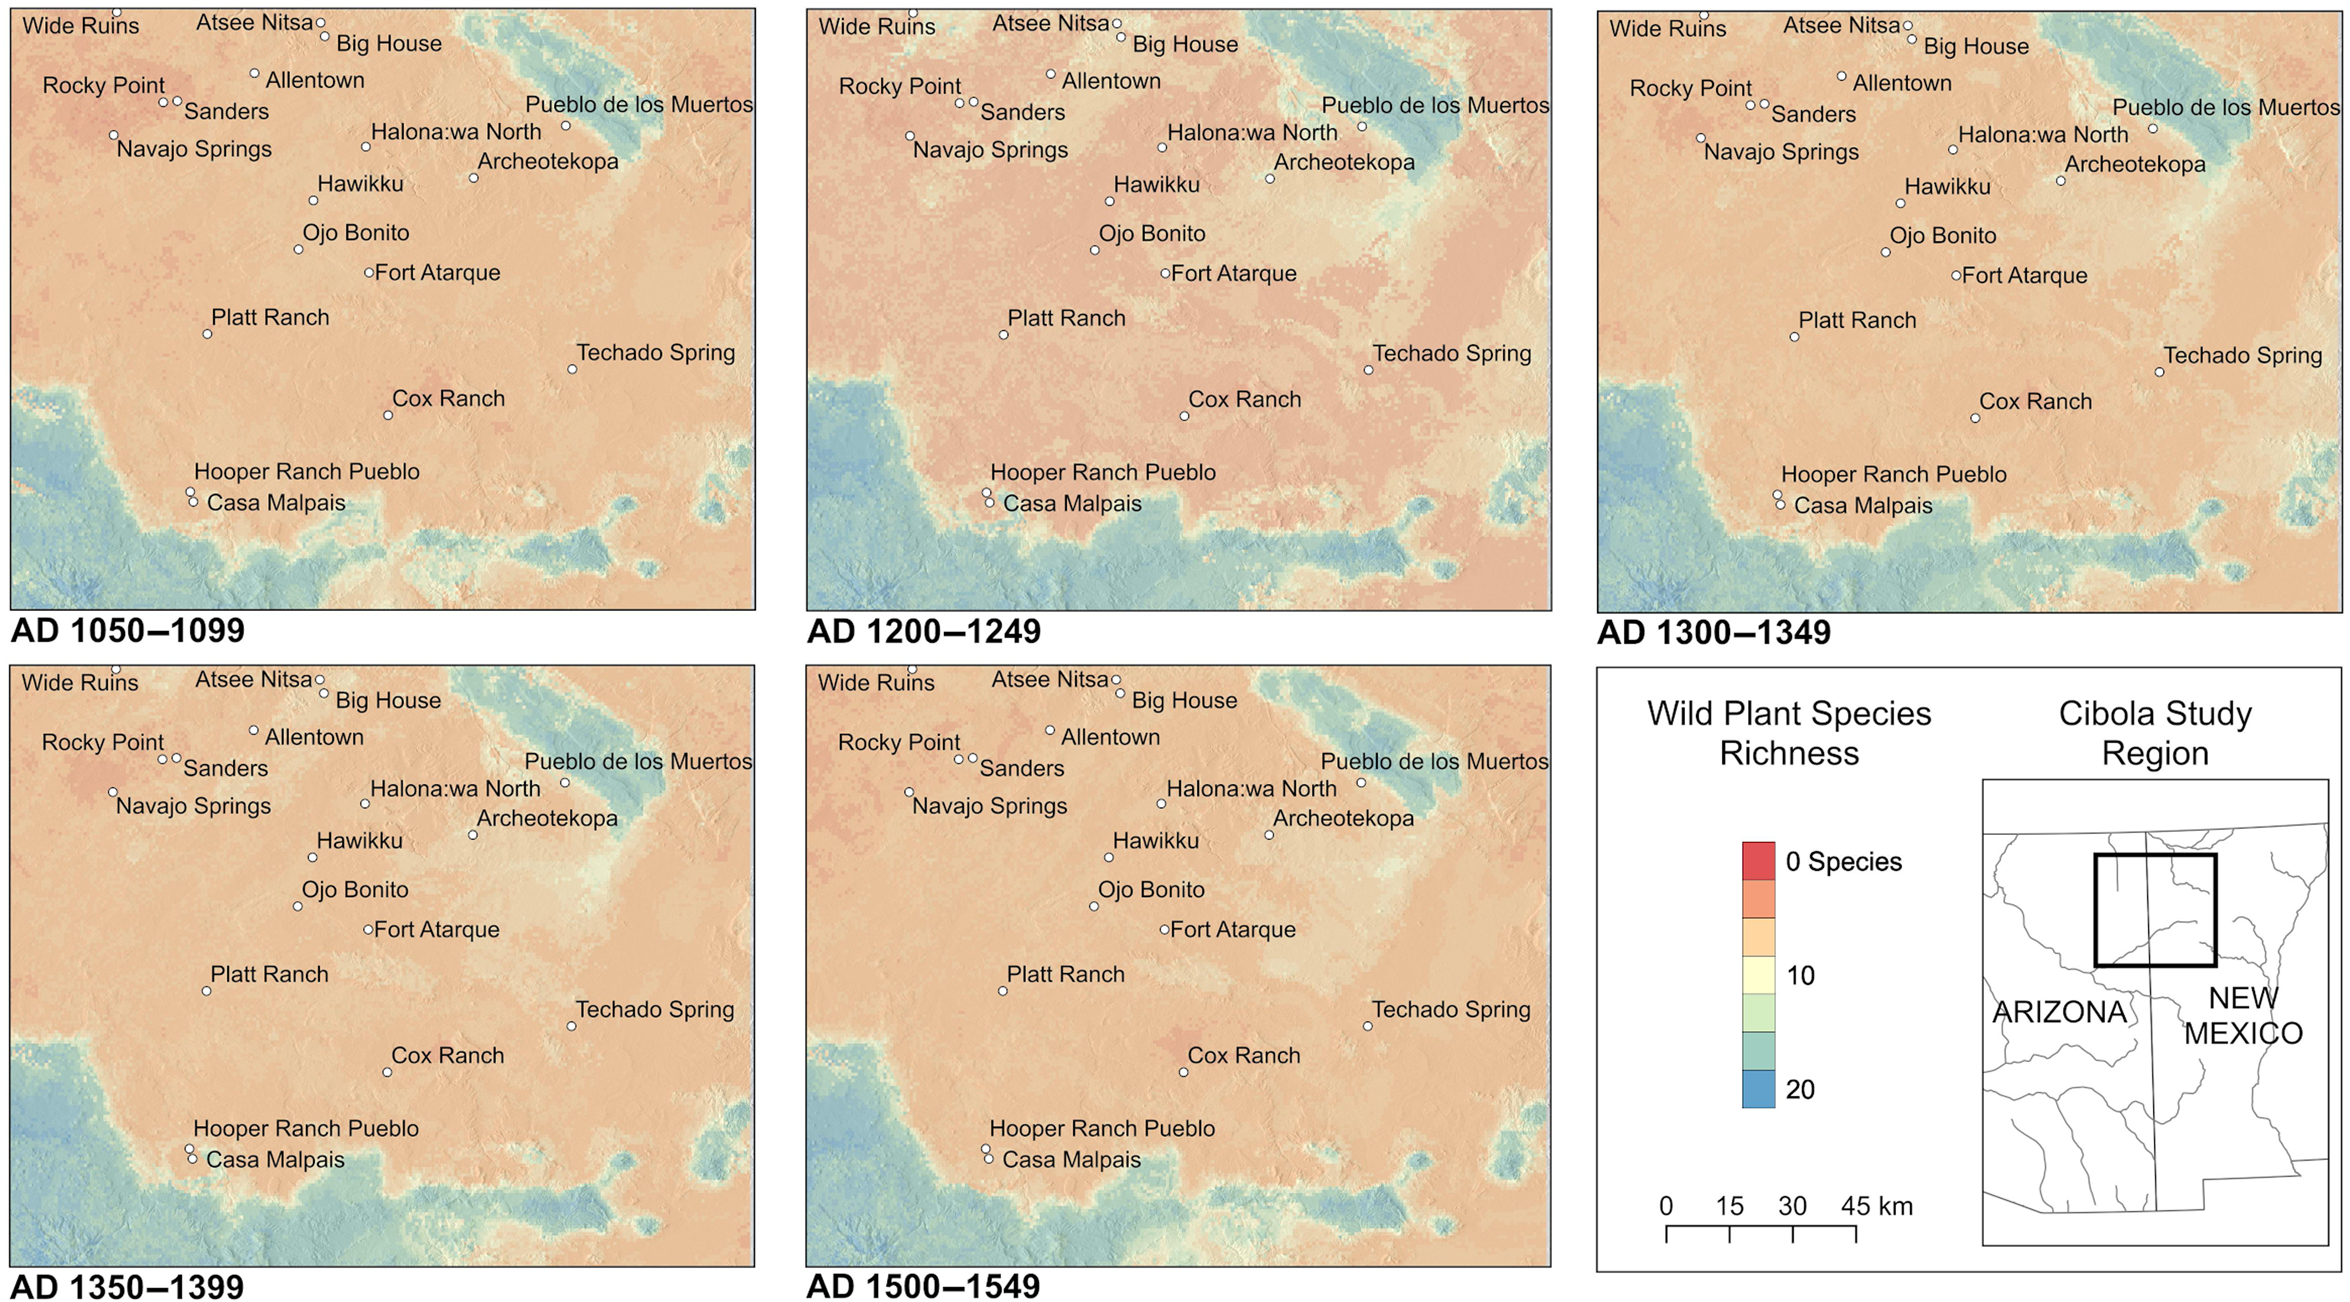
Figure 7. Wild plant diversity in the Cibola region from AD 900 to 1550 for time periods relevant to social transformations of focus.
At the second transition, the occupied area contracted into areas more distant (30–60 km) from the high wild-plant diversity of the Zuni Mountains. From the AD 1300–1349 interval to the AD 1350–1399 interval, the relatively low local wild-resource diversities around most occupied villages remained about the same or decreased slightly and continued at about these same levels until AD 1540. The extreme concentration of population in large towns continued, and the length of village occupation grew from generational to a century or more, working against the utility of using wild plants for food-stress reduction. Together, these factors suggest that during the final protohistoric period from AD 1350 to 1540, staple wild plants would have had less potential impact on reducing food stress than in the previous period.
Anticorrelated Growing-Season Rainfall
In the Cibola region, reciprocal anticorrelation (when one place can help another when needed, and vice versa) was almost completely absent, although at various times, one-way relationships were evident, with some areas able to help others when they were in need (Figures 8, 9d, and 9e). Although no strong and easy-to-interpret patterns in terms of site-to-site anticorrelations are evident, we can glean a few broader trends from the anticorrelation maps. Most areas were positively correlated in the AD 900–1050 and AD 1050–1200 intervals, suggesting that few opportunities existed for food-based exchanges among people at different sites with complementary climatic characteristics—at least at the spatial scale we investigate. After AD 1200, however, we observe greater differences among the sites examined. Specifically, for both the AD 1200–1300 and AD 1300–1400 periods, people at sites in the northern half of the study area (including the Zuni River valley, El Morro Valley, and the Puerco River to the west) could have potentially provided surplus food to those at sites in stressed climate conditions in areas along the southern edge of the Colorado Plateau, in particular Mariana Mesa, the Upper Little Colorado, and along Carrizo Wash. By the AD 1400–1540 interval, the primary patterns of complementary anticorrelation were largely limited to potential connections between people in the Mariana Mesa area (although after AD 1325, Mariana Mesa was not permanently occupied) and those in much of the region to the north on the Colorado Plateau. This north/south division between sites on the Colorado Plateau and sites on the southern edge of the plateau or beyond was the strongest association across all of the sampled sites.
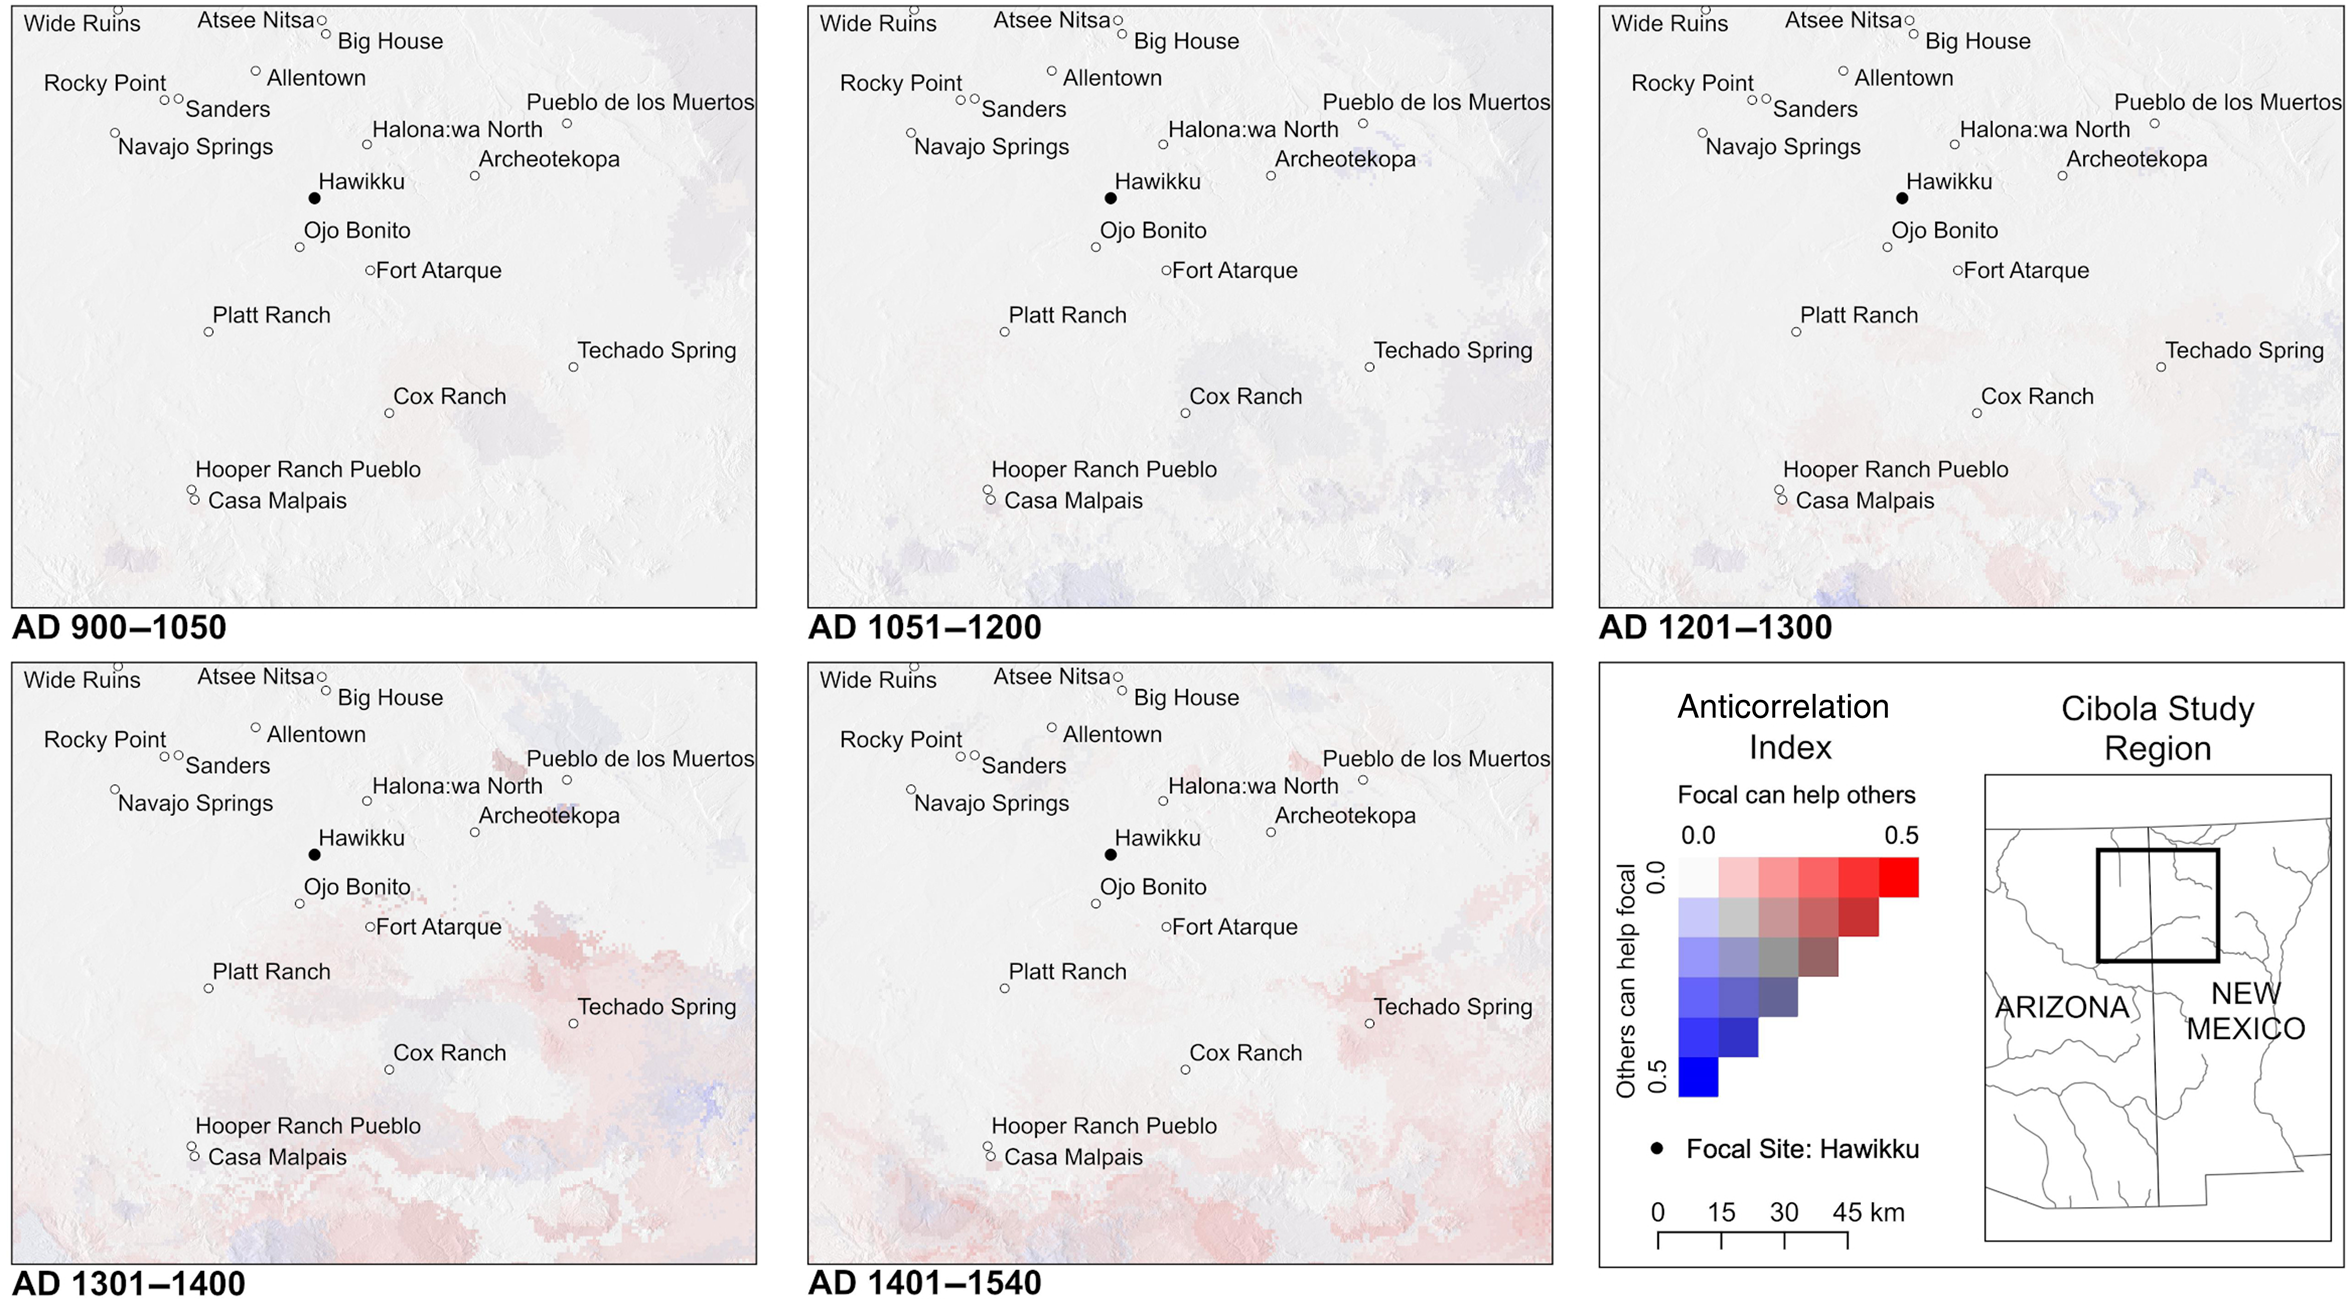
Figure 8. Anticorrelation maps for Hawikku as the focal site in the Cibola region (AD 900–1540).
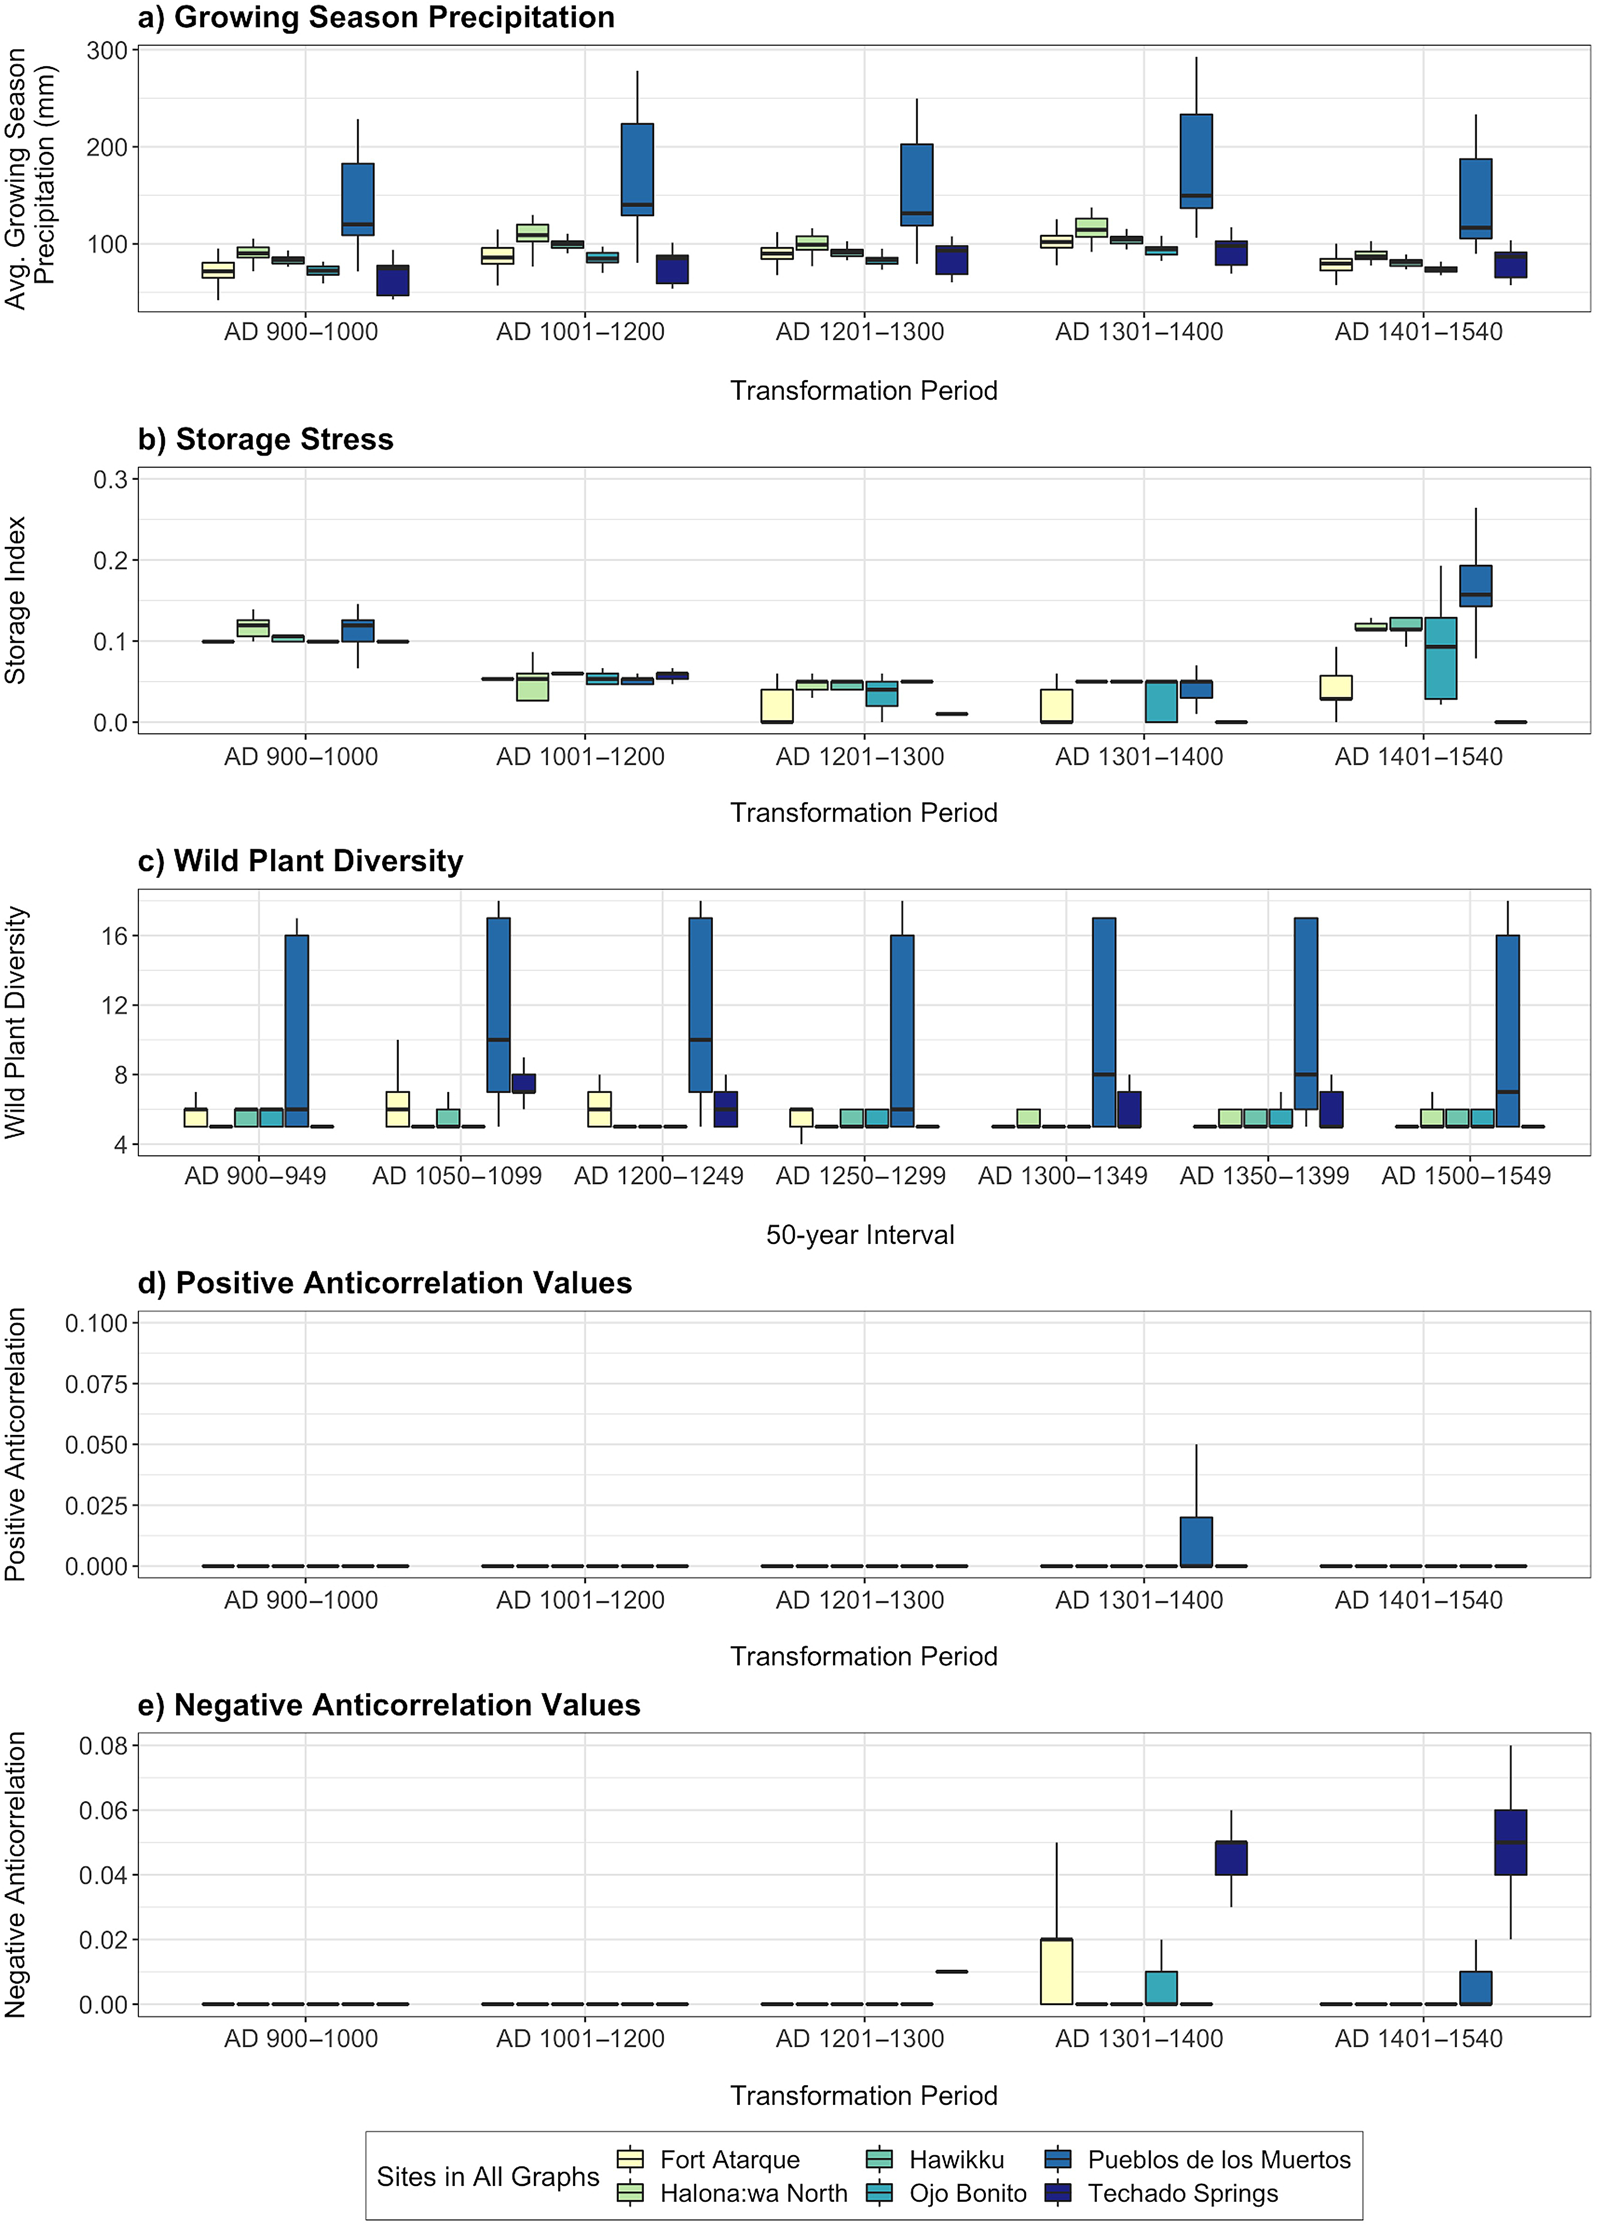
Figure 9. Boxplots visualizing the range of values for selected sites for each of our risk landscape metrics.
The structure of the regional population also changed considerably through the periods considered here. Although a larger area was occupied in the AD 900–1050 and AD 1050–1200 intervals, relative to the AD 1200–1300 interval, people at settlements had access to stronger and more frequent opportunities to interact with those in anticorrelated settlements in the latter period. This observation reinforces the storage deficit picture, indicating that during the AD 1200–1300 interval, people may have had less stress due to fewer storage deficits and more opportunities to address stresses through exchange. This flexibility may well have enabled the dramatic population aggregation that we observe at this transition.
In the case of the later (AD 1350–1400) transformation, all of the occupied towns postdating AD 1375 sat along a 30 km stretch of the Zuni River. The anticorrelation maps for the site of Hawikku (Figures 8, 9d, and 9e) or Halona:wa (not illustrated) show that the areas with anticorrelated precipitation were generally both distant and unoccupied. As a result, deficit-driven interaction would not have been possible within the Cibola region. The nearest potentially valuable interaction for reducing food stress would have been the Hopi Mesas, located 170 km to the northwest, and around Acoma, 120 km to the east. Material culture evidence indicates that there was considerably more interaction with Hopi and other pueblos in the final time period than in any preceding period—a reciprocal relationship that was also documented historically (Cordell and McBrinn Reference Cordell and McBrinn2012:296–297, 299; Cushing Reference Cushing1920:76–78; Ford Reference Ford and Ortiz1972; Talayesya Reference Talayesya1942:52).
Our results suggest that patterns of interaction between people in the northern and southern halves of the study area may have increased after AD 1200 or AD 1300 when those two areas grew increasingly anticorrelated. Peeples (Reference Peeples2018) explores a number of different lines of evidence focused on identifying patterns of interaction across the broader Cibola region (largely on the post-1200 period). He investigates the frequency of interaction through proxies, including shared technological styles for pottery production and domestic architecture, as well as the circulation of painted and unpainted ceramics (Figure 10). These different lines of evidence suggest considerable interaction between people in the northern half of the study area with those in the south between about AD 1200 and 1275. Indeed, Peeples (Reference Peeples2018) documents high volumes of ceramics moving between these regions, in particular between the central Zuni region and areas to the south as well as more gradational patterns of similarity in terms of material culture technology. Counter to our expectations based on the anticorrelation patterns we document, however, as the anticorrelation between the north and south increased (from the AD 1200–1300 to the 1300–1400 period), interaction between regions decreased; they became increasingly local in nature (especially after AD 1275).

Figure 10. Cibola social networks. The northern (gray) and southern (white) shaded areas represent clusters of sites that showed strong similarities in technology for multiple material classes (Peeples Reference Peeples2018). (Color online)
This lack of fit between our anticorrelation analysis and Peeples's interpretations of interactions may suggest that at the scale considered in our study, reciprocal subsistence-based interaction among areas with complementary climate and weather regimes was not a major risk-buffering strategy. Our analysis indicates that, in fact, the climatic patterns did not provide many opportunities for such interactions. However, the asymmetric climatic patterns (enabling people at the sites in the north to provide surpluses to people experiencing food stress at sites in the south, but not vice versa) could have encouraged exchanges of nonagricultural products.
Several earlier studies in other portions of the Southwest (Borck et al. Reference Borck, Mills, Peeples and Clark2015; Cordell et al. Reference Cordell, Van West, Dean and Muenchrath2007; Rautman Reference Rautman1993) found stronger-than-expected interactions between areas experiencing complementary climate conditions. Notably, the patterns of complementarity documented in these past studies were at far greater spatial scales (largely including interactions occurring across 100 km or more). Such distances were likely far beyond the distances that we might reasonably expect people to have moved food in order to deal with resource shortfalls. As a result, these long-distance connections characterized by complementarity may have been more about providing options for migration when the challenges faced were the most extreme (Duff Reference Duff and Spielmann1998).
Comparison of Cibola and Salinas Risk Landscapes
The Cibola case study provides an in-depth example of the utility of the risk landscape approach in evaluating the relationship between climate-driven risk to food shortfall and risk-mediating strategies in the prehispanic U.S. Southwest. From our analysis, it appears that there was a potential link between severe storage stress between AD 1400 and 1540 and a major shift in agricultural technologies in the region at that time. This correlation should be explored further in future studies. Interestingly, however, there is little evidence for a connection between established social networks observed archaeologically, shifting anticorrelations in the risk landscape, and social transformations through time in the Cibola region. Indeed, it appears that interactions observed in the Cibola region may not be related to anticorrelated rainfall at all.
This was not true in the Salinas region, located approximately 250 km to the east of Cibola in central New Mexico. Unlike the Cibola region, Salinas was characterized by times of social, settlement, and economic stability during our period of study from AD 1100 to 1450 (Spielmann et al. Reference Spielmann, Nelson, Ingram and Peeples2011). Social transformations observed in the Salinas region were mostly related to changes in settlement patterns and types, including transitions from pithouses to jacal villages to plaza-oriented pueblos to nucleated large pueblos over the centuries of focus (Chamberlin Reference Chamberlin2008; Spielmann Reference Spielmann and Adler1996). In initial analyses of the Salinas region (Strawhacker et al. Reference Strawhacker, Snitker, Spielmann, Wasiolek, Sandor, Kinzig, Kintigh and Spielmann2017), we solely analyze the relationship among archaeological exchange networks, anticorrelation patterns, and anthropogenic alterations to the landscape. Unlike the Cibola region, we find patterns in established prehispanic social networks that correspond to the anticorrelation landscape structure.
Returning to Figure 4 above, in the later periods of Salinas prehistory (AD 1351–1450), anticorrelations of growing-season rainfall became more pronounced compared to previous time periods. These more pronounced anticorrelations corresponded with evidence for increased trade. Mutual reliance for food assistance between the Manzanos (Quarai and Abo) and Jumanos (Gran Quivira and Pueblo Blanco) pueblos after the mid-1300s would have been reinforced by exchange of plain-ware vessels from villages on the eastern side of the Manzano Mountains (e.g., Quarai; Capone Reference Capone and Spielmann2017) and later glaze-ware ceramics from Abo to the Jumanos pueblos, which grew substantially in the mid-1400s (Mobley-Tanaka Reference Mobeley-Tanaka and Spielmann2017). Bison and salt products from the Jumanos pueblos could have been offered in return. The Salinas case also demonstrates the importance of the local context to fully understand the risk landscape. Whereas the Salinas region presented a clear link between anticorrelated rainfall patterns and archaeologically observed exchange of materials, the Cibola case revealed that storage stress may have been a stronger driver of risk-mediating strategies.
It is possible that this contrast between regions may have been driven by differences in local water availability in each region, allowing for the adoption of alternative risk-buffering strategies. Whereas agricultural communities in the Cibola region could draw more reliable water from a major river, the Salinas region had no meaningful surface water to rely on when rainfall fell short. We have excellent data substantiating landscape modifications around the Jumanos pueblos in the Salinas region that were designed to raise the water table in very localized areas (Strawhacker et al. Reference Strawhacker, Snitker, Spielmann, Wasiolek, Sandor, Kinzig, Kintigh and Spielmann2017)—a strategy that concentrates water to crops in times of insufficient rainfall. These modifications, however, would not have been nearly as productive as agriculture along the Zuni River in the Cibola region. As a result, as the Cibola population concentrated along the Zuni River in the fourteenth century, risk-buffering strategies for rainfed farming became less important with easier access to riverine water sources that could feed fields via small canals. Salinas farmers, however, were forced to continue to rely on rainfed farming, which potentially drove them to rely more heavily on anticorrelated social networks in times of need during the same time periods.
Next Steps and Conclusions
The above analysis represents a significant step toward creating substantive and quantified methods to assess risk for our archaeological case studies at a landscape scale. This method evaluates how prehispanic populations may have invested in risk management strategies based on climate structure and helps explain how these investments would have been stressed in times of climate change. This conceptual framework and methodology provide a risk-based approach that can be applied in many different ways across other archaeological regions (depending on the spatial and temporal resolution of available environmental and archaeological data). From these initial results, the analysis shows that both the Cibola and Salinas regions may have contended with considerable changes in risk landscapes through time, potentially resulting in the need for people to use different risk-mediating strategies. The Cibola region exhibited little evidence for anticorrelated rainfall patterns in concert with archaeologically observed social networks, whereas the Salinas case did indeed show evidence for increasing anticorrelation through time in conjunction with complementary exchange patterns. The differences between the Cibola and Salinas regions show that these regions faced varying risk landscape structures over time.
For the purposes of this analysis, we focus on precipitation-driven risks to food security, but precipitation is not the only climate- or microclimate-related risk factor to successful food production in the U.S. Southwest or in other regions. Other factors that could be incorporated into this kind of analysis include temperature (such as late or early freezes, which could threaten crops, or insufficient growing-degree days), winter rainfall (which is critical for sufficient soil moisture at planting), cold air drainages (which can threaten early growth of crops), anthropogenic alterations to the environment, soil degradation, crop pest and disease problems, or overexploitation of wild resources. The methods demonstrated in this analysis could be applied to many different environmental factors that may present a risk to food production, provided the data exist. Our efforts are a step forward to better understanding climate-driven risk to food production at a landscape scale and the ways in which people may have structured various risk-mediating strategies based on accumulated local knowledge of that established climate structure. When that climate structure changes over time, we can observe how these strategies may have been stressed and/or altered to mediate the risk of agricultural failure through archaeologically observed strategies, including storage, exchange of goods, and changes in agricultural practices. This analysis adds to our understanding of the complex, landscape-scale choices people made in the context of changing climate, and they can inform future hypotheses testing regarding archaeologically observed strategies to avoid food shortfall.
Acknowledgments
We thank the entire Long-Term Vulnerability and Transformation Project (LTVTP) Team for input and patient feedback on the development of this methodology and analysis. Those who participated include Dave Abbott, Marty Anderies, Michelle Hegmon, Wesley Miles, Ben Nelson, Jon Norberg, Paige Owen, Chuck Redman, Will Russell, Karen Schollmeyer, Brenda Shears, Laura Swantek, and Andrea Torvinen. LTVTP was based out of Arizona State University, but it was a multi-institution collaboration, with contributions from Stockholm University, Iowa State University, the Gila River Indian Community, Archaeology Southwest, the University of Northern Arizona, and the University of Georgia. We also express deep gratitude to the anonymous reviewers who provided thoughtful and constructive feedback during the peer review process, resulting in a stronger manuscript for publication. This material is based on work supported by the National Science Foundation under Grant No. 1113991.
Data Availability Statement
All data associated with this article and the Long-Term Vulnerability and Transformation Project (LTVTP) have been archived with the Digital Archaeological Record (tDAR) and are accessible at https://core.tdar.org/collection/14044/long-term-vulnerability-and-transformation-project-ltvtp-documents-and-data. The code used to produce the analysis is open access and cited within the text (Bocinksy et al. Reference Bocinsky, Rush, Kintigh and Kohler2016; Snitker Reference Snitker2019).
Supplemental Materials
For supplemental material accompanying this article, visit https://doi.org/10.1017/aaq.2020.35.
Supplemental Figure 1. All available maps of wild plant diversity in the Cibola region from AD 900 to 1550. Those maps relevant to Cibola Social transformations are displayed in Figure 7.


 Open access