


Excess weight is currently one of the main health concerns worldwide: the prevalence of obesity has increased from 3·2 % among adult men and 6·4 % among adult women in 1975, to 10·8 and 14·9 % in 2014, respectively( 1 ). Moreover, between 1975 and 2016, the prevalence of obesity has increased by fivefold and sevenfold, respectively, in girls and boys aged 5–19 years( 2 ). On the other hand, the prevalence of overweight ranges from 18·9 to 36·9 % in school-aged children (5–11 years) and from 16·6 to 35·8 % in adolescents (12–19 years) in Latin America( Reference Rivera, de Cossio and Pedraza 3 ). In Peru, the prevalence of overweight was 29·4 % among children aged 5–9 years according to a nationally representative sample. This figure was 24·2 % among adolescents( 4 ).
Research has demonstrated that children with overweight have a higher probability of continuing with that condition throughout adolescence and adulthood( Reference Venn, Thomson and Schmidt 5 ), increasing the risk of developing metabolic syndrome, type 2 diabetes mellitus, CVD and mortality( Reference Biro and Wien 6 ). Moreover, several factors have been involved in the development of overweight, including genetic factors( Reference Leonska-Duniec, Ahmetov and Zmijewski 7 ), sociocultural influences( Reference Lopez, Ramirez and Sanchez 8 ), as well as socio-economic background( Reference Preston, Ariana and Penny 9 ). Diet patterns, mainly the consumption of high-energy-dense foods (i.e. unhealthy snacks, junk foods and sweetened beverages), are also involved in the development of overweight( Reference Barbalho, Fontana and Finalli 10 – Reference Wijnhoven, van Raaij and Sjoberg 16 ). Snacks and sweetened beverages are an important target in the prevention of overweight as they are modifiable components of diet( Reference Singh, Micha and Khatibzadeh 17 ). Nevertheless, the magnitude at which the consumption of snacks and sweetened beverages leads to obesity has to be better characterized in countries where their consumption is on the rise.
According to the FAO, snacks are ‘foods that are eaten between main meals and have a tendency to have a lower nutritional value’( Reference Fellows and Hilmi 18 ). Snacks are available in different presentations such as fruits, vegetables and nuts, but there are also snacks with high energy content (i.e. soft drinks, sweets and junk foods). Thus, the present study aimed to determine the association between the consumption of unhealthy foods, mainly snacks and sweetened beverages (i.e. soft drinks), and the prevalence and incidence of overweight in Peru, a middle-income country undergoing the nutrition transition. For this, data from the Young Lives cohort study were analysed.
Methods
Study design
The present study is a secondary analysis using data of the younger cohort of children enrolled in the Young Lives study( Reference Barnett, Ariana and Petrou 19 ) which is conducted in four developing countries: Ethiopia, India, Peru and Vietnam. The Young Lives study started in 2002 and continues to date; it comprises questionnaires on nutrition and health and includes anthropometric measurements. Details of the study have been published previously( Reference Barnett, Ariana and Petrou 19 ) and the data are freely available online (http://www.younglives.org.uk).
Study population
The Young Lives study includes two longitudinal prospective cohorts, a younger and an older one. At baseline, in the year 2002, the younger cohort included children aged 6 to 18 months old, whereas the older cohort included children aged between 7 and 8 years old. For the present paper, we utilized data from the third (2009) and the fourth round (2013) of the younger cohort in Peru. Data of children aged 7–8 years in the third round were considered our baseline (attrition rate was 1·1 %( Reference Barnett, Ariana and Petrou 19 )), whereas information from the fourth round was also included for the follow-up outcomes. Participants with incomplete data in the variables of interest (i.e. overweight/obesity, snacks and sweetened beverages) were excluded from the analysis.
Sampling and procedures
The sampling approach for the Peruvian cohort has been broadly explained elsewhere( 20 ). Briefly, a sentinel site sampling approach was followed using a multistage, cluster-stratified, random sampling technique. The initial sample frame at the district level was used to choose twenty sentinel sites from a total of 1818 districts available. The top 5 % richest districts were excluded because the aim was to oversample poor areas. Once the districts were selected, maps of census tracts were used to randomly choose one census tract in each district using a random number table. Blocks of houses and sets of houses were selected per district. Finally, all households in any given block or set of houses were visited to identify one household with at least one child for the study purposes. Blocks of houses or sets of houses were approached until the total eligible households were found. For data collection, three teams, comprising fieldworkers, a data-entry clerk and supervisors, were responsible for six or seven sentinel sites.
Study variables
Outcome
The outcome of interest was child overweight, based on BMI. The International Obesity Task Force’s sex- and age-specific BMI cut-off points for children were used for analysis( Reference Cole and Lobstein 21 ). We decided to use the International Obesity Task Force criteria because they give more conservative estimates of overweight compared with other international definitions( Reference Gonzalez-Casanova, Sarmiento and Gazmararian 22 ). In addition, weight (in kilograms) and circumference abdominal (in centimetres) were also outcomes of interest but considered as numerical variables.
Exposures
Exposures were consumption of snacks and consumption of sweetened beverages, which were assessed using the following questions: ‘During the last 30 d, did the child (name) eat salty and fatty foods, such as crisps or fried snacks?’ and ‘During the last 30 d, did the child (name) drink fizzy, sweet soft drinks such as sodas?’ Responses were given by the child’s mother with six options, including: ‘never’, ‘less than every 2 weeks’, ‘every 2 weeks’, ‘once a week’, ‘2–6 times a week’ and ‘daily’. For analysis purposes, the responses were categorized as never (reference), up to every 2 weeks, 2–6 times per week and daily.
Covariates
Other variables, assessed at baseline, also included in the analyses as potential confounders were: age (7 v. 8 years), sex (male v. female), socio-economic status (based on a wealth index built using household assets and facilities, and split in tertiles) and physical activity (assessed by report of the child’s mother of at least 60 min of physical activity on none, 1–3, 4–6 and 7 d per week). In addition, mother’s overweight status (<25 v. ≥25 kg/m2) was also included.
Statistical analysis
The statistical software package STATA version 13 for Windows was used for analysis. Initially, characteristics of the study population according to snack and sweetened beverage consumption were tabulated. Then, change in weight, BMI and waist circumference were determined by the difference between estimates at follow-up (round 4) and baseline (round 3) using linear regression models. In addition, multivariable linear regression models were built to assess the association of interest with numerical outcomes.
Further, the incidence of overweight as per BMI, using the child age- and sex-specific cut-off points proposed by the International Obesity Task Force( Reference Cole and Lobstein 21 ), was estimated after excluding cases of overweight at baseline and reported per 100 person-years of follow-up. Finally, Poisson regression models, with link log and robust standard errors, were used to estimate the strength of the association between exposure and outcomes, reporting relative risks (RR) and 95 % CI.
Ethics
The Young Lives study was originally approved by the Ethics Committee Social Science Division, University of Oxford, UK, in the year 2006. In Peru, the approval was granted by the Research Ethics Committee at the Instituto de Investigacion Nutricional in Lima. To conduct the current secondary analysis, ethical approval was obtained from the Ethical Committee at the Universidad Peruana de Ciencias Aplicadas (UPC), in Lima, Peru.
Results
Population characteristics at baseline
In total 1942 children were assessed in the third round (Fig. 1); of them, 129 were excluded because of incomplete information on the variables of interest, and as a result data from 1813 children were analysed, mean age 8·0 (sd 0·3) years and 49·2 % were girls.
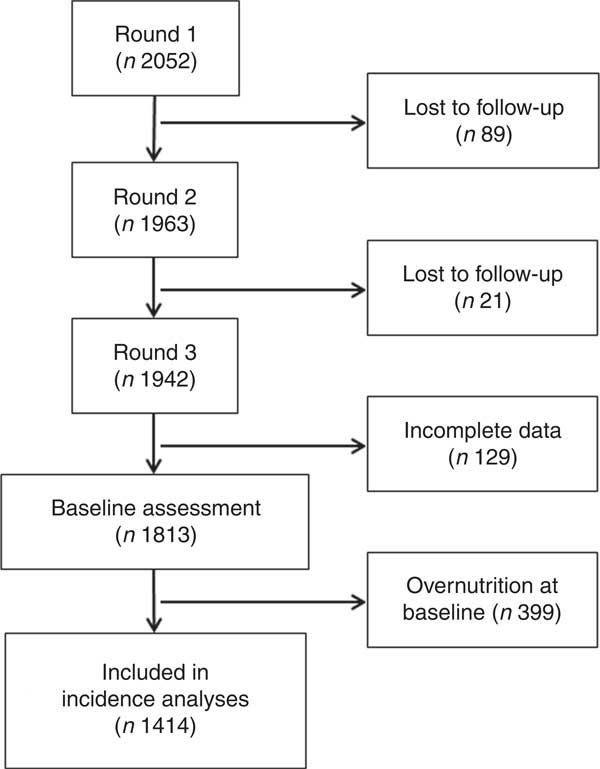
Fig. 1 Flowchart of participants in the Young Lives study. Round 3 of the Young Lives study was considered baseline in the current analysis
A total of 12·9 (95 % CI 11·3, 14·5) % reported never having consumed sweetened beverages, whereas 3·3 (95 % CI 2·5, 4·2) % reported consuming them daily. Similarly, corresponding values were 20·0 (95 % CI 18·2, 21·9) % and 3·9 (95 % CI 3·1, 4·9) % for snack consumption. Overweight was present in 22·0 (95 % CI 20·1, 23·9) % of children. Information on the study population characteristics by sweetened beverage and snack consumption is detailed in Table 1.
Table 1 Baseline description of the study population by exposure (sweetened beverage and snack consumption): children from the younger cohort of the Young Lives cohort study in Peru, who participated in the third (2009; considered baseline in the current analysis) and the fourth (2013; follow-up) rounds
Results may not add due to missing values.
Change in BMI, weight and waist circumference over time
Overall, the mean weight of the population increased by 15·9 (sd 6·1) kg during the 4 years of follow-up. Similarly, the mean BMI increased by 2·7 (sd 2·2) kg/m2, whereas the mean waist circumference rose by 8·6 (sd 6·5) cm. In multivariable models, children reporting daily consumption of sweetened beverages had a higher weight increase than those who never consumed them (2·29 kg; 95 % CI 0·62, 3·96 kg). Similarly, there was a higher weight gain (2·04 kg; 95 % CI 0·48, 3·60 kg) among those consuming snacks daily (Table 2). The same trend was also observable when BMI was the outcome. However, changes in waist circumference were not significant for sweetened beverages (1·43 cm; 95 % CI −0·41, 3·27 cm) or snacks (0·85 cm; 95 % CI −0·89, 2·60 cm).
Table 2 Change in weight, BMI and waist circumference during follow-up by exposure (sweetened beverage and snack consumption) among children from the younger cohort of the Young Lives cohort study in Peru, who participated in the third (2009; considered baseline in the current analysis) and the fourth (2013; follow-up) rounds
Significant (P<0·05) estimates are presented in bold.
* All categories were compared with those who ‘never’ consumed sweetened beverages/snacks.
† Model adjusted for sex, age, socio-economic status, physical activity and mother’s BMI at baseline.
Overweight risk with sweetened beverage and snack consumption
For the incidence analysis, 399 children were excluded as they were overweight at baseline. Thus, 1414 children were included for these estimations. Mean time of follow-up was 4·0 (sd 0·1) years, completing 5523·1 person-years of follow-up. A total of 197 new cases of overweight were found with an overall incidence of 3·57 (95 % CI 3·10, 4·10) per 100 person-years.
Although there was a clear trend of rising incidence of overweight associated with increased consumption of sweetened beverages (P<0·001) and snacks (P=0·003), in multivariable models, only daily sweetened beverage consumption was associated with higher risk of becoming overweight (RR=2·12; 95 % CI 1·05, 4·28). Details of the regression models are shown in Table 3.
Table 3 Association of sweetened beverage and snack consumption with overweight (incidence, crude and adjusted models) among children from the younger cohort of the Young Lives cohort study in Peru, who participated in the third (2009; considered baseline in the current analysis) and the fourth (2013; follow-up) rounds
RR, relative risk.
Significant (P<0·05) estimates are presented in bold.
* Model adjusted for sex, age, socio-economic status, physical activity and mother’s BMI at baseline.
Discussion
Main findings
Our results revealed that in resource-limited settings in Peru, four in 100 children per year developed overweight. Moreover, daily consumption of sweetened beverages, compared with never consuming them, doubled the risk of developing overweight. These results emphasize the relevance of working to restrict consumption of sweetened beverages, particularly for children.
Comparison with previous studies
Previous studies have reported the association between sweetened beverage as well as snack consumption and developing overweight among children( Reference Baygi, Qorbani and Dorosty 11 – Reference Wijnhoven, van Raaij and Sjoberg 16 ). Previous prospective studies have reported that soft drinks and snacks can increase fat mass in children( Reference Smith, Emmett and Newby 23 ), the risk of metabolic syndrome and high blood pressure levels( Reference Payab, Kelishadi and Qorbani 13 , Reference Asghari, Yuzbashian and Mirmiran 24 ), and CVD( Reference Barbalho, Fontana and Finalli 10 ). Our results confirm the deleterious effect of unhealthy foods, mainly sweetened beverages, on children’s health; but also add evidence from resource-constrained settings undergoing the nutrition transition.
Possible mechanisms to explain these associations have been pointed out by previous clinical studies. A clinical trial assessing the impact of sweetened beverages on adults’ health( Reference Maersk, Belza and Stodkilde-Jorgensen 25 ) found that the daily intake of sweetened drinks increased ectopic fat and lipid accumulation compared with milk or water, enhancing the risk of cardiovascular and metabolic diseases. This process was mainly associated with fructose, which can enhance de novo lipogenesis, TAG production and fat accumulation in the liver( Reference Ferder, Ferder and Inserra 26 ).
It is most likely that parents decide what the young household members eat, meaning that children may not independently decide what to eat( Reference Hassan, El-Masry and Farid 27 , Reference Parrino, Vinciguerra and La Spina 28 ). This is important because our findings show that 65 % of mothers were overweight. A recent systematic review found that both healthy and unhealthy parental behaviours are strongly correlated with child food consumption behaviour( Reference Yee, Lwin and Ho 29 ). Then, addressing parents’ behaviours could indirectly positively impact their children as well.
Public health relevance
The rise of overweight among children has become an important public health problem( 2 ). Moreover, of the 184 000 deaths per year due to sweetened beverage consumption worldwide, 75·9 % occur in low- and middle-income countries( Reference Singh, Micha and Khatibzadeh 17 ), and Latin America and the Caribbean have the highest absolute mortality related to sweetened beverages.
Snack and sweetened beverage consumption are modifiable components of diet. Although overweight prevalence among children in Peru is low compared with other Latin American countries, our results indicate incidence rates comparable to those observed in adults( Reference Carrillo-Larco, Bernabe-Ortiz and Pillay 30 ). This suggests that if risk factors, including consumption of sweetened beverages, are not reduced, then the prevalence of childhood obesity may reach that of other countries in the region. Moreover, it has been described that the typical Peruvian diet is high in carbohydrates and low in fruits and vegetables( Reference Bermudez and Tucker 31 ). As it could be harder to change inherited characteristics of the Peruvian diet, we would strongly suggest dedicating efforts to tackle relatively new risk factors such as high snack and soda consumption.
The high correlation between parental behaviour and child food consumption may be used to implement appropriate interventions. For example, a study conducted in Peru demonstrated that an integral programme promoting healthy behaviours among parents (lectures on energy balance and healthy snacking), nutritional counselling to food providers in school and promoting physical activity contributed to the reduction of BMI in children( Reference Perez Villasante, Raigada Mares and Collins Estrada 32 ).
From the policy and legal perspective, taxation can be a good strategy to tackle overweight. An increment of taxes on soda has shown a significant reduction of obesity, BMI and type 2 diabetes mellitus, especially in areas with greater prevalence of obesity and in resource-constrained settings( Reference Fletcher, Frisvold and Tefft 33 – Reference Veerman, Sacks and Antonopoulos 37 ). Thus, our study supports the need for addressing the problem of overweight, especially among children and adolescents, from different perspectives.
Strengths and limitations
Strengths of the present study include the use of data from a prospective ongoing study, reducing the risk of reverse causality. In addition, a low proportion of individuals were lost to follow-up; thus, the impact of the attrition rate can be considered negligible( Reference Barnett, Ariana and Petrou 19 ). However, the study has several limitations. First, our exposures were based on self-report data reported by a third person (i.e. child’s mother) and as a result, the exact frequency of sweetened beverage and snack intake could not be obtained. In addition, recall and desirability bias can be an issue when trying to remember food consumption. If so, the consumption could have been even higher, making our results conservative of a possible stronger effect. Second, the question used to assess sweetened beverage consumption was not specific to sodas, but potentially also included diet sodas, sports drinks, etc. However, artificially sweetened beverages have also been linked to increased adiposity, type 2 diabetes mellitus and other detrimental health effects( Reference Imamura, O’Connor and Ye 38 , Reference Ruanpeng, Thongprayoon and Cheungpasitporn 39 ). Third, we assumed that information about snack and sweetened beverage consumption in the 30 d prior to the survey is indicative of long-term consumption. Finally, other variables, potential confounders in our association of interest, were not available for the analysis, such as parents’ educational level, fruit and vegetable intake, among others.
Conclusions
The daily consumption of sweetened beverages and snacks was associated with increased weight and overweight among children. Our results suggest that interventions to reduce the consumption of these products are needed to tackle the obesity epidemic in Peru and other similar countries.
Acknowledgements
Financial support: A.B.-O. is supported by a Wellcome Trust Research Training Fellowship in Public Health and Tropical Medicine (grant number 103994/Z/14/Z). The funders had no role in study design, data collection, data analysis, decision to publish or preparation of the manuscript. Conflict of interest: The authors declare that no competing interests exist. Authorship: C.A.-O. and D.E.-T. drafted the first version of the manuscript. R.M.C.-L. and A.B.-O. performed statistical analyses. All the authors contributed to the revising of the manuscript for important content and gave their final approval of the version submitted for publication. Ethics of human subject participation: The Young Lives study was originally approved by the Ethics Committee Social Science Division, University of Oxford (UK) in 2006; approval in Peru was granted by the Research Ethics Committee at the Instituto de Investigacion Nutricional (Lima). Ethical approval to conduct the current secondary analysis was obtained from the Ethical Committee at the Universidad Peruana de Ciencias Aplicadas (UPC; Lima, Peru).


 Open access