


Arginine (Arg) is not only an essential amino acid in all fish species studied so far( 1 ) but also a functional amino acid as reported in many studies on Arg nutrition of fish( Reference Cheng, Buentello and Gatlin 2 – Reference Zhou, Jin and Elmada 5 ). Dietary Arg requirements have been established for many commercial fish species, such as channel catfish (Ictalurus punctatus, 3·3–3·8 %)( Reference Buentello and Gatlin 6 ), flounder (Paralichthys olivaceus, 4·08 %)( Reference Alam, Teshima and Koshio 7 ), orange-spotted grouper (Epinephelus coioides, 2·7 %)( Reference Luo, Liu and Mai 8 ), hybrid catfish (Clarias gariepinus×Clarias macrocephalus, 4·45 %–5·0 %)( Reference Singh and Khan 9 ), black sea bream (Sparus macrocephalus, 7·74 %)( Reference Zhou, Xiong and Xiao 10 ), yellow grouper (Epinephelus awoara, 6·5 %)( Reference Zhou, Zeng and Wang 11 ), cobia (Rachycentron canadum, 5·57 %)( Reference Ren, Ai and Mai 12 ), tilapia (Oreochromis niloticus, 6·24 %)( Reference Yue, Zou and Zhu 13 ) and blunt snout bream (Megalobrama amblycephala, 7·23 %)( Reference Ren, Liao and Xie 14 ). The studies mentioned above have shown that Arg requirements vary greatly among species. Thus, for formulating feeds of fish with no information about their Arg requirements, it is not feasible to use the value of dietary Arg requirement obtained from other fish species even if they are from the same family.
Dietary Arg can affect protein deposition and expression of growth-related genes in fish( Reference Tu, Xie and Han 15 , Reference Liang, Ren and Habte-Tsion 16 ) and hence regulates fish growth, because protein deposition is closely related to fish growth response( Reference Anthony, Reiter and Anthony 17 ). Protein deposition mainly depends on the balance between protein synthesis and degradation, and thus factors regulating protein synthesis or protein degradation can also affect protein deposition. For protein synthesis, one of its limiting steps is translation initiation regulated by the signalling pathway of target of rapamycin (TOR) in which eIF4E-binding protein (4E-BP) and ribosomal protein S6 kinase (S6k) are the important regulatory factors( Reference Holz, Ballif and Gygi 18 ). Previous studies have shown that dietary Arg supplementation stimulated the mTOR signalling pathway and protein synthesis in pig porcine trophectoderm cells( Reference Kong, Bie Tan and Yin 19 ) and rotavirus enteritis( Reference Corl, Odle and Niu 20 ), and for fish similar results were also observed in Jian carp (Cyprinus carpio var. Jian)( Reference Chen, Feng and Kuang 21 , Reference Chen, Jin and Zhou 22 ) and Gibel carp (Carassis auratus gibelio)( Reference Tu, Xie and Han 15 ).
Insulin-like growth factor (IGF), a major downstream target of growth hormone (GH), plays an important role in regulating growth and body size of animals( Reference Efstratiadis 23 , Reference Nakae, Kido and Accili 24 ). It has been shown that Arg raised the release of GH and IGF-1 into the blood( Reference Newsholme, Brennnan and Rubi 25 ) and increased muscle gain( Reference Tan, Yin and Liu 26 ) of animals. Arg also has an insulinotropic potential. In rainbow trout( Reference Plisetskaya, Buchelli-Narvaez and Hardy 27 , Reference Mommsen, Moon and Plisetskaya 28 ) and barfin flounder( Reference Andoh 29 ), it was observed that plasma insulin levels increased after Arg administration by intramuscular injection, intraperitoneal injection or dietary supplementation.
Besides the functions on fish growth performance, Arg also has an important role in the development of the gut and innate immune system of fish. Dietary Arg can improve protein digestion in the gastrointestinal tract( Reference Uni and Ferket 30 ) and stimulate intestinal cell migration and ex vivo intestinal protein synthesis( Reference Corl, Odle and Niu 20 , Reference Rhoads, Chen and Gookin 31 ). The roles of Arg in the immune system have been shown in many animals( Reference Pohlenz, Buentello and Mwangi 4 , Reference Zhou, Jin and Elmada 5 ). Arg increases macrophage and natural killer cell cytotoxicity, increases the synthesis of IL-2 and CD3 expression in T cells( Reference Li, Yin and Li 32 , Reference Choi, Martinez-Falero and Corset 33 ) and modulates lymphocyte subsets and positively affects their adhesion molecules, chemotaxis and proliferation( Reference Choi, Martinez-Falero and Corset 33 – Reference Abdukalykova and Ruiz-Feria 35 ); it also increases cell-mediated immunity and antibody titres in poultry after vaccination( Reference Tayade, Jaiswal and Mishra 36 – Reference Ruiz-Feria and Abdukalykova 38 ). However, as with all nutrients there is, in each species an optimal intake of Arg and excessive Arg supplementations to diets can depress the growth performance and immune response in fish( Reference Zhou, Jin and Elmada 5 , Reference Ren, Liao and Xie 14 ).
Hybrid grouper (Epinephelus fuscoguttatus♀×Epinephelus lanceolatus♂) is one of the important intensively farmed marine fish species because of its high commercial value. The optimal protein and lipid requirements, protein:energy ratio and the reference dietary amino acid (AA) profile of hybrid grouper have been established in our previous studies( Reference Jiang, Wu and Li 39 – Reference Wu, Lu and Wu 41 ). However, until now, information on Arg nutrition in hybrid grouper is still unavailable. Thus, the aim of this study was to evaluate effects of dietary Arg levels on growth, intestine morphology, oxidation resistance and immunity of hybrid grouper juveniles, and to use this information to determine the optimal dietary Arg requirement of this fish species.
Methods
Experimental diets
Seven isoenergetic (1465 kJ (350 kcal)/100 g DM), isoproteic (53·5 % of DM) and isolipidic (7 % of DM) experimental diets were formulated to contain graded l-Arg levels ranging from 1·9 to 4·7 % (of DM) at approximately 0·5 % increments (Table 1). On the basis of the results from our previous studies( Reference Jiang, Wu and Li 39 – Reference Wu, Lu and Wu 41 ), 53·5 % dietary crude protein level and 7 % dietary crude lipid level were selected, and the anchovy fishmeal AA profile was used as the reference for experimental diets. Gross energy levels of experimental diets were calculated using physiological fuel values described in published studies( Reference Lee and Putnam 43 , Reference Garling and Wilson 44 ). A mixture of crystalline AA was supplemented to simulate the fishmeal AA pattern of anchovy, leaving Arg out. A mixture containing equal proportions of aspartic acid and glutamate (1:1) was used to substitute for Arg in the low-Arg diets. These AA were used for the substitution because they are non-essential to groupers and are abundant in the anchovy AA profile. Targeted dietary Arg concentrations were 1·9, 2·2, 2·7, 3·1, 3·8, 4·1 and 4·7 % of DM, respectively (Table 2).
Table 1 Formulations and analysed composition of experimental diets (DM basis)
* Yongsheng Feed Corporation; proximate composition (% DM): moisture, 8·9; crude protein, 70·0; crude lipid, 8·7.
† High Fortune (Fujian) Bio-Tech Co. Ltd.
‡ Vitamin mixture (mg/g mixture): thiamine hydrochloride, 2·5; riboflavin, 10; calcium pantothenate, 25; nicotinic acid, 37·5; pyridoxine hydrochloride, 2·5; folic acid, 0·75; inositol, 100; ascorbic acid, 50; choline chloride, 250; menadione, 2; α-tocopheryl acetate, 20; retinol acetate, 1; cholecalciferol, 0·0025; biotin, 0·25; vitamin B12, 0·05. All ingredients were diluted with α-cellulose to 1 g( Reference Lin and Shiau 42 ).
§ Mineral mixture (mg/g mixture): calcium lactate, 327; K2PO4, 239·8; CaHPO4.2H2O, 135·8; MgSO4.7H2O, 132; Na2HPO4.2H2O, 87·2; NaCl, 43·5; ferric citrate, 29·7; ZnSO4.7H2O, 3; CoCl2.6H2O, 1; MnSO4.H2O, 0·8; KI, 0·15; AlCl3.6H2O, 0·15; CuCl2, 0·1( Reference Lin and Shiau 42 ).
|| Amino acid mixture (g/100 g): l-lysine, 1·57; l-methionine, 0·53; l-threonine, 0·89; l-isoleucine, 0·93; l-leucine, 1·64; l-phenylalanine, 0·53; l-valine, 0·70; l-histidine, 0·38; l-aspartic acid, 1·41; l-serine, 0·59; l-glutamic acid, 2·71; glycine, 1·61; l-alanine, 1·59; l-cystine, 0·35; l-tyrosine, 0·21; l-proline, 0·11.
¶ Values represent means of duplicate samples.
Table 2 Amino acid (AA) compositions (%) of experimental diets (DM basis)Footnote *
* Values represent means of duplicate samples.
All dry ingredients were carefully weighed and mixed in a Hobart mixer (A-200T Mixer Bench Model unit; Resell Food Equipment Ltd) for 30 min, followed by gradual addition of the lipids during constant mixing.. Subsequently, 30–50 ml of water/100 g of DM was slowly blended into the premixed ingredients. The diets were produced in a noodle-like shape of 3 mm in diameter using a twin-screw meat grinder (Institute of Chemical Engineering, South China University of Technology) and then pelleted. All diets were air-dried at about 21°C for 24 h, sieved and then packaged and stored frozen (−20°C).
Experimental procedure
Hybrid grouper juveniles were obtained from a commercial hatchery (Wenchang, Hainan, China). Before the trial, experimental fish were acclimated with a commercial diet for 15 d, and then groups of sixteen fish (average initial body weight: 11·7 (sd 0·1) g) were randomly distributed into twenty-one 135-litre aquariums (length 60 cm×width 45 cm×height 50 cm) connected to mechanical and biological water filters as a recycling system. Each diet was randomly assigned to three replicate groups of fish. All aquaria received flowing sea water (salinity: 33·1 g/l) from the same reservoir at a rate of 3 litres/min. Throughout the trial, dissolved O2 content in the fish tanks was measured every other day with a portable metre (HATCH HQ30d; Hatch Lange GMBH) and values ranged from 5·8 to 6·4 mg/l. Ammonia (0–0·19 mg/l) was measured with a portable spectrophotometer (HATCH DR 2800; Hatch Lange GMBH). Water temperature was daily registered using maximum–minimum thermometers and maintained at 27–28°C. Fish were exposed to a 12 h light–12 h dark cycle and fed each dietary treatment twice daily (08.00 and 16.00 hours) to apparent satiation. Feed intake was recorded daily and experimental aquaria were cleaned once a week. The growth trial was continued for 8 weeks.
Sampling and analysis
At the beginning of this trial, ten fish were sampled and stored at −20°C for analysis of initial whole-body proximate composition. At the end of the trial, the fish were euthanised with MS-222 (0·1 g/l), and two fish per aquarium were collected for whole-body composition analysis. For the biochemical analysis of serum, another three fish from each aquarium were separately bled from the caudal vasculature using 1-ml heparinised (H6279; SIGMA) syringes, and then liver and head kidney samples were collected and immediately frozen in liquid N2 and then stored at −80°C. After centrifugation (3000 g , 15 min, 4°C) (centrifuge 5417 R; Eppendorf), serum was separated and stored at −80°C until analysis. The muscle samples for compositional analysis and molecular analyses, as well as intestine samples for histological analysis, were also taken at this dissection.
Crude protein (N×6·25) was determined by the Kjeldahl method after acid digestion using an auto Kjeldahl System (FOSS Tecator). Crude lipid was determined by diethyl ether extraction using a Soxtec System HT (Soxtec System HT6, SOX406; Haineng). DM was determined by heating approximately 2-g samples at 125°C for 3 h, and ash was quantified after heating approximately 2-g samples at 650°C for 3 h according to Association of Official Analytical Chemists( 45 ). The AA levels of the diets, muscle and serum were determined after acid hydrolysis using the L-8900 AA analyzer (Hitachi)( Reference Unnikrishnan and Paulraj 46 ).
Histological examination of the mid gut
For histological analysis, all gut specimens were washed in saline solution and fixed in 10 % neutral-buffered formalin for 24 h. After serial dehydration steps in alcohol, samples were embedded in paraffin. The blocks of embedded tissue were sectioned at 5 mm, and sections were routinely stained with haematoxylin–eosin and observed under a light microscope (Olympus). Average villus heights, enterocyte height, muscular layer thickness and serosal thickness were determined per slice by computer-operated image picture analysis system (Image-Pro Plus 7), with a digital camera attached to a light microscope. Six measurements of each parameter were made in each section (three fish per tank). In all, fifty-four measurements per treatment were used to calculate the average values.
Oxidative stress challenge test
After sampling, all remaining fish were fed their prescribed diets for 2 d and then exposed to 4·5 mg Cu(II)/l water for 36 h by the addition of CuSO4 to water. The dose of Cu(II) exposure used in this study was found to induce oxidative stress in a preliminary experiment. During the challenge test, the water recirculation of the aquarium system was stopped by turning off the pump. The survival rate per aquarium was recorded, and then three fish per aquarium were randomly selected and individually sampled as above to obtain serum, liver and head kidney.
Total RNA extraction and reverse transcription
Total RNA was extracted from grouper liver and head kidney using Trizol Reagent (Invitrogen) followed by quality measurement on a 1·0 % denaturing agarose gel and yield determination on a NanoDrop® ND-1000. The RNA was treated with RNA-Free DNase (Takara) to remove DNA contamination and reversely transcribed to complementary DNA (cDNA) by the RevertAid First Stand cDNA Synthesis kit (Thermo Scientific) according to the instructions provided by the manufacturer.
Real-time quantitative PCR analysis of insulin-like growth factor-I, target of rapamycin, S6 kinase 1 and eIF4E-binding protein in liver, and NF-E2-related factor 2, Kelch-like-ECH associated protein 1, IL-1β, IL-8 and heat-shock protein 70 in head kidney
Real-time RT-PCR was carried out in a quantitative thermal cycler (Mastercyclereprealplex; Eppendorf). The amplification was performed in a total volume of 20 μl containing 10 μl of power SYBR® Green PCR Master Mix (Applied Biosystems), 1 μl of each primer (10 μmol/l), 6 μl of nuclease-free water and 2 μl of cDNA mix. The real-time RT-PCR programme was as follows: 95°C for 10 min, followed by forty cycles of 95°C for 15 s, 60°C for 60 s and 70°C for 20 s. The real-time RT-PCR primer pairs for IGF-1, TOR, S6 kinase 1 (S6K1), 4E-BP2, NF-E2-related factor 2 (Nrf2), Kelch-like-ECH associated protein 1 (Keap1), IL-1
β, IL-8 and heat-shock protein 70 (HSP70) and β-actin were designed by Primer Premier 5.0 based on the published nucleotide sequences and listed in Table 3. At the end of each PCR reaction, melting curve analysis of amplification products was carried out to confirm that a single PCR product was present in these reactions. Standard curves were made with five different dilutions (in triplicate) of the cDNA samples and amplification efficiency was analysed according to the following equation E=10(−1/slope)−1. The expression levels of the target genes were calculated according to the
 $$2^{{{\minus}\Delta \Delta C_{t} }} $$
method described by Yao et al.(
Reference Yao, Kong and Wang
47
).
$$2^{{{\minus}\Delta \Delta C_{t} }} $$
method described by Yao et al.(
Reference Yao, Kong and Wang
47
).
Table 3 Primers used for quantitative RT-PCR (qPCR)
TOR, target of rapamycin; F, forward sequence; R, reverse sequence; S6K1, ribosomal protein S6 kinase1; 4E-BP2, eIF4E-binding protein; IGF-1, insulin-like growth factor-1; Keap1, Kelch-like-ECH associated protein1; Nrf2, nuclear factor erythroid 2-related factor 2-like 2; HSP70, heat-shock protein 70.
Statistical analysis
Normality and homoscedasticity assumptions were confirmed before any statistical analysis. All evaluated variables were subjected to an ANOVA to determine whether dietary Arg levels significantly (P<0·05) affected the observed responses. In addition, to determine whether the effect was quadratic, a follow-up trend analysis using orthogonal polynomial contrasts was performed( Reference Davis 48 ) using the SPSS 18.0 (SPSS Inc.). The adjusted R 2 (adjusted R 2) was calculated as previously described by Kvalseth( Reference Kvalseth 49 ). The optimum dietary Arg requirement based on WG% or protein productive value (PPV) was established through the quadratic regression model.
Results
Growth performance and feed utilisation
WG% of experimental fish was increased with the increasing dietary Arg levels, up to a peak value at 3·8 % dietary Arg level (Table 4), above which WG% was reduced. Quadratic regression analysis of WG% against dietary Arg levels indicated that optimal dietary Arg level was 3·65 % of DM (6·82 % of dietary protein) (Fig. 1) (y=−38·989x 2+284·823x+70·077, R 2=0·927). Values of daily feed intake (DFI) of fish decreased as dietary Arg increased to 3·1 %, above which it increased with increasing rates of Arg inclusion. Feed conversion ratios (FCR) of fish fed 1·9, 2·2, 3·1 and 4·7 % dietary Arg levels were higher than those of fish fed 3·1, 3·8 and 4·1 % dietary Arg levels. Values of protein efficiency ratio (PER) and PPV were improved as dietary Arg level was increased from 1·9 to 3·1 %, and thereafter these values decreased as dietary Arg level continued to be increased. Quadratic regression analysis of PPV against dietary Arg levels indicated that optimal dietary Arg level was 3·55 % of DM (6·64 % of dietary protein) (y=−2·074x 2+14·721x+14·412, R 2=0·760).
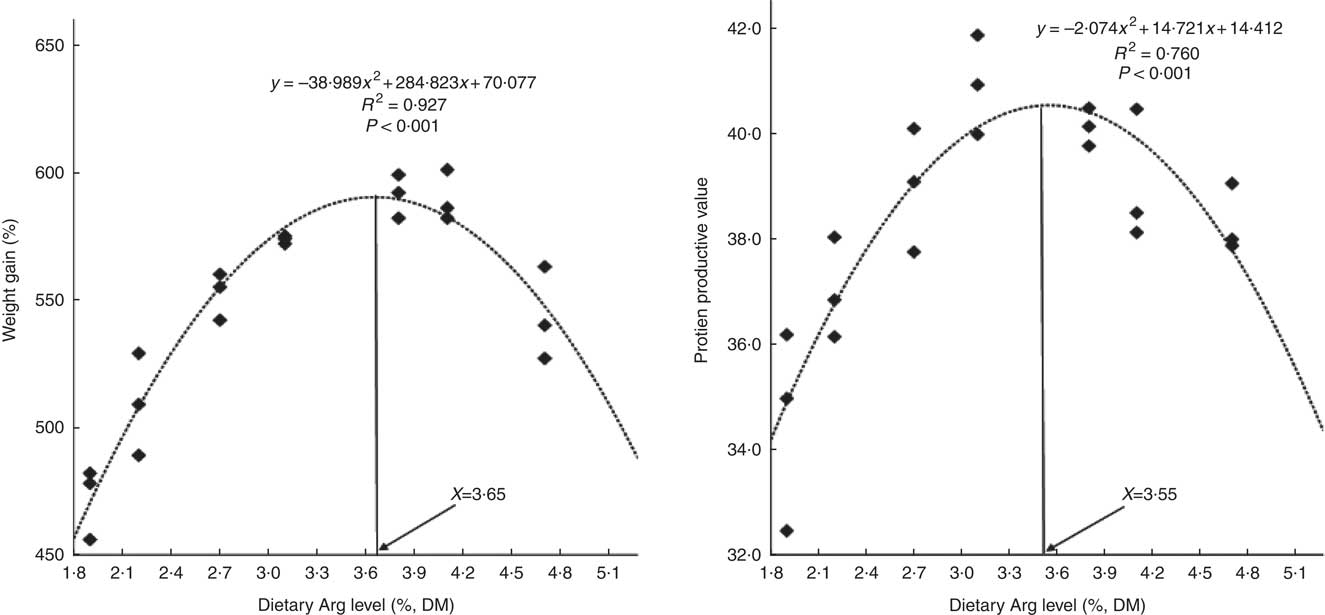
Fig. 1 Relationship of weight gain % and protein productive value with dietary arginine (Arg) levels of hybrid grouper juveniles.
Table 4 Growth performance and feed utilisation of hybrid grouper juveniles fed different dietary arginine (Arg) levels for 8 weeks
WG, weight gain; DFI, daily feed intake; FCR, feed conversion ratio; PER, protein efficiency ratio; PPV, protein productive value; PSE, pooled standard error of treatment means (n 3); SOP, second-order polynomial trend; Adj. R 2, adjusted R 2.
* WG: 100×(final mean body weight−initial mean body weight)/initial mean body weight.
† DFI=100×feed offered /average total weight/d.
‡ FCR: g dry feed/g weight gain.
§ PER: g weight gain/g protein fed.
|| PPV: g protein gain/g protein fed.
Whole-body and muscle compositions
The protein contents of whole body and muscle were significantly influenced by the experimental treatments (P<0·05) (Table 5). Fish fed 3·8 % dietary Arg had higher whole-body and muscle protein contents than fish fed other levels of dietary Arg. Fish fed 1·9 % dietary Arg had the lowest whole-body and muscle protein contents among all experimental treatments. Whole-body lipid contents of fish fed 1·9, 2·2, 2·7 and 3·1 % were higher than those of fish fed 3·8, 4·1 and 4·7 %. There were no significant differences in whole-body moisture, muscle lipid and muscle moisture among any of the experimental treatments.
Table 5 Whole-body and muscle compositions (fresh-weight basis) of hybrid grouper juveniles fed different dietary arginine (Arg) levels for 8 weeks
PSE, pooled standard error of treatment means (n 3); SOP, second-order polynomial trend; Adj. R 2, adjusted R 2.
Amino acid concentrations in muscle and serum
Contents of individual AA, such as lysine, methionine, threonine, valine, aspartic acid, glutamic acid, alanine, the total essential amino acids and non-essential amino acids in muscle of fish fed 3·1 and 3·8 % dietary Arg levels were higher than those in muscle of fish fed 1·9, 2·2 and 2·7 % dietary Arg levels (Table 6). Fish fed 3·8 % dietary Arg level had higher Arg concentrations in muscle compared with fish fed other experimental diets. Muscle histidine contents of fish fed 3·1, 3·8 and 4·1 % dietary Arg levels were higher than those of fish fed 1·9, 2·2, 2·7 and 4·7 % dietary Arg levels. Muscle proline contents of fish fed 2·2, 2·7 and 4·7 % dietary Arg levels were lower than those of fish fed other experimental diets.
Table 6 Dorsal muscle amino acids (g/100 g wet weight) of juvenile hybrid grouper fed different dietary Arg levels for 8 weeks
SOP, second-order polynomial trend; PSE, pooled standard error of treatment means (n 3); Adj. R 2, adjusted R 2.
In serum, fish fed 1·9, 2·2 and 2·7 % dietary Arg levels showed significantly lower Arg concentrations compared with fish fed 3·1, 3·8, 4·1 and 4·7 % dietary Arg levels (Table 7). Fish fed 1·9, 2·2, 4·1 and 4·7 % dietary Arg levels had lower serum glutamic acid concentrations compared with fish fed 2·7, 3·1 and 3·8 % dietary Arg levels. Fish fed 3·8 % dietary Arg level exhibited the highest serum glutamine content among all experimental treatments. Citrulline and ornithine contents in serum were too low to be detected by the methods used.
Table 7 Serum amino acids (mg/100 ml) of juvenile hybrid grouper fed different dietary arginine (Arg) levels for 8 weeks
–, not detected; PSE, pooled standard error of treatment means (n 3); SOP, second-order polynomial trend; Adj. R 2, adjusted R 2.
Gut morphometric analysis
Morphometric measurements of mid gut are summarised in Table 8, and histological examination images are shown in Fig. 2. Villus height, enterocyte height, muscular layer thickness and serosa thickness of mid gut showed obvious responses to dietary Arg supplementations. Villus height of fish fed 1·9 and 2·2 % dietary Arg levels were significantly lower than that of fish fed other experimental diets. Fish fed 1·9, 2·2 and 2·7 % dietary Arg levels had lower enterocyte height compared with fish fed 3·1, 3·8, 4·1 and 4·7 % dietary Arg levels. Muscular layer thickness of mid gut was improved as dietary Arg level increased from 1·9 to 4·1 %, and thereafter it was decreased as dietary Arg level increased from 4·1 to 4·7 %. Serosa thickness of mid gut of fish showed a similar tendency as muscular layer thickness, and fish fed 3·8 and 4·1 % dietary Arg levels had significantly higher serosa thickness compared with fish fed other dietary Arg levels.
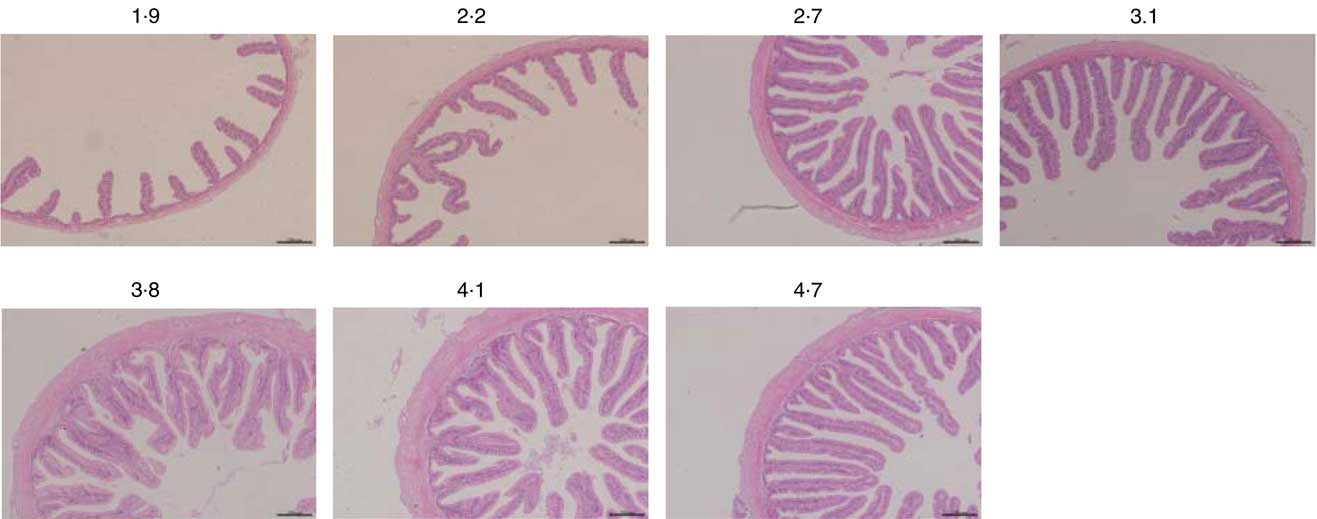
Fig. 2 Light microscopy of the mid gut morphology of hybrid grouper juveniles in fish fed different dietary arginine levels for 8 weeks (haematoxylin–eosin staining; original magnification 10×).
Table 8 Gut morphology (μm) of juvenile hybrid grouper fed different dietary arginine (Arg) levels for 8 weeks
PSE, pooled standard error of treatment means (n 3); SOP, second-order polynomial trend; Adj. R 2, adjusted R 2.
The relative mRNA expression levels of hepatic insulin-like growth factor-I, target of rapamycin, S6 kinase 1 and eIF4E-binding protein genes
The relative mRNA expression levels of the hepatic IGF-1 gene in fish fed 3·8 and 4·1 % dietary Arg levels were higher than those in fish fed 1·9, 2·2, 2·7, 3·1 and 4·7 % dietary Arg levels (Fig. 3). Fish fed 1·9, 2·1 and 4·7 % dietary Arg levels had lower hepatic mRNA levels of the TOR gene compared with fish fed 2·7, 3·1, 3·8 and 4·1 % dietary Arg levels. Fish fed 3·8 % dietary Arg level had the highest relative mRNA expression levels the TOR gene in liver among all experimental treatments. The relative hepatic mRNA expression levels of the S6K1 gene increased as dietary Arg level increased, reaching a peak value at 3·8 % dietary Arg level, and then they decreased when dietary Arg level continued to rise to 4·1 or 4·8 %. There were no significant differences in the relative mRNA expression levels of the 4E-BP2 gene in liver among fish fed different dietary Arg levels.
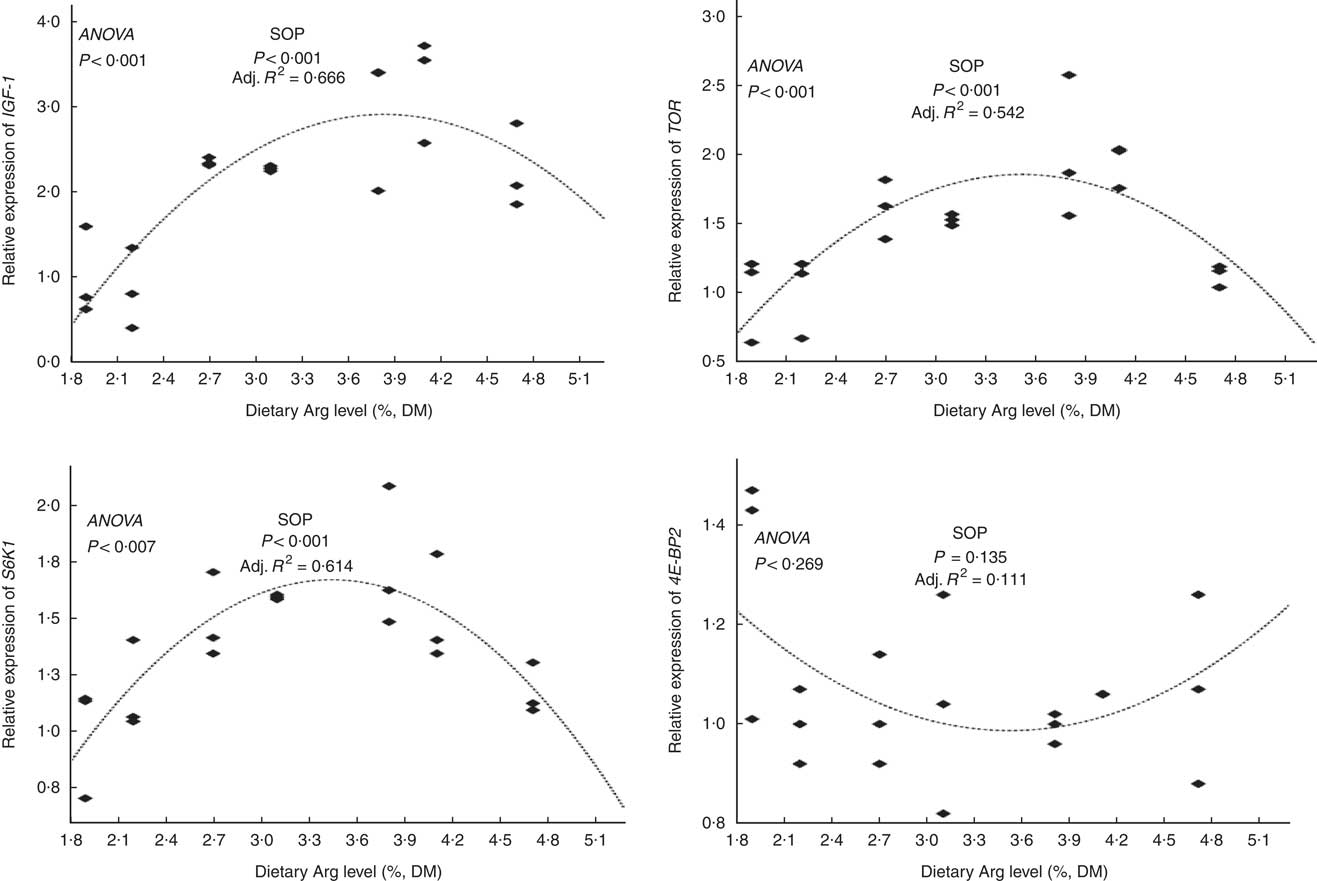
Fig. 3 Relative expression of hepatic insulin-like growth factor-1 (IGF-1), target of rapamycin (TOR), S6 kinase 1 (S6K1) and eIF4E-binding protein (4E-BP2) genes of hybrid grouper juveniles fed diets with different arginine (Arg) levels for 8 weeks (n 9). Relative mRNA expression was evaluated by real-time quantitative PCR. SOP, second-order polynomial trend; Adj. R 2, adjusted R 2.
Survival, serum immune indices and hepatic antioxidant indices
Before challenge (exposure to 4·5 mg Cu(II)/l water for 36 h)
Fish survival ratios and serum lysozyme activity showed no remarkable variations among all experimental treatments after they were fed experimental diets for 8 weeks (Fig. 4). Fish fed 3·8 % dietary Arg level had significantly higher serum IgM concentrations than fish fed 1·9, 2·2, 2·7 or 4·7 % dietary Arg level. Fish fed 1·9 % dietary Arg level displayed lower serum IgM concentrations than fish fed other dietary Arg levels. Fish fed 3·1 and 3·8 % dietary Arg levels had higher hepatic catalase (CAT) activities compared with fish fed other levels of dietary Arg (Fig. 5). Fish fed 3·8 % or 4·1 % dietary Arg level had lower malondialdehyde (MDA) contents in liver compared with fish fed other dietary Arg levels, and fish fed 1·9 % dietary Arg level had the highest MDA content in liver among all experimental treatments.
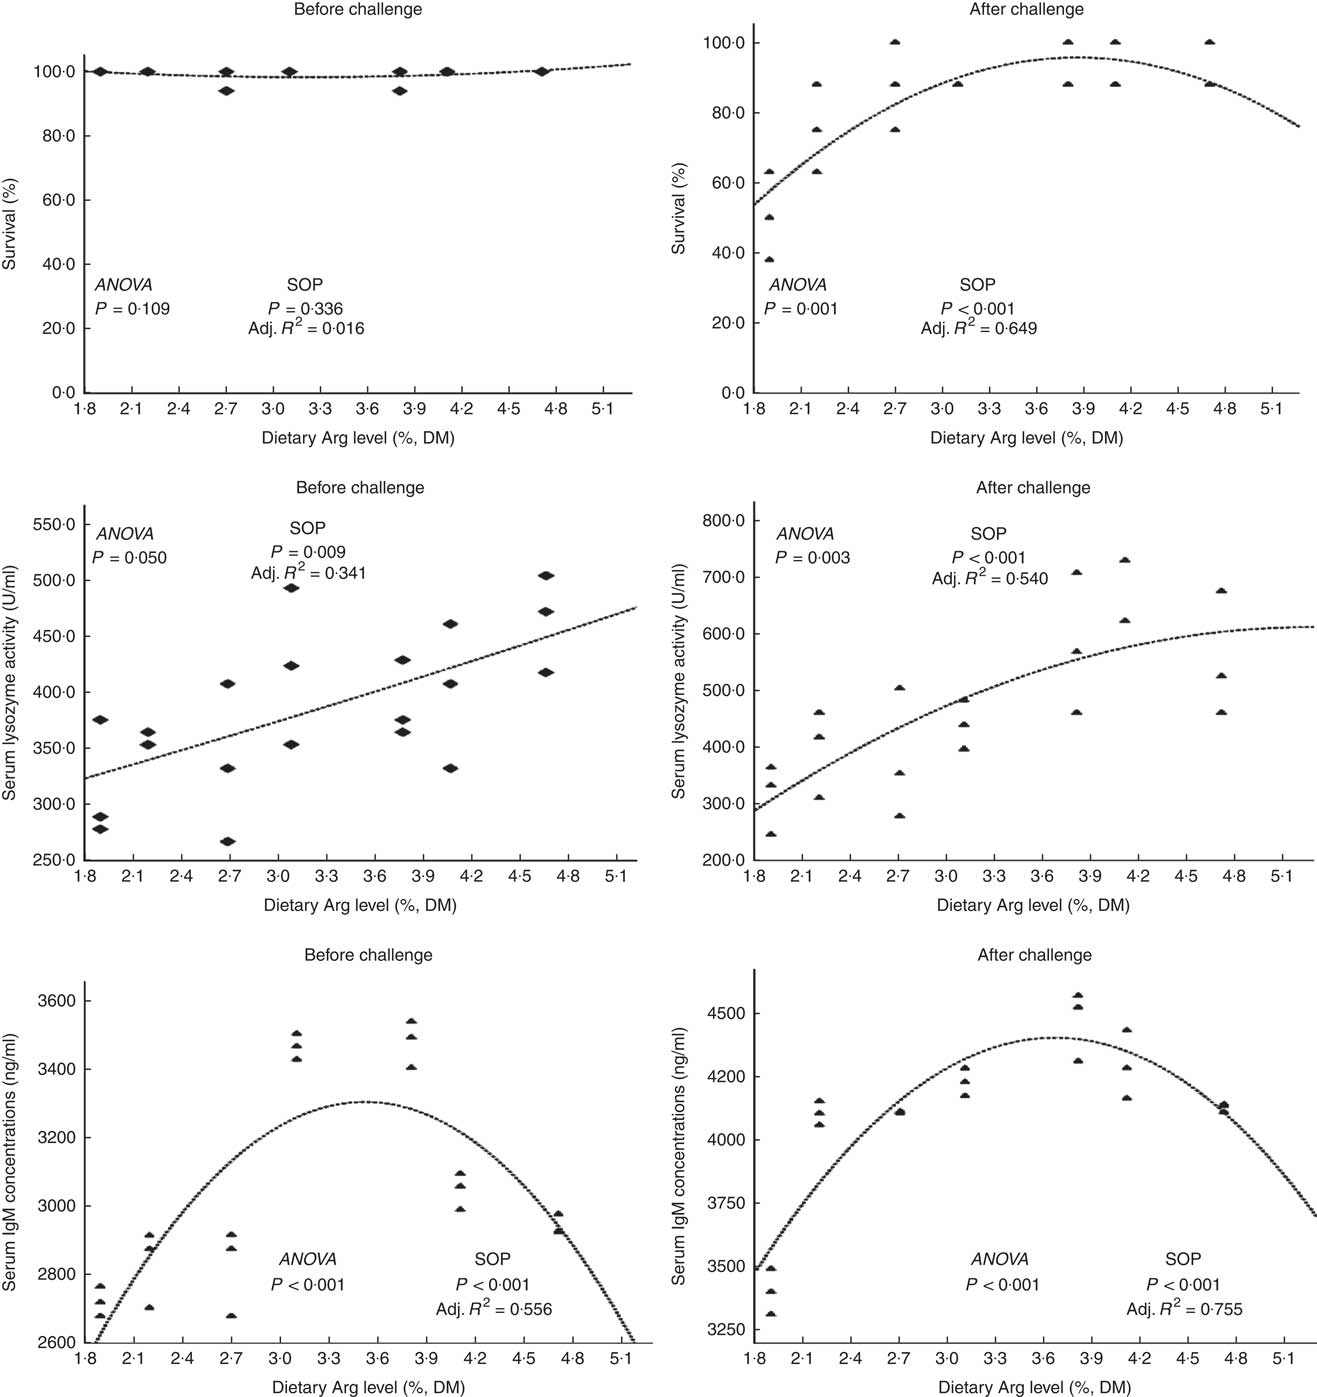
Fig. 4 Survival and serum lysozyme activity and IgM concentrations of hybrid grouper juveniles fed different dietary arginine (Arg) levels for 8 weeks before/after exposure to 4·5 mg Cu(II)/l water for 36 h (n 9). SOP, second-order polynomial trend; Adj. R 2, adjusted R 2.
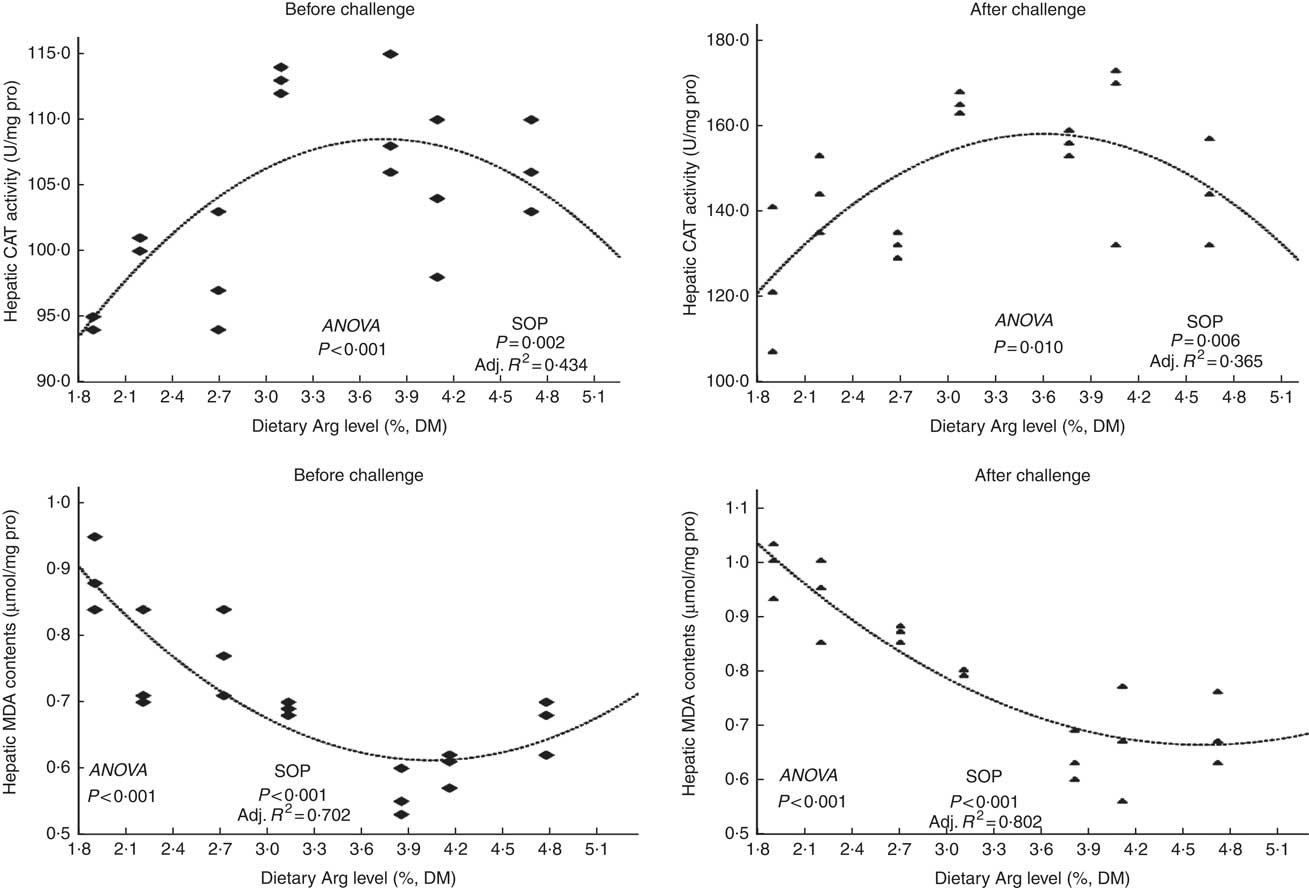
Fig. 5 Hepatic catalase (CAT) activity and malondialdehyde (MDA) contents of hybrid grouper juveniles fed different dietary arginine (Arg) levels for 8 weeks before/after exposure to 4·5 mg Cu(II)/l water for 36 h (n 9). SOP, second-order polynomial trend; Adj. R 2, adjusted R 2.
After challenge (exposure to 4·5 mg Cu(II)/l water for 36 h)
Fish fed 1·9 and 2·2 % Arg levels had lower survival ratios than fish fed higher (2·7–4·7 % dietary) Arg levels after exposure to 4·5 mg Cu2+/l water for 36 h. Serum lysozyme activities in fish fed 1·9, 2·2 and 2·7 % dietary Arg levels were lower than those in fish fed higher dietary Arg levels. Fish fed 3·8 % dietary Arg level had higher serum IgM concentrations than fish fed other experimental diets, and serum IgM concentrations of fish fed 1·9 % dietary Arg level were the lowest among all experimental groups. Fish fed 1·9 % dietary Arg level had a lower value of CAT activity than fish fed 3·1 % dietary Arg level. Hepatic MDA contents in fish fed 1·9, 2·2, 2·7 and 3·1 % dietary Arg levels were higher than those in fish fed dietary Arg levels above these inclusion levels.
Expressions of immune genes in head kidney
Before copper-induced oxidative stress (exposure to 4·5 mg Cu(II)/l water for 36 h)
There were no significant differences in Nrf2 gene expressions of head kidney among all experimental groups (Fig. 6). Gene expression of the KEAP1 gene in head kidney of fish fed 1·9, 2·2, 2·7 and 4·7 % dietary Arg levels were higher than those in fish given feed containing 3·1, 3·8 or 4·1 % Arg. Fish fed 1·9, 2·2, 2·7 and 4·7 % dietary Arg levels showed significantly lower gene expression of IL-1 β in head kidney compared with fish fed 3·8 and 4·1 % dietary Arg levels. Transcript levels in head kidney for IL-8 and HSP70 showed no significant differences among groups.
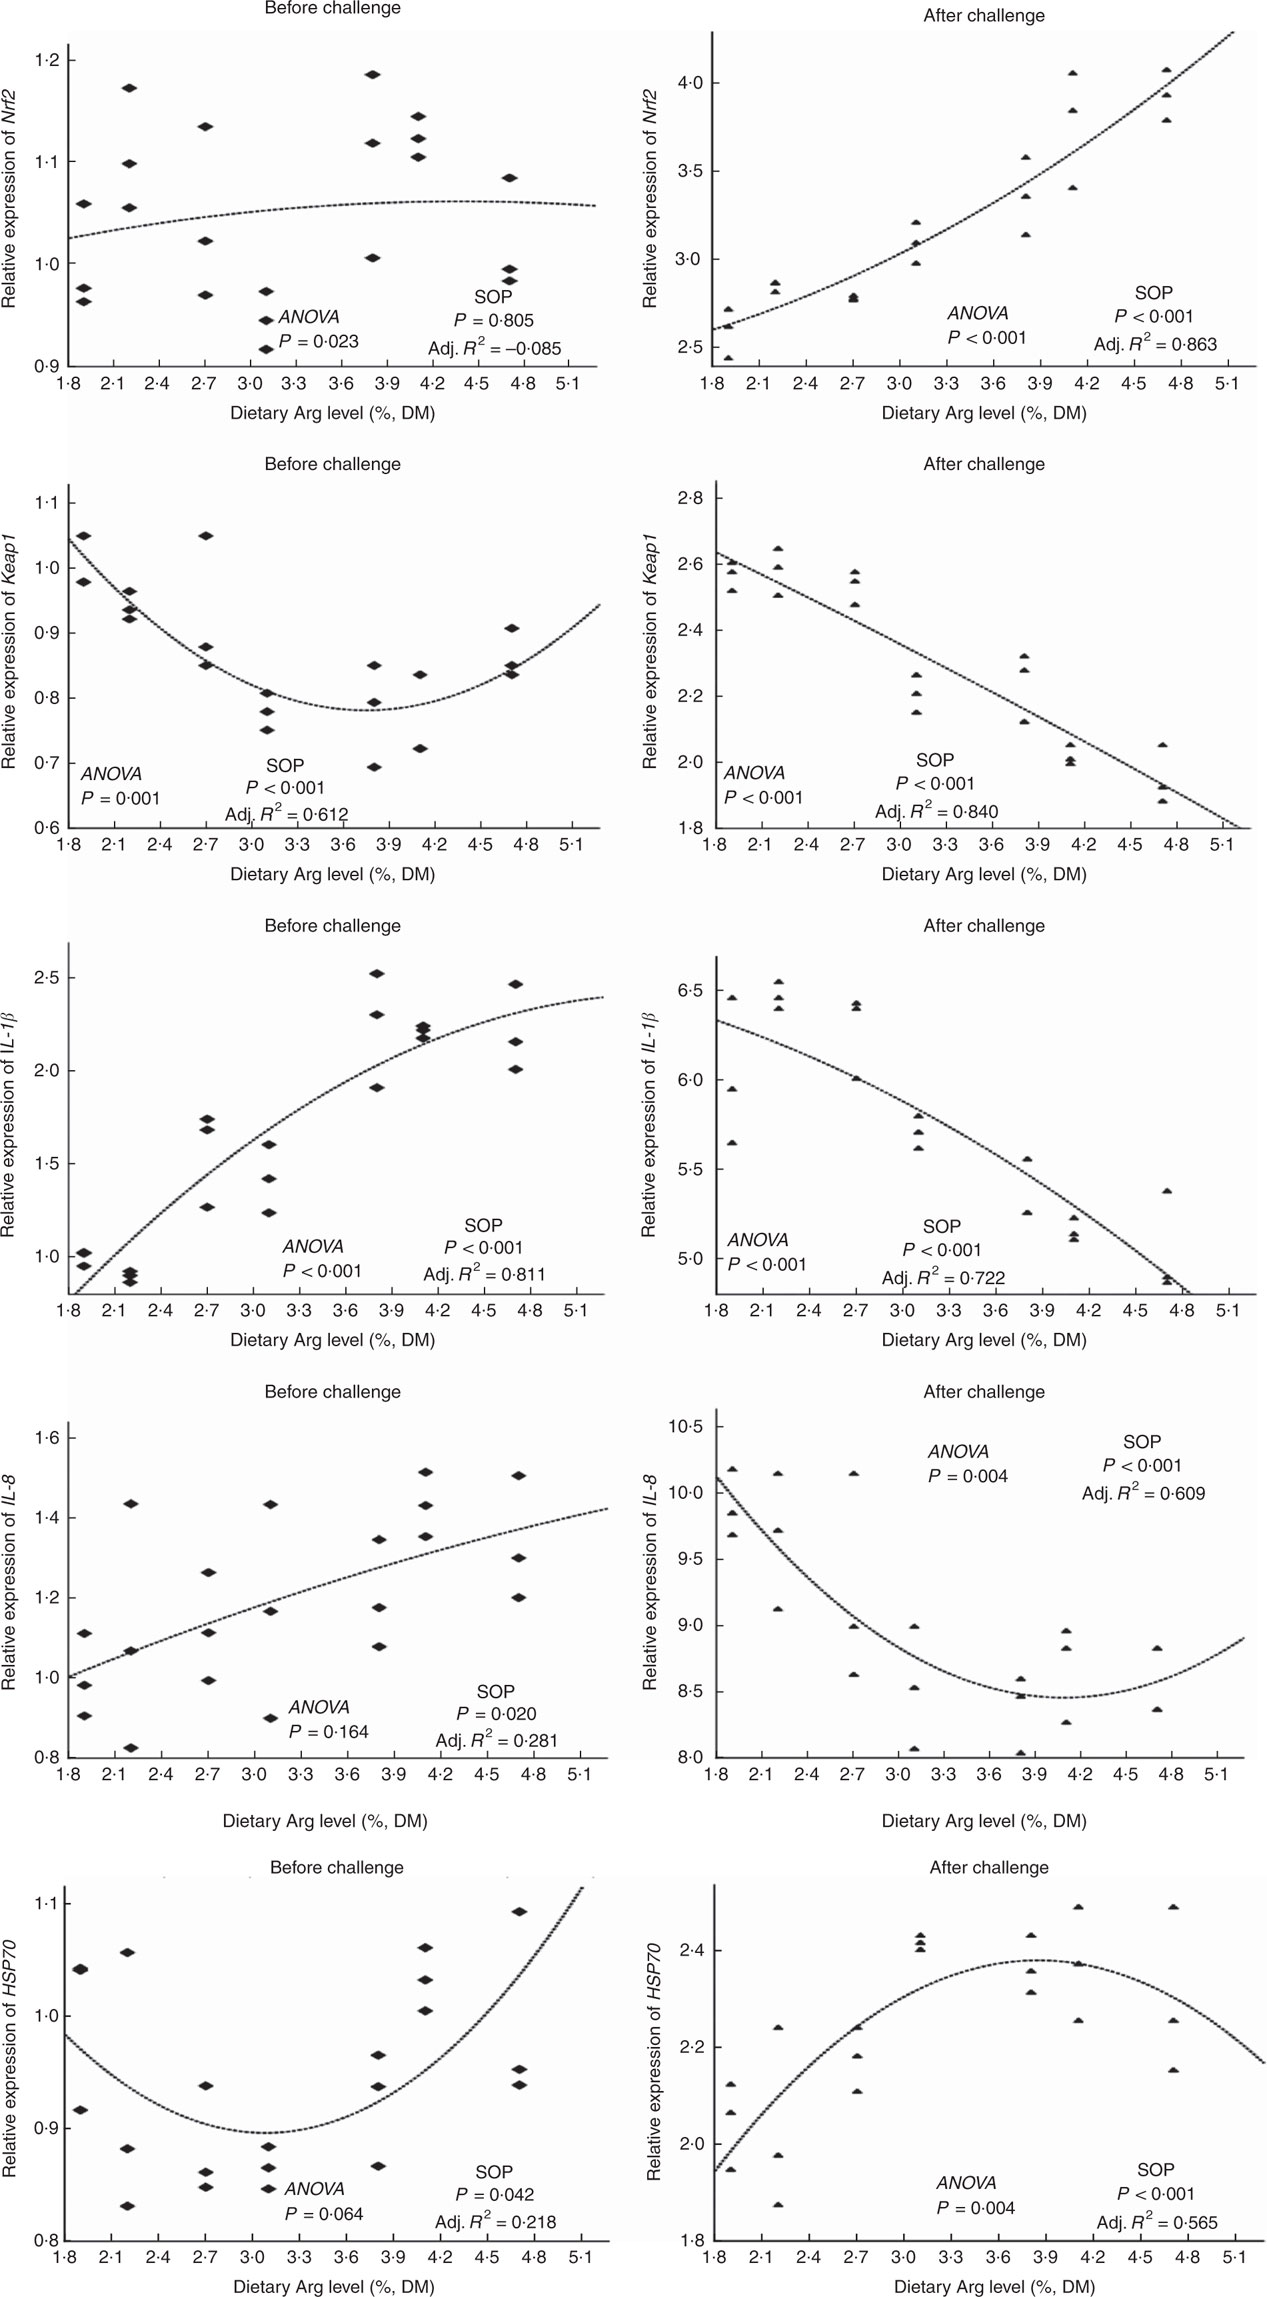
Fig. 6 Relative expression of NF-E2-related factor 2 (Nrf2); Kelch-like-ECH-associated protein 1 (Keap1); IL-1β IL-8; and heat-shock protein 70 (HSP70) genes in the head kidney of hybrid grouper juveniles fed diets with different Arg concentrations for 8 weeks before/after exposure to 4·5mg Cu(II)/I water for 36 h (n 9). Relative mRNA expression was evaluated by real-time quantitative PCR. SOP, second-order polynomial trend; Adj. R2, adjusted R2.
After copper-induced oxidative stress (exposure to 4·5 mg Cu(II)/l water for 36 h)
Levels of Nrf2 mRNA in head kidney of fish fed 1·9 2·2, 2·7 and 3·1 % dietary Arg were lower than those in fish fed other dietary Arg levels. Gene expression levels of KEAP1 in head kidney of fish fed 1·9, 2·2 and 2·7 % dietary Arg levels were significantly higher than those in fish fed other dietary Arg levels. Fish fed 1·9, 2·2, 2·7 and 3·1 % dietary Arg levels had higher gene expression of IL-1 β in head kidney compared with fish fed other dietary Arg levels. Expression levels of IL-8 mRNA in head kidney of fish fed 1·9, 2·2 and 2·7 % dietary Arg levels were higher than those in fish fed other dietary Arg levels. Fish fed 1·9 and 2·2 % dietary Arg levels had lower expression of HSP70 mRNA in head kidney compared with fish fed other dietary Arg levels.
Discussion
This study indicated that optimal dietary Arg requirement of hybrid grouper for maximum growth or PPV was estimated to be 3·55–3·65 % of DM, corresponding to 6·64–6·82 % of dietary protein. The optimal Arg requirement ( % dietary protein) obtained in this experiment was close to that observed in tilapia (6·24 %)( Reference Yue, Zou and Zhu 13 ), cobia (6·20 %)( Reference Ren, Ai and Mai 12 ), yellow grouper (6·5 %)( Reference Zhou, Zeng and Wang 11 ) or silver perch (6·8 %)( Reference Ngamsnae, De Silva and Gunasekera 50 ), but differed from that observed in catla (5·57 %)( Reference Zehra and Khan 51 ), rohu (3·05 %–3·47 %)( Reference Abidi and Khan 52 ), hybrid catfish (4·45 %–5·0 %)( Reference Singh and Khan 9 ), flounder (4·08 %)( Reference Alam, Teshima and Koshio 7 ), channel catfish (3·3 %–3·8 %)( Reference Buentello and Gatlin 6 ) and coho salmon (4·9 %)( Reference Luzzana, Hardy and Halver 53 ) or blunt snout bream(7·23 %)( Reference Ren, Liao and Xie 14 ). Requirements of dietary Arg obtained in different studies for fish species ranged from 3·0 to 8·1 % of dietary protein( 1 ). These differences might be attributed to the differences in fish species, experimental designs or analytical methods. In this study, both excess and insufficiency of dietary Arg resulted in the depression of fish growth. The poor growth of fish fed low dietary Arg levels was ascribed to the reduced growth rate, the low feed efficiency and protein retention, agreeing with the results reported in other fish species( Reference Wilson 54 , Reference Fournier, Gouillou-Coustans and Metailler 55 ). Similarly, the decreased WG of fish fed dietary Arg levels above the optimal requirement were found also in other fish species( Reference Singh and Khan 9 – Reference Zhou, Zeng and Wang 11 , Reference Chen, Feng and Kuang 21 , Reference Plisetskaya, Buchelli-Narvaez and Hardy 27 , Reference Fournier, Gouillou-Coustans and Metailler 55 , Reference Ahmed and Khan 56 ), and the reasons may be the low expression of IGF-1 and TOR genes as observed in the present study. The mechanism of depressing fish growth by excessive intake of Arg needs to be further studied.
Arg can serve as a potent stimulant of insulin and GH( Reference Wan, Mai and Ai 57 ). It has been reported that dietary Arg supplementation affected IGF-1 secretion and hence altered fish growth( Reference Plisetskaya, Buchelli-Narvaez and Hardy 27 , Reference Baoñs, Planas and Gutierrez 58 ). In this study, it was also observed that dietary Arg levels affected hepatic IGF-1 gene expressions. Fish fed 3·8 and 4·1 % dietary Arg levels had higher relative mRNA expression levels of hepatic IGF-1 and better growth than fish fed lower or higher dietary Arg levels, which indicated a positive relationship between growth performance and hepatic IGF-1 expression.
The higher DFI observed in fish fed 1·9 and 2·2 % dietary Arg levels compared with those in fish fed other dietary Arg levels was attributed to their higher FCR, lower PER and PPV, which in turn resulted from Arg insufficiency. It has been shown that when fish are fed an imbalanced AA diet, the absorbed dietary AA are not matching the profile needed for protein synthesis, and become deaminated for use in energy production, gluconeogenesis or lipogenesis( Reference Ballantyne 59 ), accordingly leading to an increment in AA oxidation and catabolism( Reference Kim, McMillan and Bayley 60 , Reference Fauconneau, Basseres and Kaushik 61 ), thus reducing PER and PPV.
The guts of vertebrates are quite sensitive to dietary nutritional alterations either in quality or in quantity( Reference Klurfeld 62 ). Studies on gut morphology of humans and other terrestrial vertebrates have shown that dietary Arg affected gut health, alleviated gut mucosal injury and increased villus height( Reference Hebiguchi, Kato and Yoshino 63 – Reference Liu, Huang and Hou 65 ). In this study, gut morphology of fish, including the villus height, enterocyte height, muscular layer thickness and serosa thickness, generally were improved as dietary Arg level increased. Similar results were also observed in red drum( Reference Cheng, Buentello and Gatlin 2 ) and hybrid striped bass( Reference Cheng, Gatlin and Buentello 3 ).
The higher muscle protein contents in fish fed 3·1, 3·8 and 4·1 % dietary Arg levels, compared with those in fish fed 1·9, 2·2 and 2·7 % dietary Arg, indicated that dietary Arg supplementation improved the N retention and protein deposition of hybrid grouper, which coincided with the higher PPV and muscular total AA contents observed in fish fed 3·1, 3·8 and 4·1 % dietary Arg levels. These results also agreed with data from the study of Liang et al.( Reference Liang, Ren and Habte-Tsion 16 ). Protein deposition was obviously associated with AA metabolism in fish( Reference Sveier, Raae and Lied 66 ). The role of Arg in protein synthesis was mainly through activation of the mTOR signalling pathway( Reference Liang, Ren and Habte-Tsion 16 ). In mammals, dietary Arg supplementation can stimulate mTOR signalling activity( Reference Holz, Ballif and Gygi 18 , Reference Kong, Bie Tan and Yin 19 , Reference Hidetoshiban, Yamatsuji and Gunduz 67 ) and protein synthesis( Reference Kong, Bie Tan and Yin 19 ). In this study, suitable Arg supplementation levels in diets improved the transcription abundances of hepatic TOR and S6K1 genes involved in protein synthesis, which is in accordance with the reports in juvenile gibel carp and blunt snout bream( Reference Tu, Xie and Han 15 , Reference Liang, Ren and Habte-Tsion 16 ).
The contents of certain AA in fish muscle, blood or other tissue represent dietary AA status in fish nutrition studies( Reference Wilson and Poe 68 – Reference Cara, Moyano and Zambonino 70 ). Buentello & Gatlin( Reference Buentello and Gatlin 6 ) reported that dietary glutamate can be used as substrate for the endogenous synthesis of Arg in channel catfish, especially when dietary Arg is deficient. In this study, serum glutamate and glutamine contents did not display an obvious correlation with dietary glutamate levels, and circulating serum citrulline and ornithine were not detected. This indicated that exogenous dietary glutamate did not change into Arg in hybrid grouper at the present experimental conditions. The discrepancy in results might be explained by the differences in fish species, Arg and/or glutamate levels in diets, but further studies would be needed to clarify the underlying reason.
The variations in hepatic CAT activity and MDA content of experimental fish indicated that suitable inclusions of Arg to diets could improve hepatic antioxidant activity of hybrid grouper, but excess or insufficiency of dietary Arg did not have a positive role on fish resistance to oxidative stress, as induced by Cu exposure. Similar results were also observed in juvenile yellow catfish( Reference Zhou, Jin and Elmada 5 ) and young grass carp( Reference Wang, Liu and Feng 71 , Reference Wang, Feng and Jiang 72 ). The functional role of Arg in the antioxidant system of fish is still not well understood. However, l-Arg is the substrate of iNOS, and in rats l-Arg supplementation activated inducible NO synthase, superoxide dismutase, increased CAT2, NO and anti-O2 −1 levels in tissues and serum( Reference Dasgupta, Hebbel and Kaul 73 , Reference Shan, Wang and Gao 74 ). Wallner et al.( Reference Wallner, Hermetter and Mayer 75 ) reported that the effect of l-Arg on the antioxidant defence is also associated with its anti-atherosclerotic effect.
Besides the influence on growth performance, antioxidant system and gut morphology observed in this study, dietary Arg levels were also found to significantly affect the innate immune responses of hybrid grouper regarding the alterations in serum lysozyme activity, IgM concentrations and expression of inflammation-related genes in head kidney. In this study, it was observed that before Cu challenge only serum IgM and Keap1 and IL-1 β mRNA in head kidney robustly responded to different dietary Arg levels, but after Cu challenge all immune parameters measured showed significant responses to different dietary Arg levels. These indicated that the activation of the immune system by suitable Arg supplementation in hybrid grouper mainly occurred when the fish was subjected to Cu stress. The role of Arg in improving innate immunity has been demonstrated in many fish species, such as red drum( Reference Cheng, Buentello and Gatlin 2 ), hybrid striped bass( Reference Cheng, Gatlin and Buentello 3 ), yellow catfish( Reference Zhou, Jin and Elmada 5 ), golden pompano( Reference Lin, Tan and Zhou 76 ), Senegalese sole( Reference Costas, Conceição and Dias 77 ) and Jian carp( Reference Chen, Liu and Jiang 78 ). Results from this study further showed that the mode of action by which Arg acts on the hybrid grouper’s innate immunity is possibly by increasing serum lysozyme activity and IgM concentrations, together with stimulating the Nrf2-Keap1 signalling pathway and HSP70 expression in head kidney, agreeing with the published studies above. Chen et al.( Reference Chen, Liu and Jiang 78 ) also reported that Arg supplementation could increase serum C3 and C4 levels of fish. However, although suitable Arg supplementation increased Nrf2 and HSP70 gene expression in this study, expression of two important proinflammatory mediators, IL-1 β and IL-8, was also suppressed after the challenge, which might suggest that the immune response could be partly impaired. The higher cumulative mortalities of fish fed 1·9 and 2·2 % dietary Arg levels in comparison with those of fish fed other dietary Arg levels were attributed to their impaired gut development, oxidative stress resistance and innate immunity.
In conclusion, results of this study indicated that the optimal dietary Arg requirement for maximum growth or PPV of juvenile hybrid grouper was estimated to be 3·55–3·65 % of DM, corresponding to 6·64–6·82 % of dietary protein, which would be useful in developing AA balanced diets for juvenile hybrid grouper. Optimal dietary Arg supplementation improved gut morphology and resistance against oxidative stress in hybrid grouper.
Acknowledgements
The Author wishes to express their appreciation of the Editor and anonymous reviewers for their valuable suggestions on our manuscript, and is also very thankful to Dr Christer for his help in improving the English writing of the manuscript.
This study was supported by grants from Hainan International Science and Technology Cooperation Projects (no. ZDYF2016222), Natural Science Foundation of Hainan Province (no. 317057) and The National Natural Science Fund (no. 31260641).


