Introduction
Cryptosporidiosis is a worldwide diarrhoeal disease caused by species of the protozoan parasite Cryptosporidium. The parasite is transmitted via the faecal–oral route through the ingestion of oocysts, either by direct contact with infected hosts or in contaminated food or water [Reference Ryan, Zahedi and Paparini1]. Due to its resistance to disinfectants including chlorine [Reference Xiao2], the parasite has been responsible for numerous waterborne outbreaks [Reference Karanis, Kourenti and Smith3–Reference Efstratiou, Ongerth and Karanis5]. Of the 33 species of Cryptosporidium recognised [Reference Jezkova6, Reference Ryan, Fayer and Xiao7], C. hominis and C. parvum are the main species infecting humans worldwide [Reference Xiao2, Reference Ryan, Fayer and Xiao7]. As most species of Cryptosporidium are morphologically identical, molecular typing of Cryptosporidium isolates is essential to investigate the sources of contamination and routes of transmission and identify appropriate interventions [Reference Pérez-Cordón8].
In Australia, the National Notifiable Diseases Surveillance System (NNDSS) was established in 1990, and in 2001, cryptosporidiosis was listed as a national notifiable disease [Reference Blumer9]. The analysis of national notification rates revealed increased total notification rates in 2003, 2005, 2006, 2009, 2012, 2013 and 2015, with the highest number of cases reported in 2009 (4623) [10], suggesting that outbreaks may have occurred. The pattern of cryptosporidiosis in Western Australia (WA), however, is somewhat different, with increased notification rates in 2003, 2007 and 2011 [10].
Cryptosporidiosis outbreaks in Australia have predominantly been attributed to contaminated recreational waters [Reference Ryan, Zahedi and Paparini1, Reference Hellard11–Reference Ng-Hublin18] with one report of an outbreak due to contaminated milk [Reference Harper19], another outbreak linked to contact with animals at a nursery [Reference Ashbolt20] and several others, for which the cause was unknown [Reference Dentith and Alexander21, Reference Peacock22].
Of the three cryptosporidiosis epidemic peaks in WA, analysis was only carried out on the outbreak in 2007 [Reference Ng16]. For this 2007 community-wide outbreak, molecular typing carried out to characterise the species and subtype associated with the outbreak identified the C. hominis IbA10G2 in the samples related to the outbreak [Reference Ng16]. No specific point source outbreaks were identified by the WA Department of Health, although a high proportion (64%) of cases did swim in a pool and 16% reported contact with a person with diarrhoea [Reference Ng16]. Little is known about the other cryptosporidiosis outbreaks that occurred in 2003 and 2011 in WA.
To better understand the transmission, trends and nature of cryptosporidiosis outbreaks in WA, this study aimed to retrospectively compare and review these three cryptosporidiosis outbreaks in 2003, 2007 and 2011 in WA. The analyses were carried out based on the case notification data available on the Western Australian Notifiable Infectious Disease Database (WANIDD) and matching molecular genotyping analyses (where available) to better understand the epidemiology of these outbreaks.
Methods
Case definition
The Australian case definition for cryptosporidiosis notification, which has also been adopted by WA, requires laboratory-definitive evidence through the detection of Cryptosporidium oocysts [10].
Outbreak periods, data source and analysis
Cryptosporidiosis notification data used in the present study were obtained from the WANIDD by the Communicable Disease Control Directorate (CDCD) at the Department of Health, WA. The WA surveillance system relies on mandatory reporting of notifiable diseases by laboratories and medical practitioners. Notifications and information of cases with notifiable diseases are uploaded onto WANIDD, which is an intranet-based real-time application and database that stores these information, and is coordinated and maintained by the CDCD.
Data for all reported cases of cryptosporidiosis were extracted from WANIDD for the period of January 2001 to December 2011 by optimal date of onset (ODOO). The ODOO is defined as the ‘hypothesised’ date of onset, provided by the notifying doctor, or obtained during case follow-up or the date of specimen collection for laboratory-notified cases; and when none of these dates are available, the date of notification by the doctor or laboratory, or the date of receipt of notification, whichever is earliest. Variables exported from WANIDD included public health unit (PHU), sex, race, age, travel history, location where infection was acquired, hospitalisation and the infecting Cryptosporidium species based on molecular typing data (where available).
The start and end of each outbreak period was defined as at least a twofold increase in notifications above expected (compared with non-outbreak years) for consecutive months, and capturing the start of the increase and return to expected levels as indicated by the epidemic curve (Fig. 1). A case was defined as a person diagnosed with cryptosporidiosis with an onset date of illness within the respective outbreak period. Cases that were not residents in WA were excluded from the analyses.

Fig. 1. Epidemiological curve showing the number of cryptosporidiosis cases notified from January 2002 to December 2011 in metropolitan, rural and remote areas in WA.
For information on case travel history, analysis was based on cases which reported ‘yes’ or ‘no’ and any data where history was listed as unknown were excluded from the analysis.
Molecular identification and analysis
Molecular typing was conducted on a total of 167 Cryptosporidium-positive human faecal samples provided by WA clinical pathology laboratories. These included typing conducted in a previous study on the characterisation of clinical cryptosporidiosis cases in WA by Ng et al. [Reference Ng, MacKenzie and Ryan23] (n = 83) and characterisation of the 2007 outbreak (n = 43) [Reference Ng16]. Molecular typing of the 2011 outbreak (n = 41) was carried out as part of the present study. These samples were matched to the basic demographic data of cases from WANIDD. Molecular typing data were unavailable for the 2003 outbreak.
Total faecal DNA was extracted using a QIAmp DNA Stool Kit (Qiagen, Hilden, Germany). Initial genotyping of the samples was carried out by PCR-RFLP of an 830 bp fragment of the Cryptosporidium 18S gene locus as described by Xiao et al. [Reference Xiao24], using restriction analysis of the PCR product by the VspI (Promega, Madison, Wisconsin, USA) to discriminate between C. hominis and C. parvum. For samples that failed to amplify or produced ambiguous banding patterns, a two-step nested PCR and sequencing of a 540 bp product, the 18S gene locus was carried out [Reference Ryan25]. Cryptosporidium hominis and C. parvum-positive samples were sub-typed at the gp60 locus using a two-step nested PCR that amplified an 830 bp fragment [Reference Strong, Gut and Nelson26, Reference Sulaiman27]. Secondary PCR products were purified and sequenced as described by Ng et al. [Reference Ng, Pavlasek and Ryan28].
Data analysis
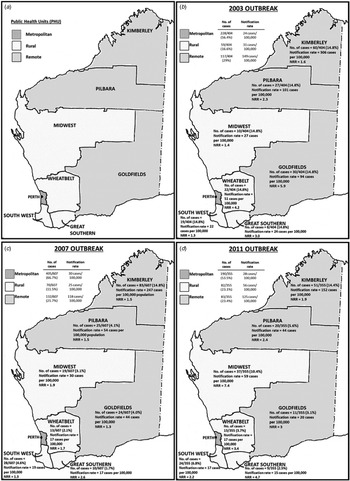
Data analysis was conducted using the Microsoft Excel 2010 add in, OpenEpi (version 3.01. http://openepi.com/v37/Menu/OE_Menu.htm) and Stata® v13 (https://www.stata.com). Incidence rates were calculated using annual census population data available through the Rates Calculator software (Department of Health, WA) and age-standardised to the Australian population. All rates were annualised so rates could be compared. PHUs in WA were divided into three different regions: metropolitan (north and south), remote areas (Kimberley, Pilbara and Goldfields PHUs) and rural areas (Midwest, Wheatbelt, South West and Great Southern PHUs) (Fig. 2a). WA population estimates for PHU areas, year, sex, age and aboriginality were used to calculate the incidence rates and described as the number of notified cases per 100 000 population.

Fig. 2. Western Australia public health unit classification of health administrative regions; (a) metropolitan, rural and remote areas; and (b–d) the number of cases, notification rates (rates per 100 000 population) and notification rate ratios (NRR)* for each PHU area for the 2003, 2007 and 2011 outbreaks, respectively. NRR was calculated based on the comparison of notification rate of outbreak years with 5-year average (of 7-month periods) of non-outbreak years.
The 7-month average of non-outbreak periods was calculated based on the notifications from the month of December from the previous year to June, over a 5-year period (see Table 1). Notification rate ratios were calculated by dividing the notification rate of metropolitan, rural or remote areas with the notification rate of the 7-month average of non-outbreak years (Table 1; Figs 2b–d). As hospitalisation data were only available from 2005 onwards, comparison with non-outbreak years was based on the average number of cases that reported hospitalisation per month in 1 year multiplied by the number of months in the corresponding outbreak period. The average was calculated based on the 7-month average of non-outbreak periods over a 4-year period from December 2005 to June 2006, December 2007 to June 2008, December 2008 to June 2009 and December 2009 to June 2010.
Table 1. Summary of case notification numbers and rates (per 100 000 population) by population groups in the 2003 (December 2002 to June 2003), 2007 (November 2006 to August 2007) and 2011 (January 2011 to May 2011) outbreaks, and a 5-year average (of 7-month periods) in previous, non-outbreak years

a Periods used for the 5-year average were December 2001 to June 2002, December 2003 to June 2004, December 2004 to June 2005, December 2005 to June 2006, December 2007 to June 2008, December 2008 to June 2009 and December 2009 to June 2010.
Ethical clearance
This study was performed with approval from the Murdoch University Human Ethics Committee (Permit number 2012/208) and WA Department of Health Human Ethics Committee (Permit number 2009/48).
Results
The 2003 outbreak: December 2002 to June 2003
During the outbreak period from December 2002 to June 2003, a total of 405 cryptosporidiosis cases were notified. One case (1/405) was not a resident of WA and was therefore excluded from further analyses. The number of cases notified in this outbreak period was 3.1 times higher than the average number of notifications from a similar period in the previous non-outbreak year (Table 1; Fig. 1). The annualised rate for this outbreak period was 33 cases/100 000 population. A total of 56.4% of notified cases were from the metropolitan area, followed by 29.0% from remote areas and 16.6% from rural areas with case notification rates being highest in the remote areas, followed by rural and metropolitan areas (Table 1; Fig. 2b).
Compared with a similar period in the previous non-outbreak years (Table 1), the metropolitan area had a 5.2-fold increase in total case notifications (notification rate ratio 4.8), while in the rural and remote areas, case notifications were 2.0 (notification rate ratio 2.0) and 2.1 (notification rate ratio 2.1) times higher, respectively (Table 1). An increase in total case notification numbers and notification rates was observed for all PHU areas when compared with non-outbreak years with notification rate ratios ranging from 1.3 to 5.7 (Fig. 2b). Although the metropolitan area reported the greatest increase in the number of cases notified, the greatest rate increase was reported in the Goldfields (remote) (notification rate ratio 5.7) followed by metropolitan (notification rate ratio 5.3) (Fig. 2b).
Children in the 0–4 years age group comprised 58.2% (235/404) (320 cases/100 000 population) of cases, followed by individuals aged 30–34 years (8.9%) (42 cases/100 000 population), 05–09 (6.9%) (36 cases/100 000 population), 35–39 (6.2%) (29 cases/100 000 population) and 10–14 (4.4%) (22 cases/100 000 population). Individuals aged 25–29 and 40–44 years comprised 4.2% of cases each. Those in the other remaining age groups comprised <2% of cases (Fig. 3). Overall, there were similar proportions of infection in males (48%) and females (52%). When examining the differences between age groups and gender, females aged 30–34 years were two times more at risk of infection compared with males in the same age group (RR 2.3; 95% CI 1.1–5.2, P = 0.009). No correlation was found between genders within other age groups.

Fig. 3. Cryptosporidiosis notifications by race in each age group for the 2003, 2007 and 2011 outbreaks.
Of the 404 cases notified in this period, 21% (85/404) (215 cases/100 000 population) of cases were identified as Aboriginal people and 30.4% (123/404) (11 cases/100 000 population) were non-Aboriginal people, with the Indigenous status of 48.5% (196/404) of cases unknown (Table 1). Comparing between outbreak and non-outbreak years, the notification rate ratio in Aboriginal people was 2.0 and in non-Aboriginal people it was 2.75. Aboriginal people cases were mainly residents of the Kimberley (48.2% – 41/85), whereas more than half (52.8% – 65/123) of non-Aboriginal people cases were residents of the metropolitan area. Among Aboriginal people, a high proportion of notifications was from children in the 0–4 years age group (96.4% – 82/85), compared with 46.3% (57/123) of non-Aboriginal cases in the 0–4 years age group (Fig. 3). The analysis showed that Aboriginal people in the 0–4 years age group were 10.4 times more at risk of being infected (RR 10.4; 95% CI 7.3–14.8, P < 0.001) compared with non-Aboriginal people.
The analysis of travel history revealed that 69.3% (283/404) of cases acquired the infection in WA, while only 1.5% (6/404) acquired the infection overseas. The place of acquisition of infection was unknown for 28.4% (115/404) of cases. For the six cases that acquired the infection overseas, travel to Indonesia (n = 3), Malaysia (n = 1) and New Zealand (n = 1) was recorded, while for one case, no country was listed. Due to incomplete records, no hospitalisation data were available for the notifications in this outbreak period. Genotyping data were not available for any of these isolates.
The 2007 outbreak: November 2006 to August 2007
During the outbreak period from November 2006 to August 2007, a total of 611 cryptosporidiosis notifications were received; four of these cases were not residents of WA and were excluded from further analyses. The number of cases notified in this outbreak was 4.7 times the mean average number of notifications from a similar period in previous non-outbreak years (Table 1). The annualised rate for this outbreak period was 35 cases/100 000 population. The metropolitan area reported the highest number of case notifications, with 66.7% of cases; this was followed by cases residing in remote areas, comprising 21.7% of case notifications and rural areas, which comprised 11.5% of case notifications (Fig. 2c). The highest notification rates were reported in remote areas, followed by metropolitan and rural areas (Table 1).
Compared with the average number of cases notified in a similar period in non-outbreak years, the number of cases notified in this outbreak year was 9.3 times higher (notification rate ratio 6.0) in the metropolitan area, 2.4 times higher (notification rate ratio 1.7) in remote areas and 2.3 times higher (notification rate ratio 1.7) in rural areas (Table 1). An increase in total case notifications was observed for all PHU areas (notification rate ratio ranging between 1.3 and 6.0) with the metropolitan area reporting the highest number of cases notified (66.7% of cases) and notification rate ratio when compared with a similar period in the previous non-outbreak years (Fig. 2c).
The number of notifications in each age group, stratified by Indigenous status, is presented in Figure 3. The highest proportion of cryptosporidiosis notifications was in the 0–4 years age group (235 cases/100 000 population), comprising 43.5% (264/607) of cases followed by those in the 5–9 years (9.1%) (48 cases/100 000 population), the 30–34 years (8.1%) (40 cases/100 000 population), 35–39 years (6.8%) (31 cases/100 000 population) and 20–24 years (4.6%) (22 cases/100 000 population) age groups. Individuals in the 10–14 and 25–29 age groups comprised 4.4% and a rate of 22 cases/100 000 population of cases each. Notifications in the other remaining age groups comprised <4% of cases notified in this outbreak period. Overall, there was a similar proportion of infection in males (48%) and females (52%). In the 20–24 and 30–34 years age groups, females were 2.7 times (RR 2.69; 95% CI 1.1–7.1, P < 0.05) and 2.8 times more likely to have cryptosporidiosis (RR 2.8; 95% CI 1.5–5.5, P < 0.05) compared with males in the same age groups.
A total of 14.2% of the 607 notifications in this time period were Aboriginal people (144 cases/100 000 population) and 68.9% (418/607) were non-Aboriginal people (25 cases/100 000 population) (Table 1). Indigenous status was not recorded for 17.0% (103/607) of cases. Comparing the outbreak period with a similar period in non-outbreak years, Aboriginal people had a notification rate ratio of 1.35, while non-Aboriginal people had a notification rate ratio of 6.25. The majority of notifications in Aboriginal people were from the Kimberly area (70.9%–61/86), and in non-Aboriginal people, the majority of cases were from the metropolitan area (76.1%–318/418). Among Aboriginal people, 91.2% of cases (79/86) occurred in the 0–4 years age group (Fig. 3). Aboriginal people in the 0–4 years age group had 8.1 times higher risk of being a notification compared with non-Aboriginal people in the same age group (RR 8.05; 95% CI 6.0–10.6, P < 0.05).
The place of acquisition data was available for 485/607 cases and showed that 87.4% (424/485) of cases acquired cryptosporidiosis in WA during the 2007 outbreak, with 1.2% (6/485) and 11.3% (55/485) of cases acquiring the disease interstate and overseas, respectively. For the remaining 122/607 cases, data on place of disease acquisition were either not reported or unknown. Cases that acquired the disease overseas reported travelling to 25 different countries in Africa, Asia, Antarctica, Europe, North and South America and Oceania. The most frequently reported country of travel was Indonesia (n = 14), followed by Thailand (n = 7). For 4/55 cases, the country of travel was not listed.
Within this outbreak period, a total of 46/607 (7.58%) cases were hospitalised and 414/607 (68.2%) cases reported no hospitalisation. Hospitalisation status for 147/607 were not known. The number of cases that were hospitalised was 1.67 times higher when compared with a similar period in non-outbreak years, where on average, 27.5 cases were hospitalised. Children in the 0–4 age group comprised 63% of hospitalised cases.
Molecular typing of the 2006/2007 outbreak
Species identity data were available for 126 cases notified in the 2007 outbreak period [Reference Ng16, Reference Ng, MacKenzie and Ryan23], of which, two cases were not residents of WA and excluded from this analysis. Molecular characterisation at the 18S rRNA and gp60 gene loci identified C. hominis in 123 cases and C. parvum in one case. Subtyping of the C. hominis and C. parvum isolates at the gp60 gene locus identified five C. hominis subtype families: Ib (n = 57), Id (n = 47), Ie (n = 1), If (n = 2) and Ig (n = 16). Within the C. hominis Id subtype family, three subtypes were identified (IdA15G1, IdA16 and IdA17). The one C. parvum isolate was identified as the IaA18G3R1 subtype. The most common subtype identified was the IbA10G2 subtype in 46.3% of the C. hominis isolates, followed by the IdA15G1 (33.3%) and the IgA17 subtype (13.0%).
The highest subtype diversity was observed in the metropolitan area, where all seven C. hominis subtypes and the one C. parvum subtype were identified (Table 2). The IbA10G2 was the most common subtype and identified predominantly in cases from the metropolitan area, in 66.7% (34/51) of cases (Table 2). In remote areas (Goldfields, Kimberley, Pilbara), cases were mainly attributed to infection with the IdA15G1 subtype, particularly in the Kimberley (79.4% – 27/34), with no other Id subtypes identified in this area (Table 2). Data analysis showed that prior to the outbreak, no cases of IbA10G2 were identified in the remote areas, after which, 11 cases were identified with this subtype late in the outbreak (February to May 2007).
Table 2. Cryptosporidium species and gp60 subtypes identified in the cases of cryptosporidiosis during two outbreaks (2007 and 2011) in Western Australia, stratified by public health unit
Non-Aboriginal cases were mostly infected with the IbA10G2 subtype (60.6% – 43/71), followed by the IdA15G1 subtype (21.1% – 15/71) (Table 3). The IdA15G1 subtype was also the dominant subtype in 66.7% (24/36) of cases in Aboriginal people (Table 3). Non-Aboriginal people were 5.5 times more likely to be infected with the IbA10G2 subtype (RR 5.5; 95% CI 2.1–14.0, P < 0.05) compared with Aboriginal people, but the latter were 3.2 times more likely to be infected with the IdA15G1 subtype, compared with non-Aboriginal people (RR 3.2; 95% CI 1.9–5.2, P < 0.05).
Table 3. Cryptosporidium gp60 subtypes identified in the cases of cryptosporidiosis from the 2007 and 2011 outbreak in Western Australia stratified by Indigenous status; Aboriginal people, non-Aboriginal people and unknown

The place of acquisition data was available for 101/124 genotyped cases. There was a significant subtype diversity among cases that acquired the infection in WA, with the identification of six different C. hominis subtypes (IbA10G2, IdA15G1, IdA16, IeA11G3T3, IfA12G1 and IgA17) and one C. parvum IIaA18G3R1 subtype. For cases that acquired the infection overseas, genotyping data were only available for six cases; four were infected with the IbA10G2 subtype and reported travel to Cambodia (n = 1) and Indonesia (n = 3), respectively; one was infected with the IdA17 subtype and reported travel to Vietnam; and one was infected with the IdA15G1 subtype, with no country of travel listed.
Genotyping data available for 17 hospitalised cases showed that eight were infected with the IbA10G2 subtype, six with the IdA15G1 subtype and three with the IgA17 subtype. Due to the small sample size, no correlation between subtype and hospitalisation could be determined.
The 2011 outbreak: January 2011 to May 2011
A total of 356 cryptosporidiosis notifications were received during the outbreak period from January 2011 to May 2011, of which, one case was not a resident of WA and excluded from further analyses. The number of case notifications in this outbreak was 2.8 times higher than the mean average number of notifications for a similar period in the previous five non-outbreak years (Table 1). The annualised rate for this outbreak period was 36 cases/100 000 population.
The metropolitan area reported the highest number of notifications, consisting of 53.5% of cases, which was 4.3-fold higher than the average number of cases notified for a similar period in non-outbreak years (notification rate ratio 6) (Table 1; Fig. 2d). The rural areas consisted of 23.1% of cases (56 cases/100 000 population) and showed a 2.8-fold increase in case notifications (notification rate ratio 3.7) compared with a similar period in non-outbreak years. Remote areas consisted of 23.4% of notifications (125 cases/100 000 population), which was a 1.5-fold increase in case notifications (notification rate ratio 1.8), when compared with the average number of cases notified for a similar period in non-outbreak years. An increase in total case notifications was observed for all PHU areas (notification rate ratio ranging between 1.9 and 7.4) (Table 1; Fig. 2d). Although the metropolitan area reported the highest number of cases notified, the Midwest reported the highest notification rate increase with a ratio of 7.4, when compared with a similar period in the previous non-outbreak years (Fig. 2d).
The highest number of cryptosporidiosis notifications was observed in the 0–4 years age group (51.8%−184/355) (283 cases/100 000 population), followed by the 5–9 years (10.3%) (60 cases/100 000 population), 35–39 years (7.3%) (37 cases/100 000 population), 30–34 years (7.0%) (36 cases/100 000 population) and 25–29 years (4.2%) (19 cases/100 000 population) age groups (Fig. 3). Notifications in the other remaining age groups comprised <4% of cases notified in this outbreak period (Fig. 3). There was no significant difference in the rate of notifications for males and females in each of the age groups.
There was a higher number of notifications in non-Aboriginal people (73.6%–262/355) (28 cases/100 000 population) compared with Aboriginal people (22.8%–81/355) (256 cases/100 000 population). Indigenous status was not recorded for 3.4% (12/355) of notified cases. Comparing the outbreak period and a similar period in non-outbreak years, Aboriginal people had a notification rate ratio of 2.39, while non-Aboriginal people had a notification rate ratio of 7.00. Notifications in non-Aboriginal people were primarily from the metropolitan area (67.9%–178/262), whereas notifications in Aboriginal people were primarily from the Kimberley area (50.6%–41/81), followed by the Midwest (16.0%–13/81) and Pilbara areas (14.8%–12/81). The proportion of Aboriginal cases from children in the 0–4 years age group was significantly higher when compared with non-Aboriginal people (93.8% vs. 39.3%) (Fig. 3). Analysis showed that Aboriginal people in the 0–4 years age group were 14 times more at risk of being infected (RR 13.5; 95% CI 9.9–18.3, P < 0.05) compared with non-Aboriginal people in the same age group.
Of the 355 cases notified within the 2011 outbreak period, place of acquisition was recorded for 312 of the 355 cases notified in the 2011 outbreak period. Of these, 93.3% (291/312) of cases were acquired in WA, with only 6.7% of cases acquired overseas. For cases that acquired the infection overseas, travel to seven different countries were reported, with Indonesia being the most frequently reported country (n = 11), followed by Malaysia (n = 3) Bangladesh (n = 1), Ethiopia (n = 1), Morocco (n = 1), Thailand (n = 1) and Vietnam (n = 1). Country of travel for two cases was not listed.
Hospitalisation data were available for 344/355 cases, with the hospitalisation status for 91/355 of cases unknown. Hospitalisation was reported for 50/344 (14.5%) cases, while 214/344 (62.2%) cases reported no hospitalisation. The number of cases that were hospitalised was 3.64 times higher when compared with a similar period in non-outbreak years, where on average, 13.75 cases were hospitalised. Children from the 0–4 years age group comprised the highest proportion of hospitalised cases at 72%.
Molecular typing of the 2011 outbreak
Molecular characterisation of 42 cases in the 2011 outbreak period identified C. hominis and C. parvum in 38 and four cases, respectively. Subtyping identified two C. hominis subtype families, Ib and Id, and two C. parvum subtypes from the IIa family. The IbA10G2 subtype was the most common C. hominis subtype, identified in 89.5% (34/38) of cases with the IdA15G1 subtype identified in 10.5% (4/38) of C. hominis isolates. Subtyping was successful for three C. parvum isolates, which were identified as IIaA18G3R1 (n = 2) and IIaA15G2R1 (n = 1). The subtype for one C. parvum isolate could not be determined.
Cases identified with the C. hominis IbA10G2 subtype (n = 34) were predominantly from the metropolitan area (30/34), with only two cases identified from the Great Southern and one case each from the Wheatbelt and South West area. The C. hominis IdA15G1 subtype was only identified in the Wheatbelt (n = 2) and South West (n = 2) (Table 2). Cryptosporidium parvum was identified in two cases in the metropolitan area, one of which was the IIaA18G3R1 subtype, while the subtype from the other case could not be determined. The C. parvum IIaA18G3R1 and IIaA15G2R1 subtypes were identified in the South West (n = 1) and Great Southern (n = 1) regions, respectively (Table 2).
Of the 42 cases genotyped in this outbreak period, non-Aboriginal people consisted of 90.4% (38/42) of cases and Aboriginal people 4.8% (2/42), with no recorded Aboriginal status for 4.8% (2/42) of cases. The C. hominis IbA10G2 subtype was identified in 94.1% (32/38) of non-Aboriginal cases, with C. hominis IdA15G1 (n = 3), C. parvum IIaA15G2R1 (n = 1), IIaA18G3R1 (n = 1) and an undetermined C. parvum subtype (n = 1) identified in the remaining non-Aboriginal cases (Table 3). In the two Aboriginal cases typed, the C. hominis IbA10G2 and IdA15G1 were identified, respectively. Due to the small number of cases in Aboriginal people genotyped (n = 2), no statistically significant association could be made.
The place of acquisition data was available for 37 of the 42 cases and 97.3% (36/37) of these acquired the infection in WA, with only one case (2.7%) acquired overseas. For those that acquired the infection in WA, C. hominis was identified in 89.2% (33/37) of cases, with IbA10G2 the most common subtype (n = 29), followed by the IdA15G1 subtype (n = 3). Cryptosporidium parvum was identified in 8.1% (3/37) of cases; IIaA15G2R1 (n = 1), IIaA18G3R1 (n = 1) and undetermined (n = 1). Genotyping analysis carried out on the one case that acquired the infection overseas (Malaysia) identified the IbA10G2 subtype.
Of the 26 cases for which hospitalisation status was available, the majority 80.7% (21/26) reported no hospitalisation. Of the remaining 19.2% (5/26) of cases, subtypes IbA10G2 (n = 3), IdA15G1 (n = 1) and C. parvum IIaA15G2R1 (n = 1) were identified.
Discussion
Of the three outbreaks compared in the present study, the 2007 outbreak had the highest number of case notifications, followed by the outbreaks in 2003 and 2011. These outbreaks appeared to have occurred predominantly in the urban metropolitan area, where the highest number of case notifications and notification rate ratios were reported. Increases in case notifications were also observed in rural and remote areas, but these areas have non-outbreak rates that are 3–12-fold higher than the metropolitan area. One possible explanation could be that, the metropolitan area, which normally has lower rates than rural or remote areas, has a larger population susceptible to Cryptosporidium infection; hence, when an outbreak occurs, it results in a larger proportional increase compared with other areas. Cryptosporidium hominis was the most commonly identified species in both the outbreaks where molecular genotyping data was available. This is consistent with the previous studies, which have found that infections with C. hominis are common in urban areas with high population density, as it provides a stable platform for human-to-human transmission [Reference Xiao2]. However, due to difficulties in distinguishing between outbreak and sporadic cases in a retrospective study, cases notified during the three outbreaks periods may also include cases that occurred sporadically.
A previous investigation into the 2007 outbreak revealed that it was likely associated with swimming pools, with subsequent secondary person-to-person transmission [Reference Dale15, Reference Ng16]. The 2007 outbreak was also the most prolonged outbreak of the three, beginning in late spring (November 2006) and ending in late winter (August 2007). Previous studies have shown that waterborne cryptosporidiosis outbreaks were more likely to occur during this period, as a result of an increase in recreational water activities [Reference Dale15, Reference Yoder and Beach29]. The three outbreaks presented in the present study occurred during late spring/early summer periods, when there would have been an increase in recreational water activities such as swimming in swimming pools, water catchments and natural water holes. This period also coincides with summer vacation travel from metropolitan to rural and remote areas, which may have contributed to the spread of the outbreak.
The C. hominis IbA10G2 subtype is a major cause of sporadic cryptosporidiosis in WA [Reference Ng, MacKenzie and Ryan23], Victoria [Reference Jex30–Reference Koehler32], South Australia [Reference Ng16], New South Wales [Reference Jex30, Reference Jex and Gasser31, Reference Waldron33] and Tasmania [Reference Koehler34]. It has also been associated with various waterborne cryptosporidiosis outbreaks in Australia [Reference Ng16, Reference Waldron17, Reference Mayne35] and a number of large waterborne cryptosporidiosis outbreaks in the USA [Reference Zhou36], Canada [Reference Ong37], France [Reference Glaberman38], UK [Reference Glaberman38, Reference Chalmers39] and Sweden [Reference Widerström40]. In both the 2007 and 2011 outbreaks, the C. hominis IbA10G2 subtype was the most common subtype identified. This subtype is endemic in the WA metropolitan area but is less common in remote and rural areas of WA [Reference Ng, MacKenzie and Ryan23, Reference Ng-Hublin41]. Interestingly, the IbA10G2 subtype was only identified in cases from remote areas late in the 2007 outbreak. This seems to suggest the spread of the outbreak subtype from urban to rural and remote areas. However, genotyping a larger number of cases from rural and remote areas is needed to provide more conclusive evidence on the distribution of different subtypes and to confirm the urban–rural movement during the outbreak.
The observation that notification rates were highest in children aged 0–4 years and adult females aged 30–34 years is consistent with other studies in WA [Reference Ng16, Reference Ng-Hublin41]. This highlights that children ⩽4 years are most susceptible to infection, either due to no previous exposure to Cryptosporidium, and/or have behaviour that encourages infection. This also suggests secondary transmission from infected children to adult females, who are likely to have roles as caregivers within the family, in schools or in nurseries, and day care settings [Reference Yoder and Beach29, Reference Robertson42, Reference Hunter43]. Cryptosporidium is resistant to alcohol and hand sanitisers; hence, proper sanitary practices including washing hands with soap are recommended, especially during outbreaks, as an important measure to prevent subsequent person-to-person transmission [Reference Vandenberg44].
Non-Aboriginal people were most affected in all three outbreaks analysed in the present study; they comprised the majority of cryptosporidiosis cases notified, and compared with Aboriginal people, had higher notification rate ratios than in non-outbreak years. The higher number of notifications in non-Aboriginal people may be a reflection of the distribution of Aboriginal populations in WA. As observed in a recent study, the vast majority of non-Aboriginal people live in urban areas, while most Aboriginal people live in rural and remote areas of WA [Reference Ng-Hublin41]. The notification rate in Aboriginal people, however, is 6–20 times higher than in non-Aboriginal people, which highlights the unequal distribution of disease burden in these communities. This reflects a broader pattern of health inequity that results in significantly higher burden of disease and lower life expectancies in Aboriginal and Torres Strait Island peoples [45].
Infection in Aboriginal people, which constituted the majority of cases in remote areas, was mainly attributed to the IdA15G1 subtype (data not shown). The IdA15G1 subtype is thought to be endemic to the Aboriginal population, particularly in the remote areas of WA [Reference Ng-Hublin41]. This indicates that person-to-person transmission occurs mainly within, rather than between, these two population groups. However, as many apparently sporadic cases may be part of small outbreaks that go undiagnosed [Reference Briggs46], the high proportion of cases from the same area identified with this subtype suggests that, in addition to the outbreak attributed to the IbA10G2 subtype, a second, smaller scaled outbreak attributed to the IdA15G1 subtype may have occurred concurrently among the Aboriginal communities.
In both the 2007 and 2011 outbreaks, a higher number of cases were hospitalised compared with non-outbreak years, with >50% of cases hospitalised being young children <4 years in age. The 2011 outbreak had a higher proportion of cases hospitalised compared with the 2007 outbreak; however, as information on clinical symptoms and/or immunological status of these cases was not available, it is difficult to ascertain if symptoms in one outbreak might be more severe than the other. Molecular genotyping showed that the majority of the 2007 and 2011 cases hospitalised were infected with the C. hominis IbA10G2 subtype. The IbA10G2 has been reported as the most virulent C. hominis subtype, with those infected more likely to present multiple symptoms such as nausea, malaise and vomiting in addition to diarrhoea [Reference Cama47, Reference Li48]. However, due to the small number of hospitalised cases that were typed, a significant correlation between subtypes in each outbreak with symptoms and hospitalisation could not be examined.
For the 2003 outbreak, travel history was only available for a small proportion of cases (1.7%), and hence meaningful comparison with the latter two outbreaks could not be carried out. In the 2007 and 2011 outbreaks, most cases (82–87%) acquired their illness in WA with only 7–11% of cases having acquired their infection overseas. This indicates that local transmission was driving these outbreaks. There have been reports from previous studies of travellers returning from overseas with cryptosporidiosis and subsequently spreading the infection in the community (mainly through swimming pools) [Reference Chalmers49, Reference Lazensky50]. However, the primary cases in these outbreaks were not identified, and although the IbA10G2 subtype was identified in cases with overseas travel history in the 2007 outbreak, no conclusions can be made based on the small number of cases genotyped. Further investigation and genotyping of additional cases with overseas travel history is required, to better understand the importance of overseas travel in local transmission within WA.
Despite not having any information on cases and their contact with animals, it is unlikely that the outbreaks in 2007 and 2011 were of zoonotic origin, as the anthroponotic C. hominis was responsible for the majority of infections in cases during these periods. Between both these outbreaks, only five cases were identified with C. parvum and are likely to be sporadic infections. Although rural living has been linked with C. parvum infection or other zoonotic Cryptosporidium species [Reference Ng51, Reference Lal52], findings from recent studies in Australia suggests that cryptosporidiosis in remote communities, where a majority of Aboriginal people reside, are more likely as a result of human-to-human transmission [Reference Ng-Hublin41, Reference Lal52].
Early detection and rapid response to an increase in Cryptosporidium incidence is essential for outbreak control. Waterborne outbreaks often remain undetected, as there can be a considerable delay before an outbreak is recognised, and are usually more widespread, hindering timely detection and the ability to ascertain a common source or exposure [Reference Hellard11, Reference Dale15]. This would have been the case for the three cryptosporidiosis outbreaks in WA (2003, 2007 and 2011); inundation of cases from multiple possible exposures (i.e. childcare, schools, swimming pools, family members) and competing priorities, which result in insufficient resources to interview every case, are likely to impede timely identification of risk factors and point source outbreaks. As this is a descriptive retrospective study, the cause of the outbreak or mode of transmission in these three outbreaks cannot be established. The seasonal and age-related trends as well as the characteristics of the dominant IbA10G2 subtype detected, do however, suggest that these outbreaks were due to person-to-person transmission, and that undetected waterborne outbreaks [Reference Hellard11, Reference Dale15] may have played a part in the transmission as well as the scale and length of these outbreaks. Although we were not able to obtain and analyse any meteorological data due to time constrains, it would be interesting, for future studies, to compare meteorological data between the three outbreaks, to examine if there were any correlations with the scale of the outbreak, as well as to compare outbreak vs. non-outbreak years to examine if there were any potential correlations between weather patterns and outbreak triggers or persistence of an outbreak.
An improved understanding of the epidemiology, sources and transmission of cryptosporidiosis is needed to develop better control programmes. Additional information on case exposures, subtypes identified from routine molecular genotyping of a larger pool of cases as well as clinical symptoms would certainly provide a more in-depth and robust understanding of the pathogenicity and epidemiology of the Cryptosporidium in each of these WA outbreaks. This would assist in identifying key factors that may be used towards prediction or prevention of further cryptosporidiosis outbreaks in WA. Across Australia, species and subtype data should routinely be incorporated into national surveillance programmes. This can be achieved by increasing molecular diagnostic capabilities of pathology laboratories and standardizing the use across all pathology laboratories or through contracting of laboratories with Cryptosporidium molecular genotyping capabilities for typing of Cryptosporidium-positive faecal samples. Through the facilitation of a web-based database, the availability of Cryptosporidium species and subtype data at the national level would enable epidemiological interpretation of genotype occurrence, distribution trends in both sporadic and outbreak cases, and potentially, lead to earlier outbreak detections.
In conclusion, this study aimed to retrospectively compare and review the three cryptosporidiosis outbreaks that had occurred in WA in 2003, 2007 and 2011 in order to increase the understanding of the transmission dynamics and nature of cryptosporidiosis outbreaks in WA. The analyses indicated that outbreaks in WA are most likely to occur in metropolitan areas, the outbreaks studied were of anthroponotic origins and were associated with the C. hominis IbA10G2 subtype. This subtype has been implicated in numerous waterborne outbreaks, and as the outbreaks coincided with the summer season, when there is usually an increase in water-related recreational activities, the source of these outbreaks may have been waterborne. The present study also highlights that smaller outbreaks may go undetected and that molecular typing could potentially increase the sensitivity of cryptosporidiosis surveillance for sporadic and outbreak cases in WA.