


Ovarian cancer is one of the most common types of cancer occurring in females, accounting for 2·5 % of all malignancies among them. In 2018, 295 414 new cases and 184 799 deaths by ovarian cancer were reported worldwide(Reference Bray, Ferlay and Soerjomataram1). Of all the gynaecological malignancies, this cancer is associated with the worst prognosis(Reference Coburn, Bray and Sherman2). Ovarian cancer in approximately 75 % of the recently confirmed cases has already reached the advanced stage of the disease, with a 5-year survival rate of only 63·8 %(Reference Lee, Kim and Kim3). Thus, identifying modifiable risk factors to guide interventions in preventing ovarian cancer is essential. In addition to confirmed factors such as genetic, hormonal and reproductive factors, a range of modifiable risk factors (e.g. dietary or nutritional factors) have been proposed to play vital roles in the aetiology of this disease(Reference Reid, Permuth and Sellers4).
Dairy products, which are abundant in nutrients such as protein, Ca and vitamins, have been listed as a core part of dietary recommendations globally(Reference Nicklas, O’Neil and Fulgoni5). This is mainly due to their beneficial effects on bone health and potential protection against various diseases such as type 2 diabetes mellitus, CVD (e.g. stroke and CHD) and cancers (e.g. colorectal cancer and bladder cancer)(Reference Bermejo, Lopez-Plaza and Santurino6,Reference Thorning, Raben and Tholstrup7) . Although dairy nutrients, such as Ca and vitamin D, exhibit anti-tumorigenic effects by regulating the risk of multiple cancers and prognosis-relevant pathways, such as tumorigenic pathways in ovarian cancer(Reference Fleet, DeSmet and Johnson8), other nutrient-related factors such as the serum insulin-like growth factor 1 and hormones (e.g. oestrogen and progesterone) in dairy products may increase cancer risk by promoting cell proliferation and inhibiting apoptosis or inducing the malignant transformation of ovarian epithelial cells(Reference Khandwala, McCutcheon and Flyvbjerg9,Reference Coppola, Saunders and Fu10) .
Previous epidemiological studies of the associations between dairy products or their sub-types and ovarian cancer risk have yielded inconsistent results. The Continuous Update Project of 2018 by the World Cancer Research Fund/American Institute for Cancer Research (WCRF/AICR) assessed the effects of diet, nutrition and other factors with ovarian cancer consisted of pooling evidence from 2006 to 2012(11). The evidence indicated null effects of total dairy products, whole milk, cheese, yogurt, lactose, serum vitamin D, and total and dietary Ca, with ovarian cancer risk, which were in line with the results of previous two meta-analyses(Reference Liu, Tang and Sang12,Reference Genkinger, Hunter and Spiegelman13) . However, high dairy products, low-fat milk and lactose intakes have been reported to be associated with increased ovarian cancer risk in a meta-analysis(Reference Larsson, Orsini and Wolk14), and the protective effect of Ca had been reported in other meta-analysis(Reference Song, Li and Ji15). The relatively small number of included studies by two meta-analyses(Reference Genkinger, Hunter and Spiegelman13,Reference Larsson, Orsini and Wolk14) published in 2006 might restrain their statistical power. In addition, in the meta-analysis by Liu et al. (Reference Liu, Tang and Sang12), the data for low-fat milk and skimmed milk were mixed together, which might ignore the potential role of the remaining dairy fat components in low-fat milk. Furthermore, a systematic review(Reference Cook, Neilson and Lorenzetti16) showed inconclusive results regarding the relationship between vitamin D and ovarian cancer. Previous meta-analyses also seldom further assessed whether the observed relationship between increasing (or decreasing) levels of dairy products or Ca and the ovarian cancer risk follows a linear dose–response pattern.
Thus, we conducted an updated meta-analysis to explore the relationships between the intakes of different types of dairy products, Ca and vitamin D, as well as circulating vitamin D, with ovarian cancer risk. We further assessed whether there were dose–response relationships among these associations.
Methods
Search strategy
For studies investigating the associations between dairy products, dietary or circulating Ca and vitamin D with ovarian cancer risk, initial works of literature were systematically searched in PubMed, Embase, Web of Science, Cochrane Library and ClinicalTrial.gov in 7 July 2018 and updated in 24 December 2019. No restrictions for language and time of publish were imposed. Moreover, the reference lists from recovered articles and published meta-analyses or systematic reviews were subjected to manual searches to identify relevant studies further. Full texts of potentially applicable investigations were obtained, whereas abstracts, meeting proceedings, gray literature, unpublished results and personal communications were excluded. Details of the searching strategy are shown in the online Supplementary Materials.
Study selection
Studies were eligible for inclusion if they (1) applied a case–control and cohort studies, or clinical trial design and were published as original studies; (2) assessed at least one of the following exposures or interventions: dairy products, Ca or vitamin D; (3) used ovarian cancer as an outcome and (4) provided at least two groups of relative risks (RR) or OR and 95 % CI across different categories or could estimate these data by number of cancer cases and population at risk (or controls). To avoid overlap between study populations, we included studies with the largest sample size when studies on the same topic were performed among the same populations. As several studies lacked detailed information on the weight of the average dietary intake, we calculated the approximate estimates based on the frequency of intake and on the algorithms that assigned a nutrient score to each food item (online Supplementary Table S1). The nutrient score was evaluated using data derived by the United States Department of Agriculture (http://ndb.nal.usda.gov/ndb/search/list).
Data extraction
The titles and abstracts of the initially retrieved articles were independently screened by two investigators (L. M. Q. and G. X. P.). Disagreements between the two authors will be solved through discussion with the corresponding author (Z. F. F.) to reach a consensus. The following data from each eligible study were extracted: the first author, publication year, country of the study, study name, study design, characteristics of the study population, follow-up period, sample size, race, age, number of cases, diet assessment methods, type of dairy products, vitamin D and Ca sources, quantity of intake, maximally adjusted OR or RR with 95 % CI and adjusted covariates.
Quality assessment
The Newcastle–Ottawa Scale (NOS) was used to assess the quality of the included original studies with a case–control or cohort study design(Reference Stang17). For case–control studies, the three main quality parameters assessed by the NOS are the qualities of selection (four items), comparability (one item) and exposure (three items). For cohort studies, they are the qualities of selection (four items), comparability (one item) and outcome (three items). Each item in the ‘selection’ and ‘exposure/outcome’ parameters can obtain 0 or 1 star, whereas those in the ‘comparability’ parameter can receive 0–2 stars, and one star equals 1 point. The total score for both study design ranges from 0 to 9, with a higher score indicating higher methodological quality. The same two authors assessed the study quality. Disagreements between authors were resolved by discussion, as well as consulting with the corresponding authors (Z. F. F.).
Statistical analysis
For this meta-analysis, because the incidence of ovarian cancer was low, we assumed that the estimates of OR from case–control studies were good approximations of RR from cohort studies and both were validly combined as the estimates of RR(Reference Greenland18). The random effects model was chosen a priori for the estimations of pooled RR and 95 % CI as it is considered as more conservative than the fixed effects model when within- and between-study heterogeneities are anticipated(Reference Riley, Higgins and Deeks19).
The maximally adjusted RR, comparing the highest intake category with the lowest intake category (the reference group), were combined to generate the summary associations. One study(Reference Zheng, Danforth and Tworoger20) used a different reference group rather than the lowest one, so an excel macro file was used to transform this reference group(Reference Hamling, Lee and Weitkunat21). Cochran’s Q test and Higgins I 2 values were used to assess the heterogeneity between studies (I 2 > 50 % or P for heterogeneity <0·05 indicated significant heterogeneity)(Reference Higgins and Thompson22).
For dose–response meta-analysis, the methods proposed by Greenland & Longnecker(Reference Greenland and Longnecker23) and Orsini et al.(Reference Orsini, Bellocco and Greenland24) were used to compute study-specific slopes, which were obtained by correlating the natural logarithm of the RR across exposure categories and estimate the dose–response associations. For those included in the dose–response analyses, studies should provide the mean or median value as cut-off for each category, the number of cases, the number of controls (case–control and cohort) or person-years (cohort only) and the estimated risks for at least three quantitative categories(Reference Chen, Qin and Ye25). The median level of intake or circulating concentration for each category was assigned to each corresponding RR. For eighteen studies that did not provide the median or mean value for each category, the median was estimated using the midpoint of the lower and upper limits and we considered that the highest/lowest category had the same intake or concentration range as the adjacent category when the highest/lowest category was open-ended(Reference Ding, Bhupathiraju and Satija26,Reference Wang, Ouyang and Liu27) .
Subgroup and meta-regression analyses were performed to investigate potential sources of between-study heterogeneity. Subgroup analyses were performed according to the publication year (<2009 v. ≥2009), study design (case–control study v. cohort study), age (<55 v. ≥55 years) and NOS score (<7 v. ≥7 points). When the P value for the covariate interaction terms was <0·05, the statistical significance was inferred for the subgroup effect. Meta-regression analyses were also performed to assess the covariates that may affect between-study heterogeneity. Influence analysis was performed by recalculating the pooled estimates for each dairy product category or nutrient after omitting one study with an extreme result at a time to validate the robustness of the findings. Publication bias for analyses with ten or more included studies was detected using Egger’s and Begg’s linear regression asymmetry tests and was visualised using the funnel plot(Reference Egger, Davey Smith and Schneider28). All of the data were analysed using the Stata software (version 11.0, StataCorp LP). A two-sided P < 0·05 was considered statistically significant.
Results
A total of 5583 records were identified in the initial search, and 895 were removed due to duplicate publications. A further 4688 and fifty-one articles were excluded after a title, abstract review and full-text review. Of the remaining seventy-six potentially eligible articles, twenty-six were further excluded for duplicate data sets and twenty-one for insufficient data. To ensure that the meta-analysis was based on up-to-date results, we updated the literature search on 24 December 2019, but no eligible article was included (Fig. 1; online Supplementary Table S2). Finally, twenty-nine studies, including eighteen case–control studies (9443 cases and 19 650 controls) and eleven cohort/nested case–control studies (934 511 participants and 3500 cases), were included in our analysis (Fig. 1). Of these twenty-nine studies, twenty-three(Reference La Vecchia, Decarli and Negri29–Reference Chang, Lee and Canchola51) evaluated the associations between ovarian cancer and dairy products/lactose, thirteen(Reference Goodman, Wu and Tung36,Reference Salazar-Martinez, Lazcano-Ponce and Lira-Lira37,Reference Pan, Ugnat and Mao40,Reference Park, Leitzmann and Subar42–Reference Merritt, Cramer and Vitonis44,Reference Qin, Moorman and Alberg46,Reference Kushi, Mink and Folsom47,Reference Koralek, Bertone-Johnson and Leitzmann49,Reference Chang, Lee and Canchola51–Reference Merritt, Poole and Hankinson54) assessed Ca and ten(Reference Zheng, Danforth and Tworoger20,Reference Bosetti, Negri and Franceschi35,Reference Qin, Moorman and Alberg46,Reference Kushi, Mink and Folsom47,Reference Koralek, Bertone-Johnson and Leitzmann49,Reference Chang, Lee and Canchola51–Reference Toriola, Surcel and Calypse53,Reference Cramer, Kuper and Harlow55,Reference Tworoger, Lee and Buring56) focused on vitamin D.
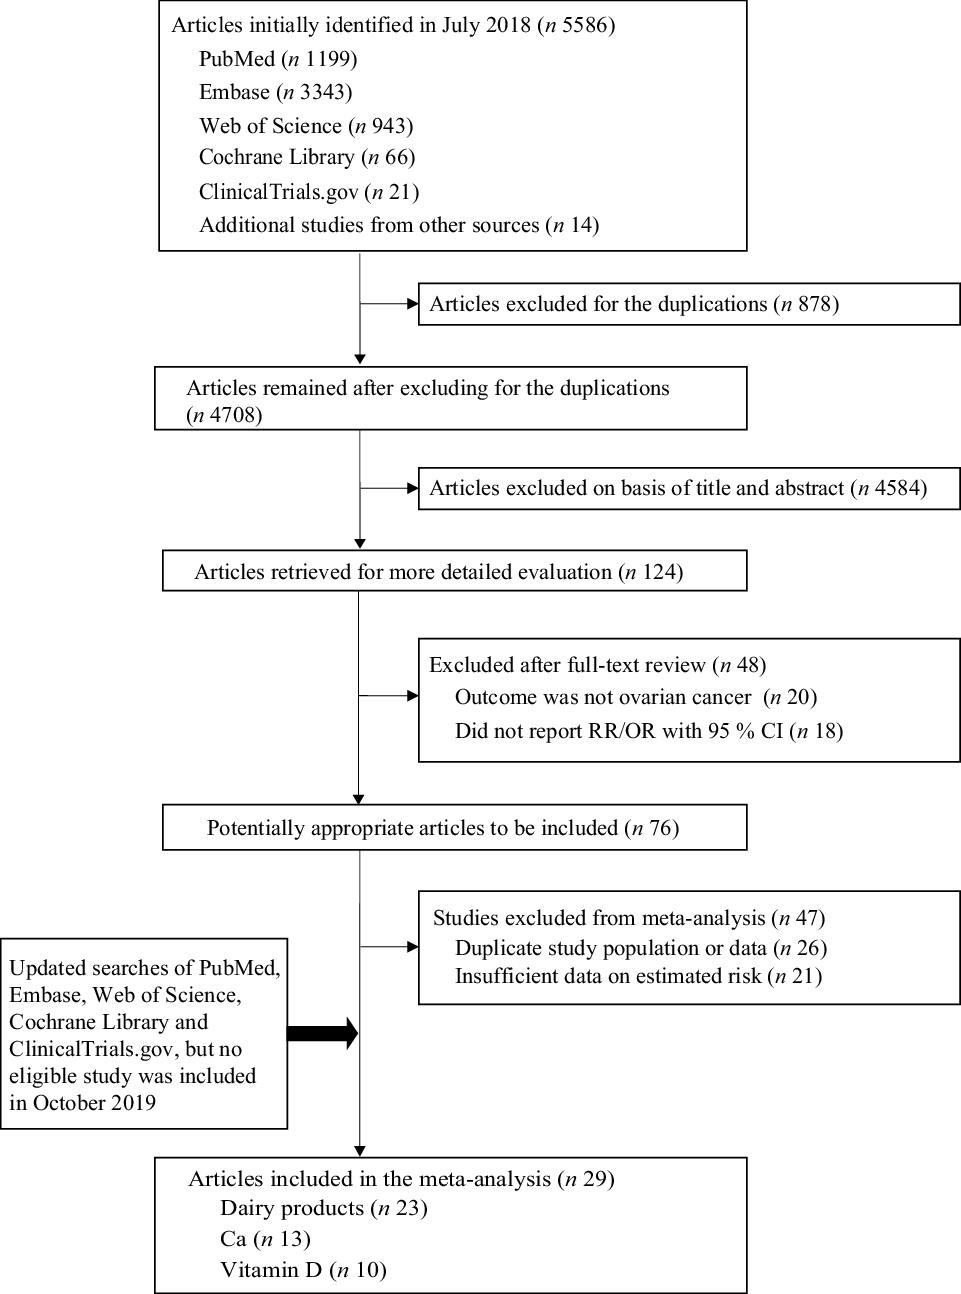
Fig. 1. Flow chart of the study selection. RR, relative risk.
The details of the included studies are summarised in Table 1 and online Supplementary Table S3. Overall, nineteen studies involved Caucasian populations, one involved an Asian population, one involved a Black population and eight involved mixed populations. The means for age ranged from 29·9 to 65·0 years in case–control studies and from 42·5 to 62·0 years in cohort studies. Dietary intake or circulating levels were estimated using a validated FFQ in twenty studies, using some single or multiple standard questionnaires in six studies and using specialised assays (25-hydroxyvitamin D (25(OH)D) RIA and DiaSorin LIAISON vitamin D TOTAL assay) in three studies. The NOS scores of all the included studies were ≥4, and nineteen of these studies scored ≥7 (online Supplementary Tables S4 and S5).
Table 1. Main characteristics of the eligible studies included in the meta-analysis

A1, dairy products; A2, lactose; B1, total Ca; B2, dietary Ca; B3, supplemental Ca; B4, other Ca; C1, total vitamin D; C2, dietary vitamin D; C3, circulating vitamin D; C4, supplemental vitamin D; Mixed, mixed populations of Caucasian, Black, Asian and other populations; NA, not available; NOS, Newcastle–Ottawa Scale.
* Follow-up period duration (months).
† Person-years.
Dairy products
In comparative analyses between the highest and lowest intake, a null association was observed between the consumption of total dairy products and ovarian cancer risk and the RR and its 95 % CI were 1·10 (95 % CI 0·95, 1·28; P = 0·203) with moderate heterogeneity (I 2 = 52·3 %) (Table 2; Fig. 2). A comparison between specific type of dairy products revealed that women with a higher intake of whole milk had an increased ovarian cancer risk (RR 1·35, 95 % CI 1·15, 1·59; P < 0·001), whereas those with a higher intake of low-fat milk had a decreased risk (RR 0·84, 95 % CI 0·73, 0·96; P = 0·013). No evident association was found for skimmed milk, yogurt, cheese or lactose (P range: 0·203–0·993) (Table 2; online Supplementary Figs. S1 and S2).
Table 2. Estimates comparing highest v. lowest group for ovarian cancer risk under different exposure models
(Relative risks (RR) and 95 % confidence intervals)

I 2, variation in estimated attributable to heterogeneity.
* P value of Z test for the significance of the pool RR and 95 % CI.
† P value of Q test for between-study heterogeneity test.
‡ Analyses of circulating vitamin D were based on three nested case–control studies.

Fig. 2. Forest plots of associations between total dairy products intake and the risk of ovarian cancer; error bars indicate 95 % CI. Weights are from random effects analysis. RR, relative risk.
In dose–response analyses, significantly increased ovarian cancer risk was observed for 100 g/d increments in total dairy product (RR 1·03, 95 % CI 1·01, 1·04; P = 0·004) and in whole milk (RR 1·07, 95 % CI 1·03, 1·11; P < 0·001) (Table 3; Fig. 3). In contrast, decreased risk was observed for 100 g/d increments in low-fat milk (RR 0·95, 95 % CI 0·91, 0·99; P = 0·007) and cheese intakes (RR 0·87, 95 % CI 0·76, 0·98; P = 0·025) (Table 3; Fig. 3; online Supplementary Fig. 3).
Table 3. Dose–response relationships between intakes of different exposures and the risk of ovarian cancer (for each 100 g/d increment)
(Relative risks (RR) and 95 % confidence intervals)
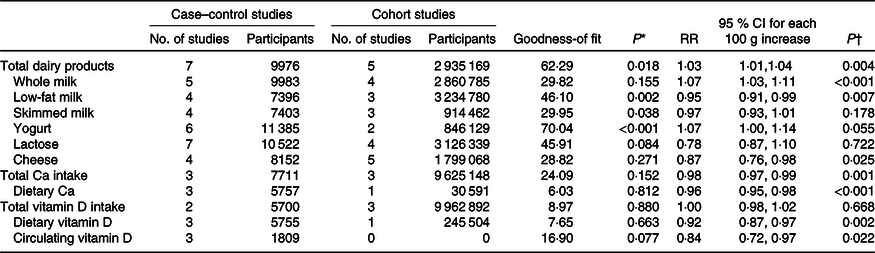
* P value of the test of goodness-of fitness.
† P value of the RR and 95 % CI of 100 g/d increment.

Fig. 3. Dose–response relationships between intakes of total dairy products (a), whole milk (b), low-fat milk (c), as well as cheese (d), and the risk of ovarian cancer. RR, relative risk. (a–d) ![]() Linear model;
Linear model; ![]() 95 % confidence interval.
95 % confidence interval.
No significant association was found for skimmed milk, yogurt or lactose in either of the two models (P values for highest v. lowest intake: 0·792, 0·568 and 0·852; P for 100 g/d increments: 0·178, 0·055 and 0·722) (Tables 2 and 3).
Total, dietary and circulating calcium and vitamin D
As some studies not specify if the total Ca/vitamin D intakes were calculated from food or supplement sources, ‘total Ca’ and ‘total vitamin D’ in the present study referred to the combined intakes from both sources. The cut-off values of the highest categories ranged from 1127·0 to 1596·0 mg/d for total Ca and 859·3 to 1025·0 mg/d for dietary Ca. Compared with the lowest intake group, participants in the highest dietary Ca intake group exhibited a significantly decreased ovarian cancer risk (RR 0·71, 95 % CI 0·60, 0·84; P < 0·001) (Table 2; online Supplementary Fig. S4). Supplemental Ca intake was associated with only marginally decreased ovarian cancer risk (RR 0·81, 95 % CI 0·65, 1·01; P = 0·062), whereas null association was observed between total Ca intake and the ovarian cancer risk (RR 0·85; P = 0·253) (Table 2). In addition, dietary vitamin D intake was found to be negatively associated with ovarian cancer risk (RR 0·80, 95 % CI 0·67, 0·95; P = 0·011) (Table 2). However, pooling of all studies yielded no significant finding for total or circulating vitamin D (both P > 0·05) (Table 2; online Supplementary Fig. S5).
For dose–response associations, we found that significantly decreased ovarian cancer risks were related with 100 g/d increments in dietary Ca (RR 0·96, 95 % CI 0·95, 0·98), total Ca (RR 0·98, 95 % CI 0·97, 0·99), dietary vitamin D (RR 0·92, 95 % CI 0·87, 0·97) and circulating vitamin D (RR 0·84, 95 % CI 0·72, 0·97) (all P values < 0·05) (Table 3; Fig. 4).

Fig. 4. Dose–response relationship between intakes of dietary calcium (a), total calcium (b), dietary vitamin D (c), as well as circulating vitamin D concentration (d), and the risk of ovarian cancer. RR, relative risk. (a–d) ![]() Linear model;
Linear model; ![]() 95 % confidence interval.
95 % confidence interval.
Subgroup and meta-regression analyses
The pooled results on lactose were contradictory between elder and younger women (RR 0·84 v. 1·25; P for interaction: 0·040) (online Supplementary Table S12). However, no significant interaction was observed after stratifying by publication year, study design, age and NOS scores (all P for interaction > 0·05) (online Supplementary Tables S6–S11, S13–S15). Additionally, we did not analyse case–control and cohort studies separately, but we have performed exploratory subgroup analyses by study design (case–control study v. cohort study) and found no evidence of effect modification or significant effects on ovarian cancer within subgroups by study design (all P for interaction values > 0·05 in each stratified analysis).
Publication year, study design, age and NOS scores were also investigated as potential moderators using meta-regression analysis. The results demonstrated that the NOS scores might contribute to the heterogeneity in the results of whole milk as the included low-quality studies tended to report higher risk (P: 0·003), and the result was further demonstrated by meta-regression analysis (P: 0·025) (online Supplementary Tables S7 and S17).
In the influence analysis in which one study with maximal or minimal OR/RR was excluded at a time, the summary estimates were not substantially affected by most of the exposures (online Supplementary Table S18).
Publication bias
Neither Egger’s nor Begg’s test revealed a significant publication bias for any combined analysis (P values ranged from 0·08 to 0·97 for Egger’s test and from 0·07 to 1·00 for Begg’s test) (online Supplemental Table S19). The funnel plots also indicated no evidence of publication bias (online Supplementary Figs. S6–S9).
Discussion
In this meta-analysis, we obtained summary evidence that consumption of whole milk was positively associated with ovarian cancer risk, whereas consuming large amounts of low-fat milk, dietary Ca and dietary vitamin D were negatively associated with ovarian cancer risk. Dose–response analyses revealed that ovarian cancer risk increased with the higher intakes of total dairy products and whole milk but decreased with the higher intakes of low-fat milk, cheese, total/dietary Ca and dietary/circulating vitamin D. Notably, the positive association between whole milk and ovarian cancer risk and negative association between low-fat milk, skimmed milk, dietary Ca and dietary vitamin D and ovarian cancer risk were observed in both models.
The WCRF/AICR project 2018, which analysed the effects of diet, nutrition and other factors on ovarian cancer risk, reported the absence of a significant linear association between total dairy products and ovarian cancer risk (pooled RR 1·06, 95 % CI 0·92, 1·23, I 2:66·1 %). This finding is inconsistent with the finding of our dose–response analysis that a higher intake of total dairy products is positively associated with ovarian cancer risk. Different inclusion criteria and number of studies included could explain the difference in the findings between the WCRF/AICR project and ours. The WCRF/AICR project 2018 included five cohort studies for dairy products, while our study included twelve studies on total dairy products for dose–response analysis, some of these articles were published recently(Reference Kiani, Knutsen and Singh41,Reference Park, Leitzmann and Subar42,Reference Kushi, Mink and Folsom47–Reference Chang, Lee and Canchola51,Reference Tworoger, Lee and Buring56,Reference Arslan, Clendenen and Koenig57) . Furthermore, aside from the food categories analysed by WCRF/AICR project, we further explored the effects of low-fat milk, skimmed milk and total/dietary vitamin D on ovarian cancer risk.
The WCRF/AICR project 2018(11) revealed no significant association between whole milk intake and ovarian cancer risk. However, compared with the nine studies on whole milk included in our study, only three cohort studies were included in the WCRF/AICR project 2018; thus, the null association in the latter project may have been due to the small number of publications examined, which provided insufficient statistical power to detect an association. Null associations were reported for whole milk, low-fat milk or skimmed milk in two meta-analyses(Reference Larsson, Orsini and Wolk14,Reference Qin, Xu and Wang58) ; however, these studies generally included fewer studies than our study did and all of these studies were published 10 years ago. In contrast, a meta-analysis by Liu et al. in 2015(Reference Liu, Tang and Sang12) that compared the highest v. lowest intake indicated that whole milk intake was associated with 23 % (3–46 %) increased risk of ovarian cancer, but this meta-analysis found null association for low-fat/skimmed milk (RR 0·93, 95 % CI 0·79, 1·09). Their results are in line with our findings linking whole milk intake with ovarian cancer risk but inconsistent with the protective effect of low-fat milk against ovarian cancer. This discrepancy may be due to the differences in the classification of low-fat/skimmed milk between the study by Liu et al. (Reference Liu, Tang and Sang12) and our study. Liu et al. (Reference Liu, Tang and Sang12) combined these two types of milk to explore the contribution of dairy fat to ovarian cancer, whereas in our study, low-fat milk and skimmed milk were considered separately, with low-fat (1 %) and reduced-fat (2 %) milk combined as ‘low-fat milk’. There are some possible explanations for the contradictory results between whole fat milk and low-fat milk/skimmed milk in our meta-analysis. First of all, the fat component, which was lower in low-fat milk than in whole milk, might play a vital role in the aetiology of ovarian cancer(Reference Cramer, Welch and Hutchison59). Consistent with this finding, there was a recent meta-analysis of twenty-five epidemiological studies that reported a high intake of the fat component might be related to increased ovarian cancer risk(Reference Qiu, Lu and Qi60). Second, the increased risk from whole milk may be attributable to the fat-soluble hormones in the dairy fat produced from pregnant cows, as indicated by a high correlation coefficient between milk and ovarian cancer (spearman correlation coefficient r 0·78) found in one study owing to the elevated concentrations of oestrogen and progesterone in the milk(Reference Ganmaa and Sato61). Furthermore, fat components and fat-soluble hormones in whole milk may be positively associated with an increase in the insulin-like growth factor 1 level(Reference Qin, He and Xu62), which is implicated in many malignancies such as ovarian cancer. Insulin-like growth factor 1 receptor overexpression is known to increase cell proliferation and inhibit apoptosis or induce the malignant transformation of ovarian epithelial cells(Reference Khandwala, McCutcheon and Flyvbjerg9,Reference Coppola, Saunders and Fu10) .
Nonetheless, we did not find significant protective effects of skimmed milk against ovarian cancer in either of the two models. Some studies have indicated that since the fat component is wholly extracted from the skimmed milk, the difference of ovarian cancer risk between skimmed milk and low-fat milk may be partly ascribed to the much lower levels of fat-soluble vitamins and minerals in skimmed milk than in low-fat milk as these nutrients play a vital role in the risk of oestrogen-associated cancer(Reference Song, Li and Ji15,Reference Yin, Grandi and Raum63) . In addition, the specific definitions of skimmed milk and low-fat milk could vary across studies; therefore, the differences observed in our study, as well as in previous studies, between skimmed milk and low-fat milk might be partly ascribed to the varieties in definitions and misclassifications of these two kinds of milk.
In the dose–response analysis, we observed that every 100 g/d increase in cheese intake might be near-linearly associated with a 13 % decrease in ovarian cancer risk. However, we found no evidence suggesting an inverse association between cheese intake and the ovarian cancer risk in the comparison between the highest and lowest intake groups, and similar findings were also reported by WCRF/AICR project 2018(11) and Genkinger et al.(Reference Genkinger, Hunter and Spiegelman13). This discrepancy may be explained by the high heterogeneity of studies in the highest v. lowest intake group comparison in our meta-analysis, which could be partly attributable to the use of varying definitions of cheese between studies. In addition, the differences in study selection between the two models might have led to inconsistent findings. Only those studies offering at least three groups of OR/RR and their 95 % CI across different categories were included in the dose–response analysis, but only two groups of OR/RR and their 95 % CI in the extreme intake groups were needed in the highest v. lowest intake group comparison. The biological mechanism also suggested that the potential protective effects of cheese against ovarian cancer may be ascribed to the presence of inhibitors of desaturases (D9-desaturase and D5-desaturase) in cheese, which is known to inhibit TAG synthesis by fatty acid desaturases and then reduce the pathogenic effects of fat(Reference Hostmark and Lunde64). Additionally, cheese is nutritious and contains live micro-organisms serving as probiotics(Reference Marco, Heeney and Binda65), which have been reported to reduce pathological alterations, stimulate the mucosal immunity, interact with inflammatory mediators to enhance the immune system(Reference Vinusha, Deepika and Johnson66) and even decrease the overall cancer risk(Reference Zhang, Dai and Liang67). Further studies with a larger sample size of a cheese-eating population are needed to confirm our results and explore the relation between cheese and ovarian cancer risk.
We found evidence suggesting a decreased risk of ovarian cancer with a higher dietary intake of Ca or vitamin D. Our finding regarding dietary Ca was consistent with that of a previous meta-analysis that found a pooled RR of 0·80 (95 % CI 0·66, 0·98) for dietary Ca intake in the highest v. lowest intake comparison(Reference Song, Li and Ji15). Nonetheless, null linear associations between total Ca (foods and supplements) and dietary Ca with ovarian cancer risk were reported by the WCRF/AICR project 2018. Only three cohort studies were combined in this project for the dose–response analyses for the two Ca (Park(Reference Park, Leitzmann and Subar42), Chang(Reference Chang, Lee and Canchola51) and Koralek(Reference Koralek, Bertone-Johnson and Leitzmann49) for total Ca, and Kushi(Reference Kushi, Mink and Folsom47), Park, 2009(Reference Park, Leitzmann and Subar42) and Koralek(Reference Koralek, Bertone-Johnson and Leitzmann49) for dietary Ca); the relatively insufficient sample size could have reduced the statistical power of the analyses, indicating a possible underestimation of the associations of total and dietary Ca with ovarian cancer. Ca might decrease ovarian cancer by reducing the level of circulating parathyroid hormone, a tumour promoter acting as a co-mitogen and anti-apoptotic factor(Reference McCarty68). This decrease has been reported to further reduce the hepatic and osteoblastic synthesis of insulin-like growth factor 1 (Reference Coxam, Davicco and Durand69), consequently attenuating the promotion of cell proliferation and inhibition of apoptosis(Reference Khandwala, McCutcheon and Flyvbjerg9,Reference Coppola, Saunders and Fu10) . Vitamin D is a fat-soluble prohormone known for regulating genomic and nongenomic signal transduction pathways by its anti-tumorigenic activities, and it also plays a vital role in maintaining Ca homoeostasis by mediating cellular proliferation and metabolism(Reference Guo, Guo and Xie70). The intestinal absorption of Ca is facilitated by vitamin D and has the same signalling pathways for the vitamin D receptor and Ca receptor(Reference Peterlik, Grant and Cross71). Moreover, Ca prolongs the half-life of vitamin D, and the consequent vitamin D receptor activation, in turn, stimulates Ca transportation(Reference Lips72) that might explain the inconsistent results of total and dietary Ca. Finally, dietary vitamin D, mainly from dairy products, plant leaves, plant roots and marine fish, can be used by our bodies only after being metabolised by the liver into 25-hydroxyvitamin D, the major circulating metabolite and indicator of vitamin D(Reference Subramanian and Gernand73). Notably, exposure to sunlight and UVB radiation is known to stimulate the synthesis of 25-hydroxyvitamin D in the skin, which then facilitates Ca absorption(Reference Hochberg and Hochberg74). This may lead to discrepancies between dietary and circulating vitamin D, total and dietary vitamin D.
Subgroup analyses have suggested that age can affect the association between lactose and ovarian cancer risk. The exact mechanism is still unclear. The ingested lactose would be converted into glucose and galactose by intestinal enzymes(Reference Liu, Hale and Hughes75). Due to ageing, the enzymes activity in older women might be lower than that in younger women. The relative abundance of galactose-metabolising enzymes in ovarian tissue has been reported to play a key role in maintaining the healthy ovarian function(Reference Xu, Ng and Kaufman76). Of note, the galactose-1-phosphate uridyltransferase is a crucial enzyme involved in lactose metabolism, and women with less galactose-1-phosphate uridyltransferase activity might have a higher ovarian cancer risk(Reference Cramer, Harlow and Willett77). The reduced galactose-1-phosphate uridyltransferase activity has been found to be associated with the accumulation of galactose-1-phosphate, a toxic metabolite that might be associated with the premature ovarian failure(Reference Kaufman, Kogut and Donnell78) and might be the risk factor for ovarian cancer(Reference Cramer79). This finding may partly explain that the association of lactose with ovarian cancer risk was more evident among older women.
Our study has some limitations. First, although we systematically searched three authoritative databases and two clinical trial databases, some relevant studies might have been missed for unavoidable reasons, which could have affected the analysis. Second, most of the included studies were case–control studies; thus, the potential influence of recall bias, residual confounders and differential participation rates cannot be ruled out. Third, because the sample size scarcely decreased after separating the two study types in several exposure groups, the still limited number of studies might have resulted in a small sample size and low statistical power. We did not analyse the case–control and cohort studies separately. However, no significant result was identified in the stratified analyses or the meta-regression analyses according to the study design. Fourth, for dose–response analyses, we assumed linearity, but did not test for it and potential nonlinear dose–response trends might exist. Fifth, the various instruments used to measure dietary intake level and the varying definitions of the factors of interest such as low-fat milk, skimmed milk and cheese across studies might have generated potential unmeasured confounders. Sixth, the self-reported dietary assessment or the FFQ used in some studies might be prone to measurement errors due to factors such as under- or over-reporting as well as incompleteness of the food composition database. Seventh, since most of the included studies were performed among Caucasian populations, it is unclear whether our findings could be generalised to populations of different races. Finally, the NOS score, ranging from 4 to 8 points, was confirmed to be the source of heterogeneity for whole milk results in the meta-regression analysis, suggesting that the differences between high- and low-quality studies might affect the reliability of the results from different studies.
In conclusion, we found that a high intake of whole milk is significantly associated with an elevated risk of ovarian cancer, whereas higher intakes of low-fat milk, dietary Ca and dietary vitamin D are associated with reduced ovarian cancer risk. Furthermore, every 100 g/d increase in total dairy product consumption was found to be associated with increased ovarian cancer risk; however, inverse linear dose–response associations with ovarian cancer risk were observed for all cheese intake, total Ca intake and circulating vitamin D levels.
Acknowledgements
This work was supported in part by the National Natural Science Foundation of China (grant no. 81602853).
The authors’ responsibilities were as follows: F. F. Z and Z. C. Y.: study concept and design; M. Q. L., X. P. G. and X. X. Y.: completed the literature search and data extraction; M. Q. L and X. P. G.: performed the statistical analyses; M. Q. L. and X. P. G.: drafted the manuscript; N. N. and J. T.: assisted in the revision of the manuscript.
None of the authors reported a conflict of interest related to the study.
Supplementary material
For supplementary materials referred to in this article, please visit https://doi.org/10.1017/S0007114520001075


