


Introduction
Correlated light and electron microscopy (CLEM) provides its users both the specificity of fluorescence microscopy (FM) and the resolution of electron microscopy (EM), and has now become an established technique with many variations (Muller-Reichert & Verkade, Reference Muller-Reichert and Verkade2017). Early applications typically involved room-temperature light microscopy on unfixed samples to observe event progression, quickly followed by resin embedding and evaluation of the sample by EM (Bright et al., Reference Bright, Gratian and Luzio2005). More recently, samples have often been chemically fixed or frozen prior to visualization by light microscopy. Room-temperature applications tolerate better fluorescence optics but limit EM to resin-embedded samples; conversely, cryo-temperature applications allow the full power of cryo-EM but at the expense of the numerical aperture of the fluorescence objective (Kaufmann et al., Reference Kaufmann, Hagen and Grünewald2014). CLEM has been widely applied to study membrane remodeling and virus–host cell interactions (Kopek et al., Reference Kopek, Shtengel, Xu, Clayton and Hess2012; Kukulski et al., Reference Kukulski, Schorb, Kaksonen and Briggs2012a; Lebrun et al., Reference Lebrun, Thelen, Thiry, Riva, Ote, Condé, Vandevenne, Di Valentin, Bontems and Sadzot-Delvaux2014; Li et al., Reference Li, Sewald, Jin, Sherer and Mothes2014; Martinez et al., Reference Martinez, Snapp, Perumal, Macaluso and Kielian2014; Romero-Brey et al., Reference Romero-Brey, Berger, Kallis, Kolovou, Paul, Lohmann and Bartenschlager2015; Bykov et al., Reference Bykov, Cortese, Briggs and Bartenschlager2016). In these cases, the object of interest is too small or rare to be easily found without relying on FM, while the structure is smaller than the point spread function of the light microscope and must therefore rely on EM for its characterization.
Despite its optical drawbacks, interest and applications for cryo-fluorescence microscopy (cryo-FM) are growing due to its potential to correlate with cryo-EM; the advantages of vitrification as a means of rapid, chemical-free sample fixation; and the possibility of reduced photobleaching at low temperatures (Sartori et al., Reference Sartori, Gatz, Beck, Rigort, Baumeister and Plitzko2007; Schwartz et al., Reference Schwartz, Sarbash, Ataullakhanov, McIntosh and Nicastro2007; Wolff et al., Reference Wolff, Hagen, Grünewald and Kaufmann2016). One area where cryo-fluorescence is still lacking is the expansion to applications that draw on unique dye photophysics such as Förster resonance energy transfer and stochastic photobleaching. Such approaches are rarely used at cryo-temperatures due to optical limitations and potential temperature dependence in the behavior of the dyes. This has functionally limited cryo-CLEM to being a method for targeting a fluorophore-tagged molecule for cryo-EM imaging.
During a reaction or process in which no protein is added or lost, localization-based methods will not give a distinguishable signal change in cryo-CLEM. Such processes include lipid membrane events such as fusion and fission. In a process like endocytosis, individual proteins can be tagged to organize images in time (Kukulski et al., Reference Kukulski, Schorb, Kaksonen and Briggs2012a). In contrast, fluorescence co-localization of two fluorophores in apposing membranes cannot be used to determine whether two membranes in tight apposition are exchanging lipids or not, or exactly when a hemifusion stalk becomes a fusion pore. In such cases a chemical reporter is necessary to define the point at which reactions begin (Blumenthal et al., Reference Blumenthal, Gallo, Viard, Raviv and Puri2002; Floyd et al., Reference Floyd, Ragains, Skehel, Harrison and van Oijen2008; Kreye et al., Reference Kreye, Malsam and Söllner2008).
In this study, we have adapted a standard lipid-mixing assay to cryo-CLEM, employing an application of autoquenching based on resonant energy transfer (RET). By doing so, we apply cryo-CLEM to localize a functional event rather than a protein, drawing upon the expanded fluorophore uses that have been mostly neglected in cryo-CLEM applications. We use the model system of influenza virus fusion, which has been well-studied separately by fluorescence kinetics (Floyd et al., Reference Floyd, Ragains, Skehel, Harrison and van Oijen2008) and cryo-EM and tomography (Chlanda et al., Reference Chlanda, Mekhedov, Waters, Schwartz, Fischer, Ryham, Cohen, Blank and Zimmerberg2016; Gui et al., Reference Gui, Ebner, Mileant, Williams and Lee2016). The use of a cryo-fluorescence signal to localize a function allows distinction between apposition (lipid unmixed) and hemifusion or fusion (lipid mixed), allowing targeted imaging of fusion events and permitting more accurate assignment of micrographs to their appropriate functional state.
Materials and Methods
Fluorophore Stock Preparation
Octadecyl Rhodamine B chloride (R18, Thermo Fisher Scientific, Eugene, OR, USA) was solubilized in 100% ethanol at roughly 10 mg/mL and stored at −80°C in glass vials sealed with Teflon tape for up to 1 month. DiIC18(5) solid (DiD, 1,1′-dioctadecyl-3,3,3′,3′-tetramethylindodicarbocyanine, 4-chlorobenzenesulfonate salt, Thermo Fisher Scientific) was solubilized in 100% ethanol at roughly 5 mM and stored at −20°C in glass vials sealed with Teflon tape. The exact concentration was determined by measuring absorbance in methanol (1 µL stock in 1.5 mL methanol), using the manufacturer's extinction coefficient under these conditions.
Vesicle Preparation
POPC Vesicles
1-Palmitoyl-2-oleoyl-sn-glycero-3-phosphocholine (Avanti Lipids) was dissolved in chloroform at 1 mg/mL concentration, then dried into a thin film in a round-bottom flask by evaporation using nitrogen gas (Figs. 1, 2). This thin film rested overnight in a room-temperature desiccator. Following evaporation, the POPC film was incubated in TNE buffer (50 mM Tris-HCL pH 7.4, 100 mM NaCl, 0.1 mM EDTA) for 30 min at 4°C, then subjected to seven cycles of freeze/thaw by alternating baths in an acetone/dry ice mixture and warm water. The resulting lipid mixture was extruded for 21 passes through a membrane with a pore size 50–200 nm depending on the experiment (Avanti Polar Lipids Inc., Alabaster, Alabama, USA). Average vesicle size and quality were confirmed by dynamic light scattering (DLS; Zetasizer, Malvern Panalytical Gmbh, Kassel, Germany).

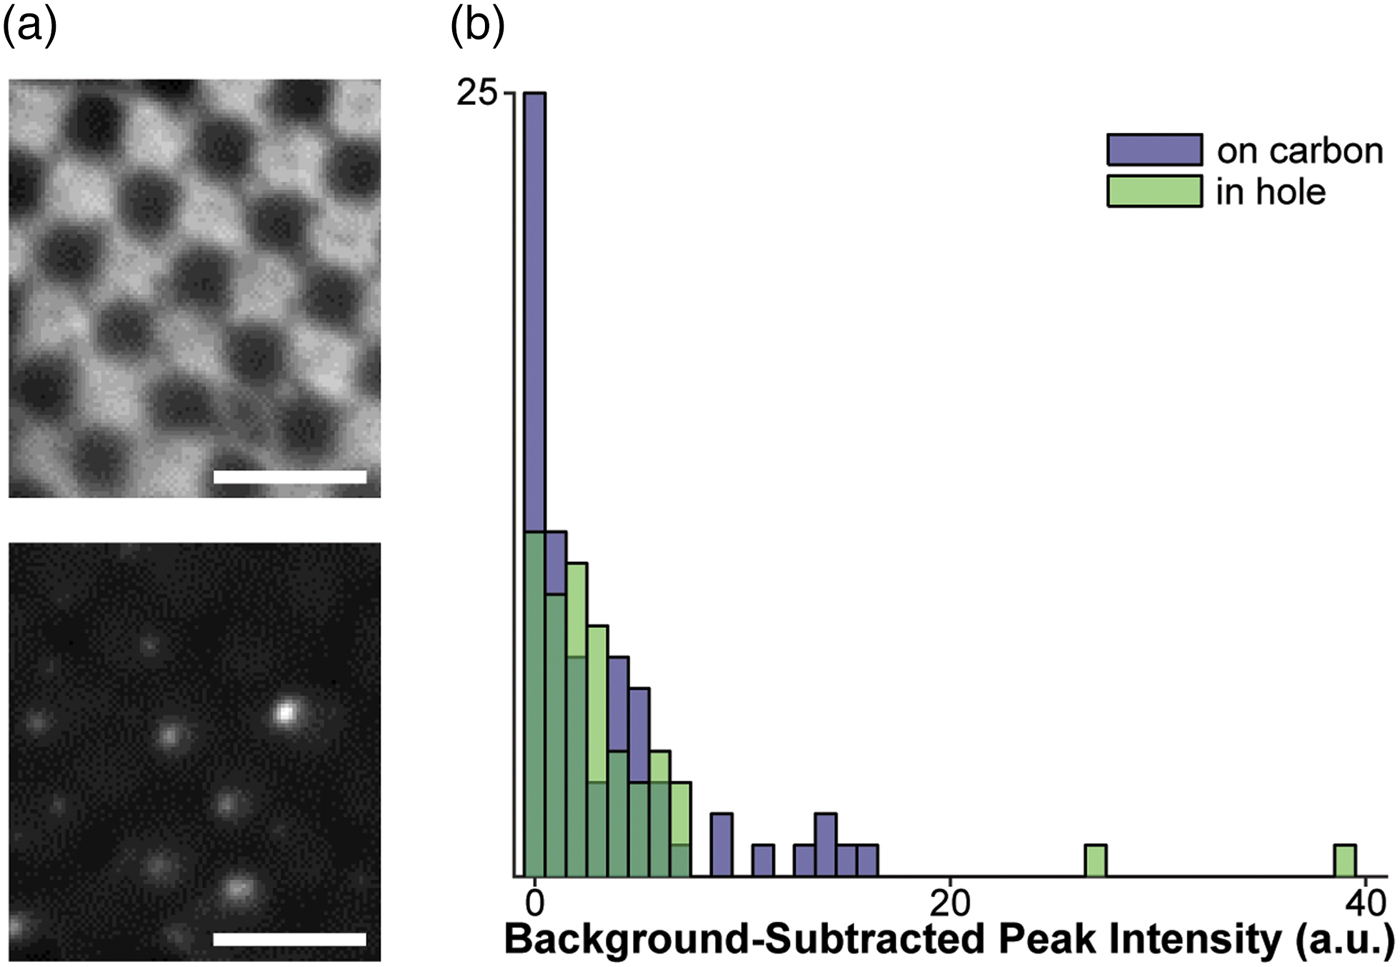
Fig. 1. Assessment of fluorophores for labeling vesicles on cryo-EM grids. a: Top: Cryo-FM image of POPC vesicles labeled with 4% R18, showing a lawn of fluorescence intensity staining the carbon of the EM grid. Bottom: Cryo-FM image of POPC vesicles labeled with 1% DiD, displaying punctate behavior. Scale bars = 5 µm. b: Quantification of intensities for clearly separated vesicles labeled with 5% DiD, sorted by location in holes or on carbon.

Fig. 2. Fluorophore quenching at room temperature. a: Fluorescence intensity of vesicles with varying lipid concentration, measured using a plate reader. Even as the total fluorophore concentration of the sample increases, autoquenching at 5% DiD results in lower total fluorescence intensity. b: Results from (a), normalized to equal fluorophore concentration (varying total lipid concentration). Autoquenching is linear from 0.5 to 5% DiD, at which point the dye is fully quenched.
For Figure 1b, a mixture of 90% POPC/10% POPS was used to decrease the clumping tendency of fully POPC vesicles, allowing better quantification of fluorescence intensity from separated vesicles on the EM grid.
For DiD-labeled vesicles, the desired amount of fluorophore was incorporated into the chloroform/methanol mixture immediately prior to drying. For R18-labeled vesicles, fluorophore was added to a glass autosampler vial with the extruded vesicle mixture and stirred for 30 min at room temperature. Following labeling, aggregates and any unincorporated fluorophore were removed by passing vesicles through two consecutive 0.5 mL 7K MWCO Pierce Zeba columns, following the manufacturer's protocols.
Lipid Vesicles for Hemifusion Experiments
The lipid composition for these vesicles was adapted from Chlanda et al. (Reference Chlanda, Mekhedov, Waters, Schwartz, Fischer, Ryham, Cohen, Blank and Zimmerberg2016) (Figs. 3–5). A mixture of 47% POPC/13% POPE/35% cholesterol/5% total ganglioside (Avanti Lipids) was prepared in a mixture of roughly 1 mg/mL in 2 parts chloroform/1 part methanol; 5% DiD was then added to this mixture prior to drying into a thin film overnight as above. Lipid vesicles were prepared by extrusion as above, using a buffer of 10 mM HEPES/50 mM sodium citrate/150 mM NaCl at pH 7.5 (Gui et al., Reference Gui, Ebner, Mileant, Williams and Lee2016) and a 100 nm pore size. Vesicle preparations were filtered by spin column as above. Vesicle concentration was estimated by DiD absorbance at 645 nm, assuming the 5% molar composition.

Fig. 3. Kinetic assay for hemifusion between influenza VLPs and 5% DiD liposomes. Vesicles and VLPs are incubated using a 37°C plate reader, and fusion is stimulated by acidification to pH 5.1 at time = 0 s. The acidification results in hemifusion between VLPs and liposomes, dequenching the dye as it is distributed into a larger lipid pool.
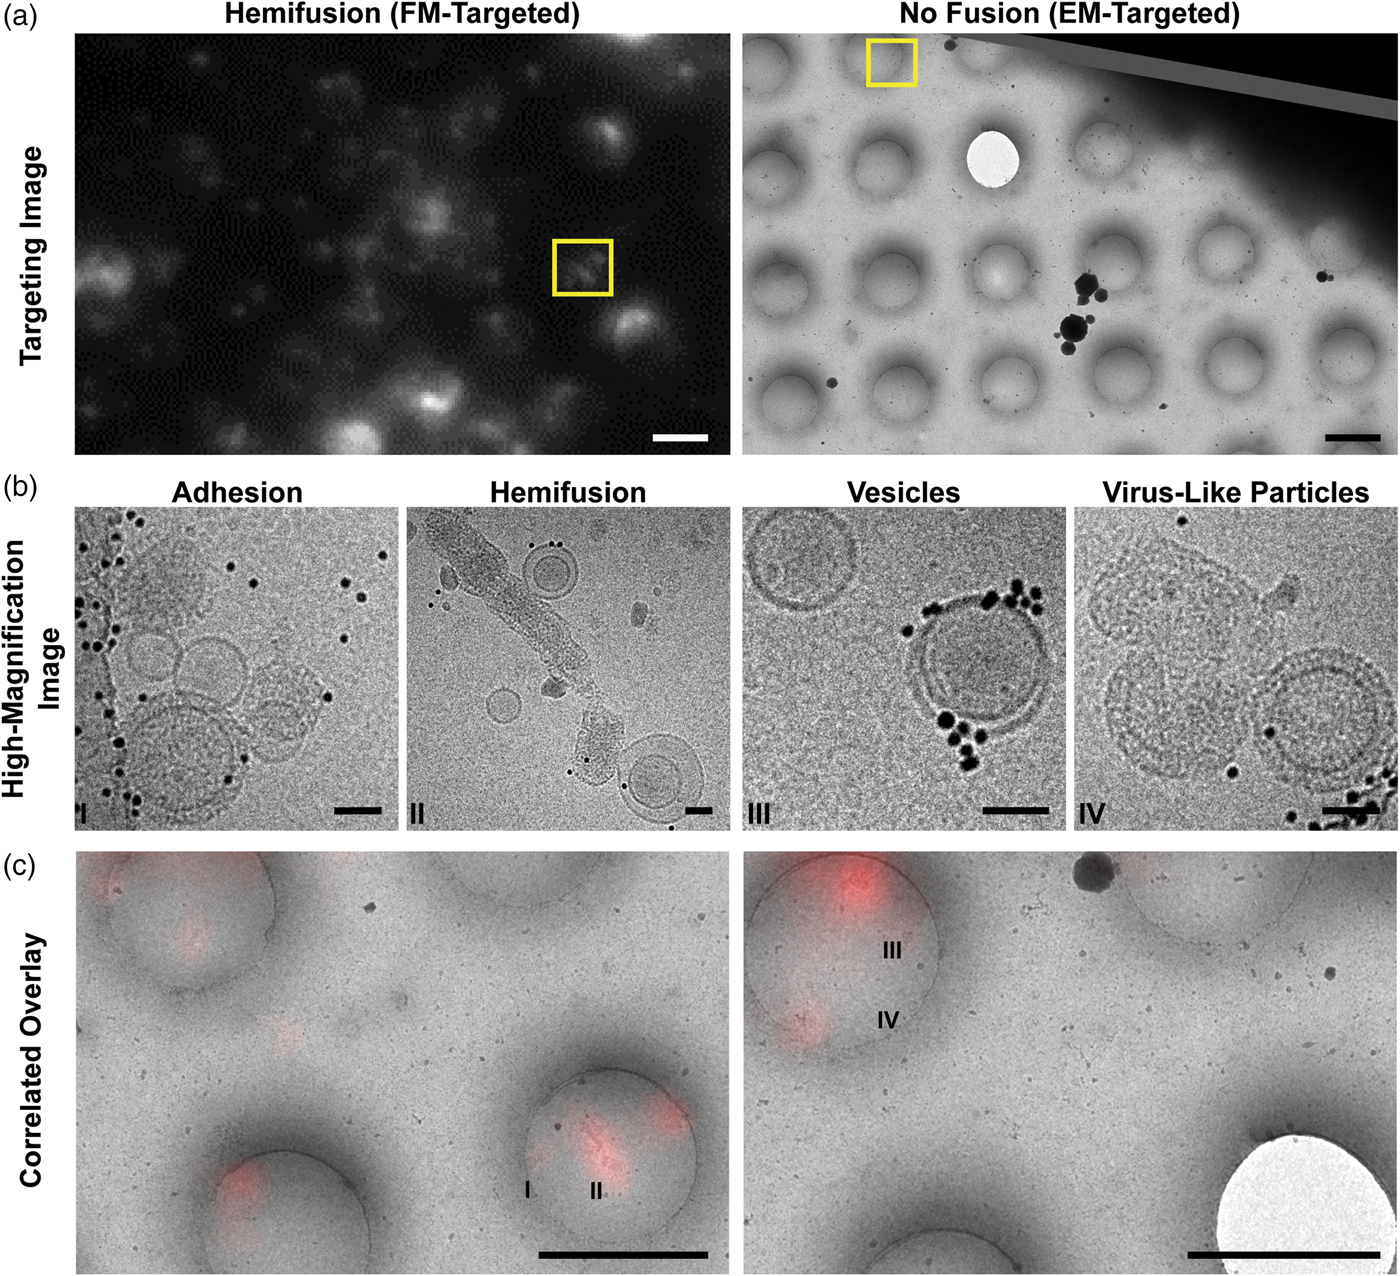
Fig. 4. Cryo-CLEM images of different types of on-grid events and their corresponding fluorescence signals. a: Targeting images are used to define points of interest (yellow boxes). Left: Fluorescence-based targeting of potential hemifusion sites. Right: EM-based targeting of VLPs and vesicles irrespective of fluorescence. Scale bars = 2 µm. b: High-magnification micrographs are taken within the targeted areas. Scale bars = 50 nm. c: During post-processing, fluorescence and EM maps are correlated with greater precision, and fluorescence intensities are quantified for all imaging locations. Roman numerals correspond to the high-magnification images in (b). Scale bars = 2 µm.
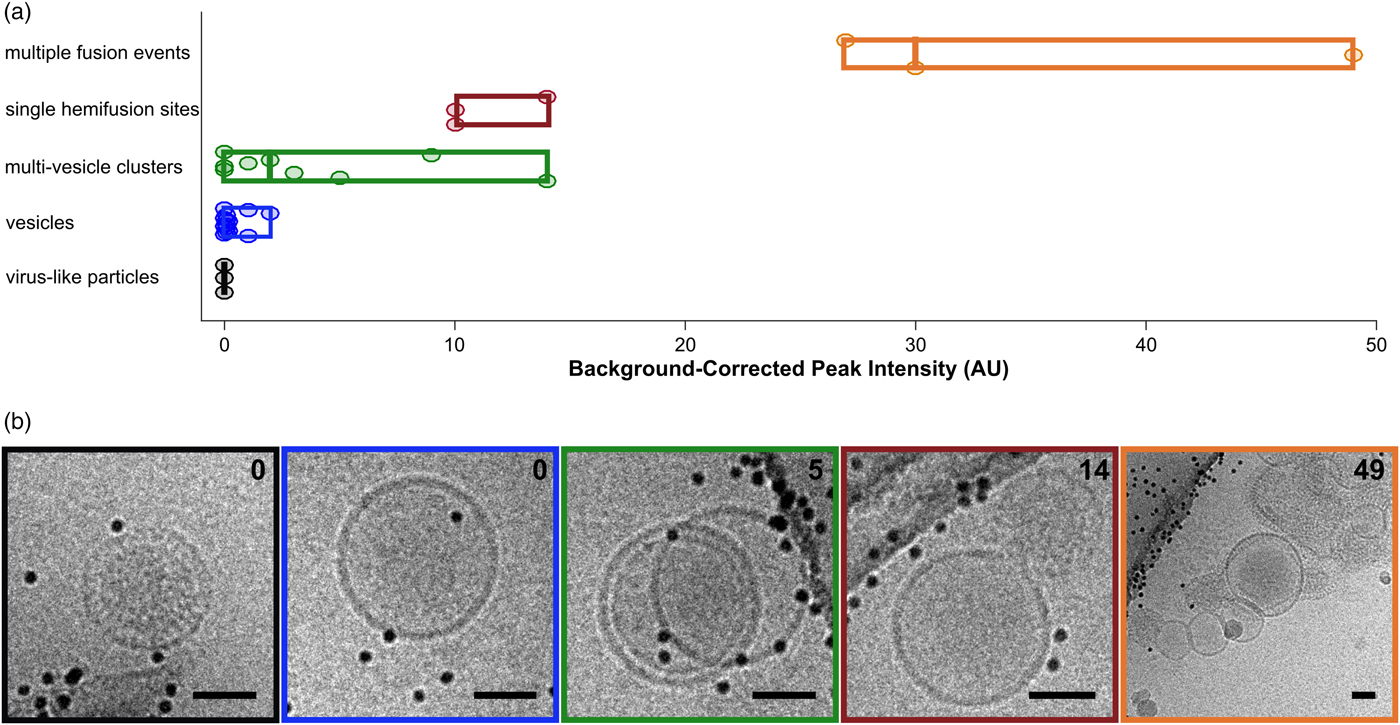
Fig. 5. Categorization of events by cryo-CLEM. a: Fluorescence intensities for vesicles and VLPs. Events are classified visually. Circular points are single events, boxes display ranges per category, and mid-lines represent the median value for that category. b: Examples of events for each of the classes in (a). Box colors correspond to category colors in (a), and baseline-subtracted peak intensities are reported in the top right hand corner of each image. Scale bars = 50 nm.
Vesicle Size Assessment
We prepared a comparison of vesicle sizes by DLS on a Zetasizer (Malvern Panalytical). Briefly, 100 µL of an unlabeled vesicle preparation (nominally 1 mg/mL) were measured for three sets of 13 reads. By this method, a 100 nm membrane produced vesicles with a mean diameter of 163.4 nm, with a polydispersity of 0.144 (roughly 62 nm standard deviation).
We then imaged this vesicle preparation on a cryo-EM grid. A mixture of 1.5 µL vesicle preparation and 1.5 µL 10 nm gold fiducial marker was pipetted onto a C-Flat 2/2-300C EM grid, blotted in a Vitrobot (Mark 2, offset −4, 3 s blot time, >85% humidity, 15°C), and plunged into liquid ethane. The resulting grid was imaged on an FEI Tecnai T12 microscope (Eindhoven, Netherlands) at 1.25 nm pixel size (9,800× microscope magnification setting), and vesicle sizes were measured using Amira software. We found that the vesicles on the grid had a mean diameter of 88 ± 36 nm.
We believe that this marked difference in vesicle sizes is due to systematic biases in both instruments. Briefly, DLS can overestimate a vesicle diameter based on charge and hydration shells, and any transient vesicle-vesicle association might also result in larger vesicle sizes without severely increased polydispersity. On the other hand, we expect that large lipid vesicles are selected against during cryo-EM imaging, possibly due to increased contact with blotting paper, greater exposure to the air–water interface, or preferential localization to areas of thick ice.
Buffer Titration for pH Control
We chose to use a HEPES-citrate dual-buffer system (10 mM HEPES/50 mM sodium citrate/150 mM NaCl) to control pH over a greater range (Gui et al., Reference Gui, Ebner, Mileant, Williams and Lee2016). pH is adjusted by addition of acidic buffer to the neutral buffer containing the sample, thus avoiding osmotic stress. A titration curve was obtained using a pH electrode, and was found to be linear between pH 4.6 and 6.1. For these experiments, buffers at pH 7.5 and 3 were used. The linear regression variables are an intercept of pH 6.4 (due to non-linearity outside the 10–50% range) and a slope of −0.036 pH units per percent pH 3 buffer.
Virus-Like Particle (VLP) Preparation
VLPs were prepared by transfection of influenza A proteins into HEK cells by adapting a previously described protocol (Chlanda et al., Reference Chlanda, Schraidt, Kummer, Riches, Oberwinkler, Prinz, Kräusslich and Briggs2015). PCAGGS plasmids for influenza A hemagglutinin (A/Hong Kong/1/68, HA), neuraminidase (A/Singapore/1/57, NA) and matrix proteins 1 (A/Hong Kong/1/68, M1) and 2 (A/Hong Kong/1/68, M2) were transfected into 1 × 10⁶ HEK 293T cells in serum-free DMEM, with 2.2 µg HA, 2.2 µg NA, 4.4 µg M1, and 1.1 µg M2 DNA per plate and using 30 µL FuGene according to the manufacturer's instructions (Promega Corporation, Madison, WI, USA). Following transfection, a final concentration of 100 mU/μL exogenous NA (New England BioLabs, Ipswitch, MA, USA, P0720S) was added to the plates to facilitate VLP release.
After 48 h, the VLPs were treated with trypsin to cleave the HA subunits (Chlanda et al., Reference Chlanda, Mekhedov, Waters, Schwartz, Fischer, Ryham, Cohen, Blank and Zimmerberg2016). Inhibited trypsin and cellular debris were removed by centrifugation at 900 × g for 10 min; VLPs were then harvested by centrifugation over a 32.5% sucrose cushion (SW40i rotor, 30k RPM, 90 min, Beckman Coulter Gmbh, Krefeld, Germany). VLP pellets were overlaid with citrate-HEPES buffer (above), allowed to rest overnight, and then resuspended gently with wide-mouthed pipet tips. VLP preparations were cleaned of excess sucrose and soluble proteins by a 4-h dialysis against citrate-HEPES buffer using a 300 kDa or 300,000 MWCO membrane, and gently concentrated in Microcon 100 kDa or 100,000 MWCO concentrators (MD Millipore Gmbh, Darmstadt, Germany) using a rotor speed of no more than 900 × g. VLPs prepared in this manner retained their mixed morphology (spheres and long filaments).
VLP concentrations were approximated by monitoring accessible surface protein concentration using a Bio-Rad Protein Assay according to the manufacturer's instructions.
Room-Temperature Fluorophore Controls
To assess the quenching behavior of DiD, we labeled 1 mg/mL POPC vesicle preparations with varying molar percentages of DiD: 0.5, 1, 2, 3, 5, 7.5, 10, and 12.5 mol%, and used buffers at pH from 5.1 to 7.5 (the pH range relevant for endosomal escape). Vesicle preparations were mixed 1:1 with citrate-HEPES buffer and measured in a Synergy HT plate reader to monitor total brightness relative to fluorophore content (BioTek, Loughborough, UK, monochromator excitation 644 nm, emission 670 nm, background correction 500 nm).
Fusion Assay
All VLP preparations were assayed for fusion activity on a BioTek Synergy H1 plate reader. In all fusion experiments, fluorophore was incorporated into the liposomes due to the highly polymorphic nature of VLPs from the filamentous virus strain used here, but the protocol could be adapted to label homogeneous influenza particles. An 80 µL fusion mix was prepared using 50 µM target membrane lipid, pH 7.5 HEPES-citrate buffer, and a volume of VLPs corresponding to 0.014 mg accessible protein. The mix was prepared in the wells of a 96-well plate, which was then loaded immediately into the plate reader. After a 5-min incubation at 37°C, the mix was acidified to pH 5.1 by injection of 45 µL of pH 3 HEPES-citrate buffer. The plate was shaken for 15 s to mix, followed by reads every 30 s for 20 min (620/40 excitation, 680/30 emission, gain 35). Finally, the plate was removed and 0.5% Triton X-100 was added to the wells to lyse the vesicles and VLPs. Assays were normalized for total DiD concentration by subtracting the pre-acidification intensity and dividing by the intensity following lysis with 0.5% Triton X-100, which corresponds to complete dequenching.
Cryo-EM/Cryo-CLEM Grid Preparation
For the quenched lipid-only grid (Fig. 1b), fluorescent signals were of roughly even intensity across the grid, making fiducial-free alignments difficult as vesicles appeared identical to each other by both EM and FM. We therefore used fluorescent fiducial markers to assist with high-precision correlation (Kukulski et al., Reference Kukulski, Schorb, Welsch, Picco, Kaksonen and Briggs2012b; Schorb et al., Reference Schorb, Gaechter, Avinoam, Sieckmann, Clarke, Bebeacua, Bykov, Sonnen, Lihl and Briggs2017). Briefly, a purchased stock solution of 50 nm Tetraspec beads was sonicated for 5 min in a waterbath sonicator, and Protochip C-Flat grids (2/2, 300 mesh) were glow-discharged for 30 s at ~30 mA. The tetraspec solution was diluted 1:50 in PBS, and 10 µL drops were incubated on the grids for 15 min. Grids were back-side blotted, rinsed with two washes of deionized water, and allowed to dry prior to use.
All cryo-EM/cryo-CLEM grids were frozen using the protocol from the “Vesicle Size Assessment” section.
For hemifusion grids, vesicles and VLPs were prepared as above, mixed, and incubated on ice at relative concentrations of 0.16 mg/mL accessible viral protein and 0.12 mM target membrane lipid for roughly 30 min. This provided ample time for VLPs and vesicles to adhere. The tubes were then brought to room temperature and acidified to pH 5.1 for 60 s, followed by addition of 10 nm Protein A-coated gold fiducial markers (Cell Microscopy Core, University Medical Center Utrecht). The sample was then pipetted onto grids and frozen as above. The total time between acidification and freezing was roughly 2.5 min, in keeping with the kinetics of the hemifusion plateau at room temperature.
Cryo-Fluorescence Microscopy and Intensity Analysis
Cryo-FM was performed on Leica DM 1200 (Wetzlar, Germany) or DM6 FS cryo-CLEM microscopes running LAS X software and an OrcaFlash 4.0 V2 SCMOS camera (Hamamatsu Photonics, Shizuoka, Japan). Excitation intensities were adjusted as needed to avoid devitrification from extended high-intensity illumination; exposure times were chosen to optimize dynamic range without saturating the camera. Typically, white transmitted light exposures were 80–100 ms, green channel imaging (480/40, 505, 527/30 nm excitation, dichroic, emission filters, Tetraspecs) used 30% intensity with an aperture of 4 and exposure times of 0.8–1 s, red channel imaging (560/40, 585, 630/76 nm excitation, dichroic, emission filters, R18) used 17% intensity for 25 ms, and far-red channel imaging (620/60, 660, 700/75 nm excitation, dichroic, emission filters, DiD) used 17% intensity with an aperture of 4 and exposure times of 14 ms (hemifusion, Fig. 4) or 150 ms (quenched vesicles, Fig. 1b). Grids were focus-mapped using built-in software functions, and imaged in Z-stacks of 10–12 slices and ~1 µm step sizes.
Images of grid squares of interest were built using FIJI's built-in Max Intensity projection algorithm (Schindelin et al., Reference Schindelin, Arganda-Carreras, Frise, Kaynig, Longair, Pietzsch, Preibisch, Rueden, Saalfeld, Schmid, Tinevez, White, Hartenstein, Eliceiri, Tomancak and Cardona2012; Schneider et al., Reference Schneider, Rasband and Eliceiri2012). Full-grid maps for correlating on-the-fly were generated with the Fiji Stack Focuser plug-in.
Spot intensities were quantified in FIJI using the built-in 3D Surface Plot feature. Briefly, the maximum peak intensity was recorded for each location, searching within the area of accuracy predicted by the correlation software and informed by visible chromatic offsets in the cryo-CLEM. The local background was determined by the plateau nearest the peak in cases where multiple peaks were present; otherwise the local background was determined by averaging along the edge of the visualization box (extended to reach a plateau when necessary), using the same surface as the point of interest. Points of interest that were near to contamination (ice) or areas of bright fluorescence without lipid/protein density (from fluorescent crystalline ice or suspected reflections) were avoided. Reported peak intensities are of the background-subtracted maximum of the peak center.
Cryo-Electron Microscopy and Correlation with Cryo-Fluorescence Microscopy
Cryo-EM grids were imaged on an FEI Tecnai T12 microscope (hemifusion) or FEI Tecnai F20 microscope (quenched DiD vesicles) running SerialEM. Grids were mapped in full at 150× nominal magnification, which was correlated with the white transmitted light cryo-FM map using SerialEM map registration functions (Schorb et al., Reference Schorb, Gaechter, Avinoam, Sieckmann, Clarke, Bebeacua, Bykov, Sonnen, Lihl and Briggs2017).
From this point, workflows followed different paths depending on the goal of the experiment. For quenched lipid grids where each vesicle's intensity needed to be quantified, it was necessary to image at a magnification where each individual vesicle would be visible irrespective of fluorescence. Therefore, grid squares of interest were imaged by using a 5 × 5 montage at 6,000× nominal magnification on the F20 microscope, and all alignment with cryo-fluorescence images was performed during post-processing using Matlab cryo-CLEM correlation scripts (Kukulski et al., Reference Kukulski, Schorb, Welsch, Picco, Kaksonen and Briggs2012b).
For hemifusion grids, we sought to both prepare maps for later correlation and to image bright and dim spots at higher magnification. Grid squares of interest were mapped at 1,200× nominal magnification and aligned on-the-fly at the T12 microscope using SerialEM registration points based on visible grid square features and defects. This rapid, fiducial-free approach provided an estimated 0.2–0.3 µm precision for the correlation, which was sufficient for the hemifusion sample. (While higher magnification and alignment with fiducials would provide more precise correlation, this is time-consuming and was found to be unnecessary for this sample.) The fluorescence map location was used to direct the stage to the expected position, at which point a 5,000× nominal magnification image was used to center the object closest to the expected position. The image was then collected with 30,000× nominal magnification (0.37 nm pixel size, ~10 e/A2, −5 µm defocus). Matlab cryo-CLEM scripts were again used in post-processing to correlate all remaining points and confirm that the higher-magnification images truly corresponded to the fluorescence they were targeting. Final correlation accuracy varied by square and ranged from roughly 60 to 200 nm.
Results
Fluorophore Selection Criteria and Controls
Assays that monitor membrane fusion are usually based on tracking lipid mixing, content release, or both. In lipid mixing assays, a fluorophore is typically embedded in one membrane; upon fusion, the fluorophore is diluted in the expanded membrane and gives a fluorescence signal, typically dequenching. Quenching can occur by multiple mechanisms, including collision (dynamic quenching), formation of a dark complex (static quenching), or RET, and can be a product of contact with the fluorophore itself (autoquenching) or with other small molecules (Lakowicz, Reference Lakowicz2006). While room-temperature, solution-based applications can draw from a wide variety of molecules and mechanisms, cryo-FM places specific demands on fluorophores and their photophysical behavior.
There are many considerations for choosing a fluorophore for cryo-CLEM applications. At cryo-temperatures (−180 to −135°C), macromolecular diffusion will not occur. The cryo-EM grid has an unprotected surface that can nonspecifically bind or activate fluorophores, increasing background signal. Cryo-temperatures have strong effects on fluorophores: excitation and emission spectra can shift or change in width (Moerner & Orrit, Reference Moerner and Orrit1999; Creemers et al., Reference Creemers, Lock, Subramaniam, Jovin and Völker2000); fluorophores can spend large portions of time trapped in the triplet state (Zondervan et al., Reference Zondervan, Kulzer, Orlinskii and Orrit2003; Kaufmann et al., Reference Kaufmann, Hagen and Grünewald2014); and some photo-switchable fluorophores fail to work as expected or experience decreased quantum yields (Faro et al., Reference Faro, Adam, Carpentier, Darnault, Bourgeois and de Rosny2010; Chang et al., Reference Chang, Chen, Tocheva, Treuner-Lange, Löbach, Søgaard-Andersen and Jensen2014). Finally, due to the optical and experimental limitations of cryo-FM, the labeled sample is visualized with a low-numerical aperture objective and a low enough illumination intensity to avoid devitrification.
Given these constraints, the fluorophores with the best potential for the study of membrane fusion by cryo-CLEM would autoquench, and could be embedded in either target or fusogen-containing membrane. The signal must be bright, and the change upon lipid mixing should be strong enough to be visible without extensive processing (a near-binary dark-bright transition). Based on these criteria, we selected two dyes for testing: octadecyl Rhodamine B (R18) and the dialkylcarbocanine DiD. Fluorophores were loaded into a 1 mg/mL preparation of extruded POPC vesicles at concentrations below those required for full quenching, plunge-frozen onto EM grids, and imaged in a Leica cryo-CLEM system. R18 was tested in 100 nm POPC vesicles at a concentration of 4%. In these grids, the R18 appears to have partitioned onto the carbon support layer of the EM grid and entered a high-fluorescence state at that location, leading to an unsuitably high background (Fig. 1a, top). In contrast to the R18, cryo-FM images of 200 nm POPC vesicles containing 1% DiD show fluorescent punctae scattered over the carbon and holes (Fig. 1a, bottom).
After confirming that DiD labeling produced punctate behavior in cryo-FM, we sought to determine the intensity change that could be expected from DiD dequenching upon lipid mixing. Room-temperature fusion assays are often baseline-corrected and normalized, allowing the use of fluorophores with modest intensity changes; however, such processing is error-prone in cryo-FM due to intensity variability by ice thickness, stray reflections, and a lack of negative and positive control areas within the imaging square for establishing baselines. For cryo-CLEM, therefore, both a dark base state and a large intensity change upon fusion are required.
To assess the quenching behavior of DiD, we prepared POPC vesicles labeled with varying molar percentages of DiD, and measured fluorescence emission under steady excitation in a room-temperature plate reader (see the “Materials and Methods” section). The total fluorescence of the vesicle samples rose from 0.5 to 3% DiD, then dropped to a lower intensity plateau for concentrations 5–12.5% with little fluorescence gain from fluorophore added past 5% (Fig. 2a). Importantly, the total fluorescence in the cuvette was lower for the higher-DiD concentrations, where the sample is quenched, than for the dequenched samples, even when the total amount of fluorophore was an order of magnitude larger. We conclude that if the molar percentage of DiD is above roughly 5%, then variation in total fluorophore amount due to heterogeneity in vesicle or virion sizes will be small in comparison with the large intensity shifts that would occur if the dye dequenches due to dilution upon fusion with a target membrane (Fig. 2). However, intensities in post-fusion states could vary more widely based on the initial fluorophore amount.
When measurements were normalized according to total fluorophore concentration (as determined by absorbance at 645 nm), a linear decrease in fluorophore brightness from 0.5 to 5% was visible, with a dark plateau at concentrations 5% and above, and a total intensity difference of roughly tenfold between 5 and 0.5% DiD (Fig. 2b). The effect of pH was minimal compared to that of concentration (Fig. 2). In the context of a fusion sample, fusion between a 5% DiD vesicle and a virion of similar size, both smaller than the point-spread function of the cryo-FM, would result in a roughly tenfold increase in fluorescence at that location (Fig. 2b). Other size relationships would be dependent upon both the dilution factor of the DiD upon fusion according to the target surface area, and distribution of fluorescence intensity over the imaging area of the fused membranes.
We next assessed the consistency of small, quenched DiD vesicles that would be appropriate for fusion assays. A 1 mg/mL POPC/POPS suspension was labeled with 5% DiD, extruded through 50 nm pores, and plunge-frozen onto grids containing 50 nm tetraspec beads. Grids were imaged in cryo-FM as above. Grid squares of interest were then imaged on an FEI Tecnai F20 electron microscope, correlated with the cryo-FM images (Kukulski et al., Reference Kukulski, Schorb, Welsch, Picco, Kaksonen and Briggs2012b), and fluorescence pixel intensities were quantified for each lipid vesicle within the squares of interest (Fig. 1b).
These cryo-CLEM results confirmed that the fluorescence intensity of the quenched DiD liposomes is consistently low, and is not affected by adhesion to the carbon grid surface (Fig. 1b). No intensity corrections were made for vesicle size variation or multiple lamellae, neither of which can be assessed prior to using the cryo-FM image for targeting EM imaging. In this context, the narrow intensity distribution in Figure 1b shows that variation in the total amount of fluorophore present in a spot does not result in strong signal heterogeneity in the quenched state, consistent with full quenching occurring at the same fluorophore concentration as at room temperature (Fig. 2).
Localizing Membrane Fusion and Hemifusion Events in Cryo-CLEM
We elected to use influenza VLPs to induce fusion; the influenza fusion mechanism is well-studied and VLP samples are well-suited for the concentration and thickness constraints of EM. VLPs were prepared by transfecting HEK 293T cells with plasmids containing the influenza A proteins hemagglutinin, M1, M2, and neuraminidase as in Chlanda et al. (Reference Chlanda, Schraidt, Kummer, Riches, Oberwinkler, Prinz, Kräusslich and Briggs2015). VLPs were harvested by centrifugation through a sucrose cushion, after which their mixed morphology (filaments and spheres) was maintained, and assessed for fusogenicity (Fig. 3). Target vesicles were prepared by extruding a 1 mg/mL suspension of 44.7% POPC, 12.3% POPE, 33.2% cholesterol, 4.8% total ganglioside, and 5% DiD in HEPES-citrate buffer through 100 nm pores [membrane composition adapted from Chlanda et al. (Reference Chlanda, Mekhedov, Waters, Schwartz, Fischer, Ryham, Cohen, Blank and Zimmerberg2016)].
We prepared EM grids to assess fusion localization by cryo-CLEM. VLPs and quenched-DiD vesicles were incubated on ice at relative concentrations of 0.16 mg/mL accessible viral protein and 0.12 mM target membrane lipid to allow VLP-vesicle adhesion. The tube contents were then acidified at pH 5.1 for 60 s at room temperature, followed by addition of 10 nm gold fiducial markers and plunge-freezing in liquid ethane. The total time between acidification and freezing was roughly 2.5 min, at which time the lipid mixing reaches a plateau at room temperature (Fig. 3).
The EM grids were then subjected to cryo-FM, following the same workflow as with the control DiD vesicle sample above (Fig. 1b). Cryo-FM imaging was performed using a tenfold lower exposure time appropriate for the high-intensity, dequenched punctae; we therefore expected a very low signal from the quenched vesicles. Brightfield and fluorescence maps of the EM grid were correlated with EM micrographs applying established SerialEM-based correlation protocols during data collection on an FEI Tecnai T12 microscope (Mastronarde, Reference Mastronarde2005; Schorb et al., Reference Schorb, Gaechter, Avinoam, Sieckmann, Clarke, Bebeacua, Bykov, Sonnen, Lihl and Briggs2017).
Selected grid squares were imaged under low-dose, low-magnification conditions at which VLPs and vesicles could be identified (3,500–6,000× nominal magnifications), allowing later evaluation of the full grid square by correlating the lower-resolution cryo-FM and cryo-EM images in post-processing (Kukulski et al., Reference Kukulski, Schorb, Welsch, Picco, Kaksonen and Briggs2012b). Because we expected lipid mixing during fusion to dequench the DiD and yield bright cryo-FM signals, we targeted bright- and medium-intensity punctae for higher-magnification EM imaging using a SerialEM-based correlation protocol at the cryo-EM (Figs. 4a, 4b) (Schorb et al., Reference Schorb, Gaechter, Avinoam, Sieckmann, Clarke, Bebeacua, Bykov, Sonnen, Lihl and Briggs2017). This combination of approaches allows targeted high-resolution acquisitions at spots of interest, as well as lower-resolution evaluation of both targeted and untargeted areas during post-processing (Figs. 4a–4c).
After examining the overlay of fluorescence signal with the electron micrographs, we observed that the brightest spots on the grid corresponded to aggregates or clusters of VLPs and vesicles with multiple fusion sites (Fig. 5a). The intermediate intensity spots typically contained putative fusion events, as well as the most intense quartile of vesicle clusters (Fig. 5). Importantly, none of the intermediate or bright fluorescence events correlated with unfused VLPs or solitary vesicles, indicating that the DiD remains quenched in the unfused vesicles and that there is no transfer of dye outside of active membrane fusion (Figs. 4b, 4c, 5). Unfused VLPs and solitary vesicles gave very low fluorescent signals (Fig. 5a). We note that it may not be appropriate to interpret the relative numbers of fused and unfused samples from an on-grid experiment, since fused and unfused samples could be differently affected by blotting conditions; however, relative numbers could be compared between parallel experiments. Considering all trends together, if all bright and intermediate fluorescence events were targeted, all hemifusion and fusion sites should be contained in the EM dataset, along with a small population of cluster events that can be screened following acquisition.
Discussion and Future Prospects
In this study, we demonstrated that the established DiD-based fusion assay (Rust et al., Reference Rust, Lakadamyali, Zhang and Zhuang2004; Gui et al., Reference Gui, Ebner, Mileant, Williams and Lee2016) can be incorporated into a cryo-CLEM workflow to specifically locate, target, and image membrane fusion sites. By using the same fluorescence-based lipid mixing indicator as room-temperature kinetic assays (Fig. 3), this method also provides a way to link the EM-based ultrastructural imaging with orthogonal kinetic and functional information. Furthermore, our use of DiD, which employs an RET-based autoquenching mechanism (Benchimol et al., Reference Benchimol, Hsu, Schutt, Hall, Mattrey and Esener2013), confirms that RET-based fluorescence applications can function at cryo-temperatures under favorable conditions. Of these applications, autoquenching is particularly well-suited for cryo-CLEM because the use of a single fluorophore decreases the likelihood of spectral shifts strongly affecting the overlap integral for RET. RET applications with many dye molecules present, such as membrane fusion, are also optimal: the number of fluorophores is likely sufficient to allow the random orientation of the fluorophore dipoles to approximate the tumbling seen at room temperature, and fluorescent emission will be strong despite cryo-temperature limitations such as extended triplet state occupation, gentle illumination intensity, or low numerical aperture.
A lipid mixing indicator has many applications. One natural extension of this method will be to load DiD into viruses to locate rare fusion events within eukaryotic endosomes by cryo-CLEM. DiD is known to incorporate readily into influenza virus membranes and experience concentration-dependent autoquenching at room temperature, and fusion inside room-temperature eukaryotic cells has already been tracked using this method (Lakadamyali et al., Reference Lakadamyali, Rust, Babcock and Zhuang2003; Rust et al., Reference Rust, Lakadamyali, Zhang and Zhuang2004; Gui et al., Reference Gui, Ebner, Mileant, Williams and Lee2016). In this case, detection of lipid mixing would offer a clear advantage over traditional colocalization approaches. If a virus is contained within an endosome, the virus and endosome would give a positive colocalization signal independent of fusion state, while lipid mixing would be specific to hemifusion and fusion.
For the study of membrane fusion in vitro, our cryo-CLEM method also provides an orthogonal signal for lipid mixing, which cannot always be visually distinguished from membrane apposition in cryo-EM images. Furthermore, the use of fluorescence dequenching to study influenza fusion allows correlation between an image and previous kinetics studies based on similar fluorescence signals (Floyd et al., Reference Floyd, Ragains, Skehel, Harrison and van Oijen2008), ensuring that the definition of fusion state is consistent between the kinetic and structural methods.
In conclusion, we have developed a method for localizing a specific function on a cryo-EM grid, using an application of RET in cryo-CLEM. This development allows localization of lipid mixing rather than a protein of interest in cryo-FM, which can be used either to target this site for cryo-EM imaging, or to provide an orthogonal evaluation of the fusion state.
Author ORCIDs
Lauren Ann Metskas, 0000-0002-8073-6960; John A. G. Briggs, 0000-0003-3990-6910
Acknowledgments
This research was technically supported by the Electron Microscopy Core Facility and the Protein Expression and Purification Core Facility at the European Molecular Biology Laboratory (EMBL, Heidelberg), and the EM facility at the MRC Laboratory of Molecular Biology. We thank M. Schorb, W. Hagen, W. Kukulski, E. Lemke, G. Paci, O. Avinoam, and Y. Bykov for helpful discussions and technical assistance with the Leica cryo-CLEM system, and M. Clarke for assistance with VLP preparations. This project was funded by the European Research Council (ERC) under the European Union's Horizon 2020 research and innovation programme (ERC-2014-CoG 648432—MEMBRANEFUSION) and the Medical Research Council (MC_UP_1201/16). JAGB is an inventor on filed patents that have been licensed by Leica Microsystems and commercialized in the Leica cryo-CLEM system used in this study.
Author Contributions
L.A.M. performed the research and data analysis. L.A.M. and J.A.G.B. designed research, interpreted results, and wrote the manuscript.


 Open access