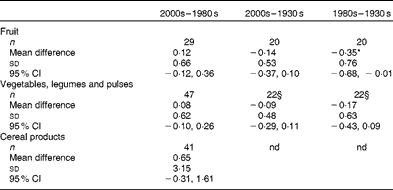
We recently reported a contemporary analysis of the Fe content of plant-based foods in the United Kingdom (year 2000 analysis) and compared the results with historical analyses from the 1980 s and 1930 s. Our Table 2 indicated small but statistically significant differences between the Fe content of (1) fruits between the 1930 s analyses and the 1980 s or 2000 s analysis ( − 0·35 and − 0·14 mg/100 g, respectively), (2) vegetables between the 1930 s and 1980 s analyses ( − 0·17 mg/100 g) and (3) cereal products between 1980 s and 2000 s analysis (0·65 mg/100 g, most probably due to changes to fortification). While the differences remain accurate, their statistical significance (based on 95 % CI) is not. Due to an error in data transfer, the values reported as 95 % CI (i.e. approximated as mean ± se× 1·96) were in fact means with their standard errors. The new table below shows corrected 95 % CI and thus that statistical significance remains only for fruits between the 1980 s and 1930 s. All of the raw data presented in the original paper remain correct. Overall, our messages also remain precisely the same: namely that there is remarkably little difference in the Fe content of vegetables, legumes and pulses and fruits between the 1930 s and the year 2000 and insufficient published data to allow for comparison of the cereal products, but the issue of modern Fe fortification practices remains a subject of debate. We are most grateful to Donald R. Davis, retired from The University of Texas at Austin, USA, for alerting us to this problem as, using our published raw data, he was able to reconstruct Table 2 and show that the 95 % CI values were, originally, incorrectly reported. As noted above, the table herein is the corrected version(Reference Bruggraber, Chapman and Thane1). The authors apologise for this error.
Table 2 (corrected). Differences in the iron content (mg iron/100 g food)† of the plant-based food groups between the decades‡ (Number of foods in the group, mean differences, standard deviations and 95 % confidence intervals)

nd, not determined
* Statistically significant decrease from 1930 s to 1980 s.
† Values shown are total Fe content and include the natural Fe content plus any fortificant Fe where it has been used.
‡ The decades compared were: the re-analysis presented in this study (2000 s), the latest literature values (1980 s) and the earliest literature values (1930 s).
§ Vegetables only due to a lack of data in 1930 s on legumes and pulses.


