


Introduction
Hashimoto's thyroiditis (HT), first described by Hakaru Hashimoto in 1912, is an organ-specific autoimmune disease, which is almost always associated with goiter as well as elevated circulating antithyroid peroxidase and antithyroglobulin antibodies (Takami et al., Reference Takami, Miyabe and Kameyama2008; Jankovic et al., Reference Jankovic, Le and Hershman2013). Other terms in use, interchangeably with HT, include Hashimoto disease, struma lymphomatosa, and lymphocytic thyroiditis. This disease is a leading cause of a thyroid hypofunction in the areas of the world without iodine deficiency. Although HT is usually associated with hypothyroidism, transient hyperthyroidism may also manifest at the onset of the disease due to a massive autoimmune destruction of the thyroid gland. HT is defined in light microscopy by the presence of extensive lymphocytic infiltrate (predominantly T cells and plasma cells) with germinal center formation and atrophic follicles with abundant Hürthle cells. There may also be some giant cells and increased fibrosis that does not extend beyond the capsule (Dailey et al., Reference Dailey, Lindsay and Skahen1955; Burgess & Tucker, Reference Burgess and Tucker2006; Davies & Welch, Reference Davies and Welch2006).
Although generally thought to be a benign disorder, HT is sometimes associated with well-differentiated thyroid cancer (Sclafani et al., Reference Sclafani, Valdes and Cho1993; Okayasu et al., Reference Okayasu, Fujiwara, Hara, Tanaka and Rose1995; Molnár et al., Reference Molnár, Molnár, Bedekovics, Mokánszki, Győry, Nagy and Méhes2019). It has been reported that papillary (PTC), follicular, undifferentiated, medullary, and squamous cell carcinomas have been detected in patients with HT. Moshynska & Saxena (Reference Moshynska and Saxena2008) have studied a clonal relationship between HT and primary thyroid lymphoma. The observed sequence similarity between HT and subsequently developed primary thyroid lymphoma suggested that HT can evolve into thyroid lymphoma. It should be pointed out that this “benign” histopathological lesion might be a carcinogenic risk factor; therefore, various types of thyroid cancer can hide in the background of chronic autoimmune thyroiditis, even if not suspected preoperatively (Shih et al., Reference Shih, Lee, Hsieh, Yu, Liu, Kebebew, Clark and Duh2008).
There are many papers on the association of chronic autoimmune thyroiditis with PTC as the predominant form of thyroid carcinoma (accounting for 65–93% of all thyroid carcinoma) (Okayasu et al., Reference Okayasu, Fujiwara, Hara, Tanaka and Rose1995; Tamimi, Reference Tamimi2002; Cipolla et al., Reference Cipolla, Sandonato, Graceffa, Fricano, Torcivia, Vieni, Latteri and Latteri2005; Larson et al., Reference Larson, Jackson, Riall, Uchida, Thomas, Qiu and Evers2007; Repplinger et al., Reference Repplinger, Bargren, Zhang, Adler, Haymart and Chen2008; Zhang et al., Reference Zhang, Dai, Wu, Yang and Yin2014; Lai et al., Reference Lai, Xia, Zhang, Li and Jiang2017; Graceffa et al., Reference Graceffa, Patrone, Vieni, Campanella, Calamia, Laise, Conzo, Latteri and Cipolla2019). It was reported that HT might even be a predisposing factor and a submicroscopic counterpart of PTC. In most resection specimens, the diagnosis of PTC in the background of HT is primarily based on the nuclear features of follicular cells including the (i) alteration of nuclear size and shape, (ii) chromatin pattern, and (iii) nuclear membrane irregularity (Stephenson, Reference Stephenson2001; Arif et al., Reference Arif, Blanes and Diaz-Cano2002; Nikiforov et al., Reference Nikiforov, Seethala, Tallini, Baloch, Basolo, Thompson, Barletta, Wenig, Al Ghuzlan, Kakudo, Giordano, Alves, Khanafshar, Asa, El-Naggar, Gooding, Hodak, Lloyd, Maytal, Mete, Nikiforova, Nose, Papotti, Poller, Sadow, Tischler, Tuttle, Wall, LiVolsi, Randolph and Ghossein2016; Pusztaszeri & Auger, Reference Pusztaszeri and Auger2017). However, the microscopic nuclear reactive changes of the benign cells in HT specimens can frequently resemble the malignant nuclear features in PTC specimens (Fig. 6b). Additionally, the papillary formations of tumor tissues and psammoma bodies (laminated microcalcification) as specific pathologic features of PTC are rarely observed in HT-associated PTC specimens (Ohmori et al., Reference Ohmori, Miyakawa, Ohmori and Takano2007). Some published papers have also reported that the investigated specimens occasionally showed the same immunohistochemical staining, including the expression of cytokeratins, S100 protein, and HBME-1, and molecular profile (Arif et al., Reference Arif, Blanes and Diaz-Cano2002; Weetman, Reference Weetman2004; Rhoden et al., Reference Rhoden, Unger, Salvatore, Yilmaz, Vovk, Chiappetta, Qumsiyeh, Rothstein, Fusco, Santoro, Zitzelsberger and Tallini2006; Anand et al., Reference Anand, Singh, Kushwaha, Hussain and Sonkar2014). Thus, a pathologist may encounter lesions of the thyroid gland in which the distinction between HT alone and HT-associated PTC can be quite subtle. The decision favoring one or another has clinical consequences and indicates different methods of treatment. On one hand, patients with HT-associated PTC require the most effective treatment at the initial stages of the disease when it is still curable. On the other hand, excessive treatment and psychological discomfort should be avoided in patients with HT alone. For these reasons, the differential diagnosis between the HT-alone and HT-associated PTC specimens should include some quantitative morphologic analyses to help improve the conventional histopathological, immunohistochemical, and molecular diagnosis.
It is well known for a long time that fractal parameters provide a robust description of the structure and function of many different organs, including brain, thyroid gland, heart, lung, skeletal muscle, bone, and placenta (Einstein et al., Reference Einstein, Wu, Sanchez and Gil1998; Metze et al., Reference Metze, Lorand-Metze, Leite and Adam2009, Reference Metze, Adam and Florindo2019; Bedin et al., Reference Bedin, Adam, de Sa, Landman and Metze2010; Lorthois & Cassot, Reference Lorthois and Cassot2010; Di Ieva et al., Reference Di Ieva, Grizzi, Sherif, Matula and Tschabitscher2011, Reference Di Ieva, Grizzi, Jelinek, Pellionisz and Losa2014; Ferro et al., Reference Ferro, Falconi, Adam, Ortega, Lima, de Souza, Lorand-Metze and Metze2011; Pantic et al., Reference Pantic, Harhaji-Trajkovic, Pantovic, Milosevic and Trajkovic2012a, Reference Pantic, Pantic and Basta-Jovanovic2012b; Metze, Reference Metze2013; Park et al., Reference Park, Shin, Kang, Hyun, Oh and Shin2014; Paunovic et al., Reference Paunovic, Vucevic, Radosavljevic, Pantic, Veskovic and Pantic2019; Todorovic et al., Reference Todorovic, Dincic, Nesovic Ostojic, Zaletel, Lopicic, Dundjerovic, Tatic, Kovacevic, Paunovic, Puskas and Markovic2019). Since the nuclear features are important for the differential diagnosis between benign and malignant cells, Metze et al. (Reference Metze, Adam and Florindo2019) suggested that the fractal dimension (FD) of chromatin organization might be used as a novel potential biomarker for carcinogenesis, tumor progression, and prognosis. Additionally, in the same study, authors also reported that the fractal descriptors can be combined with other quantitative morphologic measures, including gray-level co-occurrence matrix (GLCM) texture parameters, for the estimation of chromatin architecture.
The aim of the current study was to quantify differences between the HT-associated PTC and HT specimens by fractal and GLCM texture analyses. The quantification of differences excluded the subjective experience of an observer and facilitated the diagnosis of the HT-associated PTC. In order to quantify the differences between the investigated specimens, FD and lacunarity as well as several typically used GLCM texture parameters of the chromatin follicular cell were calculated. Specifically, we calculated contrast, correlation, angular second moment (ASM), homogeneity, and entropy, in addition to the FD and lacunarity.
Materials and Methods
Preparation and Staining of Specimens
We analyzed thyroid biopsies retrospectively taken from a cohort of 20 patients (ten patients per group) at the Center for Endocrine Surgery (Clinical Center of Serbia, Belgrade, Serbia). Prior to the surgical treatments, none of the HT-associated PTC patients had received any chemotherapy or radiotherapy. The diagnosis of HT-associated PTC and HT was confirmed by an expert pathologist according to the histological findings and the appropriate laboratory tests. Approximately 4% neutral-buffered formaldehyde was used for the fixation of thyroid tissues. After the fixation, the tissues were dehydrated in graded ethanol and embedded in paraffin blocks. The formalin-fixed tissues were later cut into 5-μm-thick sections and mounted on glass slides. After that, hematoxylin and eosin (H&E) were used to stain the sections. The number of (i) screened tissue sections for each sample, (ii) observed microscopic fields, and (iii) selected nuclei from the same microscopic field was mostly dependent on a microscopic variant of PTC (classic, follicular, diffuse sclerosing, Warthin-like, or solid) and the density of the cells per cross-sectional area. Additionally, before the color deconvolution of the histological specimens was performed, the expert pathologist of our team marked the characteristic follicular cell nuclei for further analysis using the corresponding plugin (cell counter) provided in the ImageJ software (NIH, Bethesda, MD, USA) (Fig. 1).

Fig. 1. Schematic diagram illustrating the marking of nuclei of a particular photomicrograph using the corresponding plugin (cell counter) provided in the ImageJ software (NIH, Bethesda, MD, USA). The selection of nuclei, based on the relatively similar features between the investigated samples, was performed by the expert pathologist of our team.
Digitalization of Histological Specimens
The histological sections were digitized using an Olympus DP70 camera (Olympus BX50, Tokyo, Japan) and Analysis 5.0 software (SoftImaging System, Olympus). The images were acquired at 400× on microscope magnification, using a 40× (NA 0.65) objective along with an eyepiece of 10× magnification and field number 22, with fixed light intensity and resolution (pixel size: 4,080 × 3,072 pixels; resolution: 200 dpi; and bit depth: 32). A standard on microscope magnification used by the majority of pathologists when diagnosing the thyroid disorders including the PTC diagnosis in the background of HT is 400×. The main idea behind this study was to complement the conventionally used analyses with highly objective methods for the quantitative evaluation of chromatin patterns. The correct classification of visual textures of lighter and darker regions, corresponding to the lightly colored euchromatin and darker heterochromatin, is not a trivial task even for experienced examiners. Therefore, quantitative evaluation tools could be a significant help in establishing the correct diagnoses, provided also that their use is not complicated.
The theoretical optical resolution limit in wide-field microscopy, assuming a light wavelength of about 500 nm, equals 0.6 times wavelength over the numerical aperture, amounting in the case of 400× magnification at about 460 nm. The minimal number of pixels corresponding to this optical resolution is about 1,200 × 1,200. To minimize possible errors due to multiple transformations of image data, we used a somewhat larger number of pixels per image. All of the images were saved in the TIFF format to preserve the high image quality.
Color Deconvolution
The acquired images were then subjected to color deconvolution using the Color Deconvolution plugin (G. Landini, University of Birmingham, UK) provided in the ImageJ software package in order to obtain the hematoxylin stain image. In case of the H&E staining, hematoxylin stains mainly the cell nuclei, and the built-in option H&E 2 was a good match for our data, eliminating intensity peaks due to mixing of the red and blue channels. Namely, the absorbed light intensities in the absorption spectra of different color stains depend nonlinearly on the stain concentration. Knowing the typical light absorption spectra of the specific dyes, the pixel intensity information can be separated into the three predefined color channels (Ruifrok & Johnston, Reference Ruifrok and Johnston2001). Therefore, the most objective manner to perform the grayscale conversion was to extract the hematoxylin stain image and use the obtained luminance as the grayscale intensity. The specimen digitization, color deconvolution, and the subsequent procedures and analyses are illustrated in Figure 2. All picture elements, except of the studied follicular cell nucleus, were removed by the careful outlining using the polygon selection tool and Crop command in the ImageJ software. We prepared 25 segmented nuclei per patient for each of the two studied groups. In addition, we confirmed that very few samples per patient could lead to inaccurate estimation of means and other statistical parameters for our analysis (Fig. 3). More than 20 nuclei were needed in our case to ensure reliable statistical data. As a result of the described preprocessing, a total of 500 images containing a single nucleus per image (250 nuclei per group, i.e., 25 nuclei per patient) were acquired and used for further fractal and GLCM texture analyses (Fig. 2).

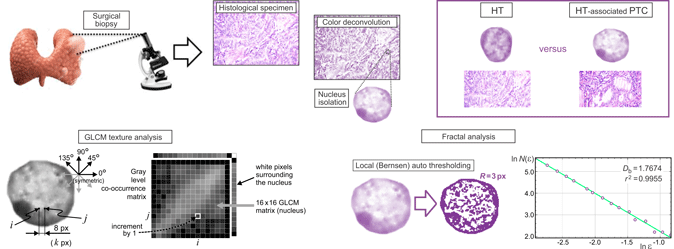
Fig. 2. A visual summary of the analyses performed on the digitized histological sections incorporating the follicular cell nuclei of interest. Following the surgical biopsies, the HT as well as the HT-associated PTC specimens were converted into the 4,080 × 3,072 px2 sized micrographs. Color deconvolution was employed to extract the hematoxylin stain images, which were used to isolate the nuclei for fractal and textural analyses. The GLCM texture analysis considered four directions and pixel distances from 1 to 16 px, with statistical analyses performed for the adjacent pixels (1 px), 4 px distance, and 8 px distance. Fractal analysis was performed on the nuclei micrographs, which were made binary following the local Bernsen auto thresholding taking into account the neighboring points in the radius of 3 px (bottom left). The fractal parameters were estimated from the slopes of the corresponding regression lines (bottom right), for 12 randomly set grid positions, and averaged. Goodness of fit of the regression line for each individual calculation was confirmed by the calculated correlation coefficient.

Fig. 3. Mean fractal dimension,  $\bar{D}_{\rm b}$, and lacunarity, $\bar{\Lambda }_{\rm b}$, as functions of the number of nuclei examined for an individual patient. Due to linear regression, with an increase in the number of examined nuclei, the mean values of parameters approach asymptotical stabilized means. In our case, more than 20 nuclei were deemed sufficient for the correct statistical analyses.
Local (Bernsen) Auto Thresholding
We performed the GLCM texture analysis directly on the hematoxylin stain images and the fractal analysis on the binary images, as we were interested in the structure and spatial distribution of the heterochromatin (darker) and euchromatin (appearing much lighter). The best way to separate the locally darker and lighter structures of heterochromatin and euchromatin was to apply some type of local auto thresholding in the same manner on all images of the nuclei. We used the Bernsen method of local auto thresholding and the corresponding plugin provided in the ImageJ software. The Bernsen method belongs to a group of locally adaptive thresholding methods based on contrast. If the local contrast is above a predefined contrast threshold, the threshold is set at the midrange value, which is the mean of the minimum and maximum gray values in a local window of a suggested radius. It is advantageous for the nuclei analysis that the ImageJ implementation uses circular windows instead of originally proposed rectangular windows. We used the window radius equal to 3 px corresponding to a window equal in size to several percent of a typical nucleus diameter. If the local contrast is lower than a predefined contrast threshold, the neighborhood is considered to consist of only one class of pixels and the central pixel is set to either the foreground object color or background depending on the midrange value. Upon thresholding, we recorded binary images for the subsequent fractal analysis.
Fractal Analysis
Fractal analysis primarily studies the structural complexity of objects or patterns. To this purpose, we used the FracLac plugin (developed by A. Karperien, Charles Sturt University, Australia) freely available with the ImageJ software. For two-dimensional images, FD belongs to a range of values starting at unity (very smooth lines) and less than two. For many natural processes that exhibit a multiplicative character, it is found to be in between 1.5 and 1.9 in most cases. One of the ways to determine the FD, D b, is to cover the structures of interest with grids consisting of squares or circles. The length of a grid cell edge or diameter (normalized with respect to a predefined reference distance) varies from a small value to a much larger one, forming a series of grids of various grid cell sizes. In our study, a scaled series 7/8 was employed, resulting in a total of 16 sizes used for the calculation of fractal parameters: ɛ ∈{5, 6, 7, 8, 9, 11, 12, 14, 16, 18, 21, 23, 27, 31, 35, 40}, as illustrated by the grids shown in Figure 4. A change in the number of non-empty grid cells with a change of the grid cell size is modeled by a best-fit regression line, whose slope serves to estimate the FD, D b:
 $$D_{{\kern 1pt} {\rm b}}={-}\mathop {\lim }\limits_{\varepsilon \to 0} \displaystyle{{\ln N\lpar \varepsilon \rpar } \over {\ln \varepsilon }}.$$
Fig. 4. Three example grids that were used for the calculation of fractal parameters. In our study, scaled series 7/8 was employed, resulting in a total of 16 grid cell sizes used to estimate the parameters from the obtained slopes of the regression lines: ɛ ∈{5, 6, 7, 8, 9, 11, 12, 14, 16, 18, 21, 23, 27, 31, 35, 40} pixels.
For an example of a typical regression line in our analyses, see the bottom right corner of Figure 2. It can be seen that a sufficient number of grids (sizes) were used and that the data points are well spaced. With every calculation, the goodness of the regression line fit is confirmed by the correlation coefficient, r 2, which should be 1.0 for a pure mathematical fractal. The correlation coefficients were very high throughout this study (a typical example of 0.9955 is shown in Fig. 2). Additionally, we used 12 randomly positioned grids per image at each scale to reduce the effects of the arbitrary grid positioning. The results were averaged per grid positioning and per patient, providing the complete statistical data. In addition to the box-counting, we used the mass-based method, where the number of pixels inside the grid cell is quantified rather than the number of grid cells to cover a structure. The two methods often lead to strikingly similar results; however, the mass-based method also allows the calculation of lacunarity, the second-order moment of the fractal distribution of points. The probabilities, P(m, ɛ), of finding m points within a cell of scale ɛ were normalized and used to obtain the first-order (mean) mass, M(ɛ), and second-order mass moment, M 2(ɛ):
 $$M\lpar \varepsilon \rpar=\sum\limits_m {mP\lpar m\comma \;\varepsilon \rpar } \comma \;\quad M^2\lpar \varepsilon \rpar=\sum\limits_{^m } {m^2P\lpar m\comma \;\varepsilon \rpar }.$$
Denoting the mathematical expectation (average) by 〈 ⋅ 〉, the fractal lacunarity is calculated as
 $$\Lambda _{\rm b}\lpar \varepsilon \rpar=\displaystyle{{\langle M^2\lpar \varepsilon \rpar \rangle -{\langle M\lpar \varepsilon \rpar \rangle }^2} \over {{\langle M\lpar \varepsilon \rpar \rangle }^2}}.$$
GLCM Texture Analysis
The GLCM represents the spatial dependence of gray-level values in an image. It is calculated how often two pixels with the certain levels, i and j, of grayscale intensity occur in an exact spatial arrangement (Haralick et al., Reference Haralick, Shanmugam and Dinstein1973). The GLCM is further normalized and used to calculate a number of statistical measures, describing a studied texture (Haralick et al., Reference Haralick, Shanmugam and Dinstein1973; Longstaff et al., Reference Longstaff, Walker, Walker and Jackway1995; Milosevic et al., Reference Milosevic, Ristanovic, Jelinek and Rajkovic2009; Gebejes & Huertas, Reference Gebejes and Huertas2013). In the analysis of cell nuclei, it is crucial to perform the analysis only on the pixels belonging to the region of interest, i.e., only on the pixels belonging to a nucleus. We used an in-house written code, according to the original paper (Haralick et al., Reference Haralick, Shanmugam and Dinstein1973), which was further specifically adjusted to solve the above problem. We relied on the fact that the nuclei were previously segmented and that the background was set to white. One of the first steps in calculating the GLCM was the quantization of grayscale intensities, where a gray-level scale was divided into a user-defined number of intervals, N g. Upon quantization, only the grayscale intensities belonging to different intervals would be discernable from each other. We reduced the grayscale intensity of all the pixels within the contour delineating the nucleus, including the white and almost white pixels, by 12%. The percentage could be set as a user-defined parameter; however, the current value was appropriate for ten or more grayscale intervals, and we have decided to use 16 + 1 = 17 intervals for all of the images in this study. It was straightforward to discern the surrounding white pixels, as there is a path to the picture edge, consisting entirely of white pixels, for each of these pixels. These were left unchanged, while the pixels of the nuclei were darkened by 12%. Such scaling did not represent a problem, as all of the images were treated in the same manner and the texture statistical properties were calculated from the normalized matrix. In the assembly of the GLCM, the white pixels of the surroundings would be located in the 17th row and 17th column of a 17 × 17 matrix (N g-th row and N g-th column), which were discarded. We kept a 16 × 16 GLCM, corresponding to a nucleus, for each of the images. In this way, we performed highly precise automatic segmentation directly in the color space without the need to actually delineate a nucleus. All of the images were opened automatically, calculations were performed, and results were saved in files. The above-described procedures are illustrated by the central part of Figure 2. We used four values of the displacement angle which are typically considered in GLCM calculations (0°, 45°, 90°, and 135°), corresponding to the pairs of pixels (k,m) and (k + d,m), (k,m) and (k + d,m + d), (k,m) and (k,m + d), and (k,m) and (k–d,m + d), respectively, with arbitrary k and m. The results along the diagonals were interpolated to get all four values at the same spatial distances, i.e., along the circle surrounding the pixel (k,m). We used the displacements from d = 1 px to d = 16 px. Therefore, the obtained GLCM was four-dimensional with entries p(i, j, θ, d) representing the probabilities of gray levels i and j being in a given spatial arrangement. As shown in Figure 5 for an example nucleus, the obtained textural properties were almost orientation independent, allowing us to utilize the averaged data for four angles in the statistical analyses, p(i, j, d). All p(i, j) data were tabulated for d = 1 px, corresponding to adjacent pixels, for the moderate displacement of d = 4 px, as well as for d = 8 px, describing pixels in an image that are relatively far away from each other.

Fig. 5. The four textural features (statistical properties) calculated from the GLCM, for four directions and distances of points from 1 to 16 px, for an example nuclei from the HT/PTC group shown in an inset. (a) Contrast, (b) Correlation, (c) ASM, also known as Energy, and (d) Homogeneity show small relative variations with image orientation but vary with the pixel distances of points, n px. Statistical differences were analyzed for adjacent pixels, moderate distance of points (4 px), as well as the points that are relatively far away from each other (8 px).
Seven of the textural statistical properties were considered as follows. The contrast is a measure of the amount of local gray-level variations present in an image. It is obtained by the following equation:
 $${\rm Contrast}=\sum\limits_{n=0}^{N{\rm g}-\,1} {n^2\left\{{\sum\limits_{i=1}^{N{\rm g}} {\sum\limits_{\,j=1}^{N{\rm g}} {\,p\,\lpar i\comma \;j\rpar } \vert {_{{\vert }i-j{\vert }=n} } } } \right\}}.$$
The correlation is a measure of gray-level linear dependencies in an image. Very often, adjacent pixels have a notable correlation level, and in some cases, moderately displaced pixels can show some correlation too. We have used an expression according to Longstaff et al. (Reference Longstaff, Walker, Walker and Jackway1995):
 $${\rm Correlation}=\sum\limits_{i=1}^{N{\rm g}} {\sum\limits_{\,j=1}^{N{\rm g}} {\displaystyle{{\lpar i-\mu _i\rpar \lpar j-\mu _j\rpar p\,\lpar i\comma \;j\rpar } \over {\sigma _i\,\sigma _j}}} }.$$
In equation (5), averages are denoted by μ, and standard deviations are denoted by σ.
The ASM, also known as energy, is a measure of how locally uniform a texture is, as a large number of small GLCM entries will result in a smaller energy (ASM), and very few dominant gray-level transitions will result in a higher energy (ASM). It is calculated as follows:
 $${\rm ASM}=\sum\limits_{i=1}^{N{\rm g}} {\sum\limits_{\,j=1}^{N{\rm g}} {\,p\,{\lpar i\comma \;j\rpar }^2} }.$$
The homogeneity feature, also known as the inverse difference moment, applies higher weight coefficients to the GLCM diagonal (same gray levels) and lower weights to the GLCM entries away from the diagonal. If the image as a whole has little variation, then the homogeneity is high, and if there is no variation, it equals one. Low homogeneity refers to significant variations in textural elements as well as their spatial arrangements. It is calculated as follows:
 $${\rm Homogeneity}=\sum\limits_{i=1}^{N{\rm g}} {\sum\limits_{\,j=1}^{N{\rm g}} {\displaystyle{{\,p\,\lpar i\comma \;j\rpar } \over {1+{\vert }\,i-j\,{\vert }}}} }.$$
Three types of entropy, as the measures of the randomness of local grayscale intensity, were also calculated. The Entropy feature measures a disorder or complexity in an image. It is large for texturally nonuniform images—complex textures tend to have high entropy. It is calculated as follows:
 $${\rm Entropy}={-}\sum\limits_{i=1}^{N{\rm g}} {\sum\limits_{\,j=1}^{N{\rm g}} {\,p\,\lpar i\comma \;j\rpar \log \lpar p\,\lpar i\comma \;j\rpar \rpar } }.$$
Two other features, Sum Entropy and Difference Entropy, determine the degrees of intensity randomness for the regions of interest corresponding to the fixed sum or fixed absolute value of a difference of two grayscale intensities. The Sum Entropy is calculated as follows:
 $${\rm Sum}\;{\rm Entropy}={-}\sum\limits_{i=2}^{2N{\rm g}} {\,p_{\rm s}\,\lpar i\rpar \log \lpar p_{\rm s}\,\lpar i\rpar \rpar } \comma \;\quad \;p_{\rm s}\,\lpar k\rpar=\left. {\sum\limits_{i=1}^{N{\rm g}} {\sum\limits_{\,j=1}^{N{\rm g}} {\,p\lpar i\comma \;j\rpar } } \,} \right\vert \matrix{ {} \cr {i{\kern 1pt}+j=k} \cr }.$$
The Difference Entropy is calculated as follows:
 $${\rm Difference}\;{\rm Entropy}={-}\sum\limits_{i=0}^{Ng-1} {\,p_{\rm d}\,\lpar i\rpar \log \lpar p_{\rm d}\,\lpar i\rpar \rpar } \comma \;\quad \;p_{\rm d}\,\lpar k\rpar=\left. {\sum\limits_{i=1}^{N{\rm g}} {\sum\limits_{\,j=1}^{N{\rm g}} {\,p\lpar i\comma \;j\rpar } } \,} \right\vert \matrix{ {} \cr {\vert {i{\kern 1pt} -j} \vert=k} \cr }.$$
Statistical Analysis
All statistical analyses were performed by the statistician in our team. We have analyzed 250 segmented nuclei per group (n n = 25 per patient and n p = 10 patients per group). Before performing the statistical analysis of the differences between the investigated groups, the mean values of the parameters were calculated for each patient. After that, the statistical difference between the variables was calculated according to the Student's t-test analysis after testing for normal distribution with the Shapiro–Wilk normality test. For the variables which did not show the Gaussian distribution, Mann–Whitney's U test was used. The difference was considered significant, if p < 0.05. The statistical calculations were performed using GraphPad Prism for Windows (Version 7.0, GraphPad Software, La Jolla, CA, USA). All the results are expressed as median (range).
Results
Histologic Description of HT-Associated PTC and HT-Alone Specimens
Figure 6a represents a photomicrograph of the follicular variant of PTC from the patient with HT (H&E staining). The characteristic light microscopic findings on the particular photomicrograph are the follicular architecture of tissue with nuclear features for PTC. The tissue specimen composed of follicular cells arranged as micro-follicles with central condensed eosinophilic colloid. Additionally, the presence of overlapping, elongated ground glass nuclei with grooves, and pseudoinclusions are observed as well.

Fig. 6. Photomicrographs of the HE-stained thyroid gland sections. Tissues were stained with H&E, and the images were captured under a light microscope with 400× magnifications. (a) A follicular variant of the PTC showing: overlapping elongated ground glass nuclei with numerous grooves (arrowheads) and pseudoinclusions (arrows); (b) a HT specimen showing: lymphocytic infiltrate and atrophic follicles with the abundant Hürthle cells (arrows) and the region of follicular cells (marked with the red line) with reactive nuclear changes, such as grooves (arrowheads) resembling the features of malignant follicular cells in PTC. PTC, papillary thyroid carcinoma; HT, Hashimoto's thyroiditis.
The photomicrograph of the H&E-stained HT tissue excised from the patient with HT is shown in Figure 6b. The tissue section is histologically characterized by extensive lymphocytic infiltrate and atrophic follicles with many Hürthle cells. Additionally, there is a region of follicular cells with reactive nuclear changes, which are similar to nuclear features of malignant follicular cells in PTC. Therefore, it should be pointed out that the differential diagnosis between HT and HT-associated PTC is based on subjective interpretation by an observer, which may be potentially difficult.
Fractal Dimension of HT-Associated PTC and HT-Alone Specimens
To ascertain whether the HT-associated PTC and HT-alone specimens showed a different tissue structure complexity, the FD of follicular cells nuclei was estimated with the box-counting method. The changes in the FD of investigated nuclei are shown in Figure 7a. There was a statistically significant difference (p = 0.0321) in the FD of the chromatin structure between the investigated groups. The FD of nuclei from the HT-associated PTC specimens ranged from 1.599 to 1.650 with a median of 1.631. The median of the r 2 values, which represent the goodness of fit of the regression lines, was also 0.9976 (range 0.9973–0.9981). On the other hand, the median of the FD and r 2 of nuclei from the HT specimens was 1.648 (range 1.608–1.692) and 0.9975 (range 0.9967–0.9986), respectively.

Fig. 7. Chromatin FD (a) and lacunarity (b) of follicular cell nuclei for the HT and HT/PTC groups. Each point corresponds to the mean value of investigated parameters of examined nuclei (n n = 25 per patient) in an individual case (n p = 10 patients per group). Data are represented as median (range). Since the values of studied parameters showed normal distribution based on the assessment with the Shapiro–Wilk normality test, statistical differences between the variables were calculated according to the Student's t-test analysis. PTC, papillary thyroid carcinoma; HT, Hashimoto's thyroiditis.
Lacunarity of HT-Associated PTC and HT-Alone Specimens
The lacunarity as a measure of the size and distribution of gaps, their spatial heterogeneity, and the degree of the image deviation from translational and rotational invariance was measured for each of the studied nuclei micrographs. The resulting values of this parameter are shown in Figure 7b. The lacunarity for nuclei from the HT-associated PTC group [0.307 (0.297–0.322)] was significantly higher (p = 0.0038) when compared with the nuclei from the HT group [0.292 (0.253–0.310)].
GLCM Textural Analysis of HT-Associated PTC and HT-Alone Specimens
To take into account the textural properties of neighboring pixels, pixels that are moderately far away from each other, as well as relatively distant pixels, showing possible characteristics of the images as a whole, we have calculated the four considered features for the pixel distance of 1, 4, and 8 px. The results of the first textural parameter, Contrast, are shown in Figure 8. There was a statistically significant difference for 1 px distance between the HT-associated PTC [2.694 (1.927–3.628)] and HT specimens [(2.355 (2.037–2.669); p = 0.0269] (Fig. 8a). On the contrary, there were no differences in Contrast for 4 px (p = 0.0776) and 8 px (p = 0.0892) between the examined follicular cell nuclei (Figs. 8b, 8c).

Fig. 8. Chromatin Contrast values for 1 px (a), 4 px (b), and 8 px (c) corresponding to the follicular cell nuclei for HT and HT/PTC groups. Each point shows the mean value of the investigated parameter of examined nuclei (n n = 25) in an individual case (n p = 10 patients per group). Data are represented as median (range). Since the values of chromatin Contrast for 1 and 4 px showed normal distribution based on the assessment with the Shapiro–Wilk normality test, statistical differences between the variables were calculated according to the Student's t-test analysis. On the other hand, as values of chromatin Contrast for 8 px did not show normal distribution based on the assessment with the Shapiro–Wilk normality test (p = 0.02 for the HT group), statistical differences between the variables were calculated according to the Mann–Whitney's U test. HT, Hashimoto's thyroiditis; PTC, papillary thyroid carcinoma.
Correlation, as a measure of the linear gray-level reliance between pixels at designated locations relative to each other, was also determined for each nucleus photomicrograph. The changes in this parameter are shown in Figure 9. The Correlation values for 1 px distance from the HT-associated PTC group [0.859 (0.796–0.906)] were significantly higher (p = 0.0479) when compared to the nuclei from the HT group [0.798 (0.697–0.916)] (Fig. 9a). On the other hand, there were no differences in the Correlation for 4 px (p = 0.3938) and 8 px (p = 0.3930) between the investigated samples (Figs. 9b, 9c).

Fig. 9. Chromatin Correlation values for 1 px (a), 4 px (b), and 8 px (c) corresponding to the follicular cell nuclei for HT and HT/PTC groups. Each point shows the mean value of the investigated parameter of examined nuclei (n n = 25) in an individual case (n p = 10 patients per group). Data are represented as median (range). Since the values of chromatin Correlation for 1 and 4 px showed normal distribution based on the assessment with the Shapiro–Wilk normality test, statistical differences between the variables were calculated according to the Student's t-test analysis. On the other hand, as values of chromatin Correlation for 8 px did not show normal distribution based on the assessment with the Shapiro–Wilk normality test (p = 0.02 for the HT/PTC group), statistical differences between the variables were calculated according to the Mann–Whitney's U test. HT, Hashimoto's thyroiditis; PTC, papillary thyroid carcinoma.
The ASM and Homogeneity, as the markers of local and overall homogeneity, were calculated for the examined follicular cell nuclei as well. The results of the ASM showed that there was a statistically significant difference in this parameter for 8 px distance between the HT-associated PTC [0.032 (0.013–0.106)] and HT specimens [0.048 (0.027–0.066); p = 0.0355] (Fig. 10c). On the contrary, Figures 10a and 10b show that there were no differences in the ASM for 1 px (p = 0.1051) and 4 px (p = 0.3396) between the examined specimens. Homogeneity for 1 px (Fig. 11a), 4 px (Fig. 11b), and 8 px (Fig. 11c) was significantly lower in the HT-associated PTC group [0.745 (0.723–0.817), 0.560 (0.515–0.668), and 0.461 (0.417–0.582)] when compared with the HT group [0.794 (0.727–0.842), 0.618 (0.537–0.683), and 0.526 (0.448–0.589); p = 0.0147, p = 0.0162, and p = 0.0117, respectively].

Fig. 10. Chromatin ASM values for 1 px (a), 4 px (b), and 8 px (c) corresponding to the follicular cell nuclei for HT and HT/PTC groups. Each point shows the mean value of the investigated parameter of examined nuclei (n n = 25) in an individual case (n p = 10 patients per group). Data are represented as median (range). Since the values of chromatin Correlation for 4 and 8 px showed normal distribution based on the assessment with the Shapiro–Wilk normality test, statistical differences between the variables were calculated according to the Student's t-test analysis. On the other hand, as values of chromatin Correlation for 1 px did not show normal distribution based on the assessment with the Shapiro–Wilk normality test (p = 0.04 for the HT/PTC group), statistical differences between the variables were calculated according to the Mann–Whitney's U test. HT, Hashimoto's thyroiditis; PTC, papillary thyroid carcinoma.

Fig. 11. Chromatin Homogeneity values for 1 px (a), 4 px (b), and 8 px (c) corresponding to the follicular cell nuclei for HT and HT/PTC groups. Each point shows the mean value of the investigated parameter of examined nuclei (n n = 25) in an individual case (n p = 10 patients per group). Data are represented as median (range). Since the values of chromatin Homogeneity for 4 and 8 px showed normal distribution based on the assessment with the Shapiro–Wilk normality test, statistical differences between the variables were calculated according to the Student's t-test analysis. On the other hand, as the values of chromatin Homogeneity for 1 px did not show normal distribution based on the assessment with the Shapiro–Wilk normality test (p = 0.04 for the HT/PTC group), the statistical differences between the variables were calculated according to Mann–Whitney's U test. HT, Hashimoto's thyroiditis; PTC, papillary thyroid carcinoma.
Finally, we analyzed the Entropy, Sum Entropy, and Difference Entropy of the textures of follicular cell nuclei. The obtained statistically significant differences in Entropy are shown in Figures 12a–12c for the pixel distance of 1, 4, and 8 px, respectively. The results of Sum Entropy comparisons did not show any statistically significant differences, whereas the differences in Difference Entropy were significant for 1 px (Fig. 12g), 4 px (Fig. 12h), and 8 px (Fig. 12i). The variability of Sum Entropy was very pronounced in the HT-associated PTC group. The Entropy and Difference Entropy, for the pixel distance of 1, 4, and 8 px, were significantly higher in all cases for the HT-associated PTC group [6.142 (4.490–7.315), 7.712 (5.441–8.808), and 7.239 (5.730–8.971) and 0.196 (0.150–0.266), 0.238 (0.184–0.302), and 0.254 (0.193–0.300)] in comparison with the HT group [5.082 (3.951–6.483), 5.846 (4.706–7.571), and 5.835 (4.861–7.235), and 0.117 (0.072–0.213), 0.118 (0.078–0.225), and 0.118 (0.076–0.278); p = 0.0087, p = 0.0107, and p = 0.0081, and p = 0.0068, p = 0.0424, and p = 0.0020, respectively].

Fig. 12. Chromatin Entropy, Sum Entropy, and Difference Entropy values. Chromatin Entropy of the follicular cell nuclei for HT and HT/PTC groups is shown for 1 px (a), 4 px (b), and 8 px (c). Sum Entropy for 1 px (d), 4 px (e), and 8 px (f) and Difference Entropy for 1 px (g), 4 px (h), and 8 px (i). Each point shows the mean value of the investigated parameter of examined nuclei (n n = 25) in an individual case (n p = 10 patients per group). Data are represented as median (range). Since the Sum Entropy for 8 px (p = 0.02 for the HT group) and Difference Entropy for 4 px (p = 0.04 for the HT/PTC group) did not show normal distribution based on the assessment with the Shapiro–Wilk normality test, the statistical differences between the variables were calculated according to the Mann–Whitney's U test. In all other cases, data were normally distributed and statistical differences between the variables were calculated according to the Student's t-test analysis. HT, Hashimoto's thyroiditis; PTC, papillary thyroid carcinoma.
Discussion
Since the subjective analysis of microscopic images by an observer can lead to misdiagnosis, one of the most crucial assignments in quantitative pathology is to elaborate an objective and reproducible technique that helps advance diagnosis and prognosis. Quantitative morphologic interpretation of the stained histologic sections or cytologic preparations may be done by basic morphometry and sophisticated texture analysis based on digitalized images (Ferreira et al., Reference Ferreira, de Matos, Adam, Leite and Metze2006; Metze et al., Reference Metze, Lorand-Metze, Leite and Adam2009, Reference Metze, Adam and Florindo2019; Metze, Reference Metze2013). Among these medical image analyses, the fractal and GLCM textural analyses have shown to be of increasing importance particularly for the investigation of various tumor types (Sedivy et al., Reference Sedivy, Windischberger, Svozil, Moser and Breitenecker1999; Dey & Mohanty, Reference Dey and Mohanty2003; Mashiah et al., Reference Mashiah, Wolach, Sandbank, Uziel, Raanani and Lahav2008; Bedin et al., Reference Bedin, Adam, de Sa, Landman and Metze2010; Ferro et al., Reference Ferro, Falconi, Adam, Ortega, Lima, de Souza, Lorand-Metze and Metze2011; Huang et al., Reference Huang, Pan, Chen, Li, Chen, Li, Wang and Chen2012; Jabalee et al., Reference Jabalee, Carraro, Ng, Prisman, Garnis and Guillaud2018; Mambetsariev et al., Reference Mambetsariev, Mirzapoiazova, Lennon, Jolly, Li, Nasser, Vora, Kulkarni, Batra and Salgia2019). It is well known that HT and PTC specimens sporadically share the same morphological features, immunohistochemical staining, and molecular profiles (Arif et al., Reference Arif, Blanes and Diaz-Cano2002; Weetman, Reference Weetman2004; Rhoden et al., Reference Rhoden, Unger, Salvatore, Yilmaz, Vovk, Chiappetta, Qumsiyeh, Rothstein, Fusco, Santoro, Zitzelsberger and Tallini2006; Ohmori et al., Reference Ohmori, Miyakawa, Ohmori and Takano2007; Anand et al., Reference Anand, Singh, Kushwaha, Hussain and Sonkar2014); therefore, the differential diagnosis between the HT-alone and the HT-associated PTC specimens is not always easy, even for a trained observer. In this study, the quantification of the differences between the studied samples was verified for the first time using the FD, lacunarity, and several GLCM textural parameters of the follicular cell nuclei. In contrast with many earlier findings, which have demonstrated a higher chromatin FD in various tumor tissues (Sedivy et al., Reference Sedivy, Windischberger, Svozil, Moser and Breitenecker1999; Dey & Mohanty, Reference Dey and Mohanty2003; Mashiah et al., Reference Mashiah, Wolach, Sandbank, Uziel, Raanani and Lahav2008; Bedin et al., Reference Bedin, Adam, de Sa, Landman and Metze2010; Ferro et al., Reference Ferro, Falconi, Adam, Ortega, Lima, de Souza, Lorand-Metze and Metze2011; Huang et al., Reference Huang, Pan, Chen, Li, Chen, Li, Wang and Chen2012; Jabalee et al., Reference Jabalee, Carraro, Ng, Prisman, Garnis and Guillaud2018; Mambetsariev et al., Reference Mambetsariev, Mirzapoiazova, Lennon, Jolly, Li, Nasser, Vora, Kulkarni, Batra and Salgia2019; Metze et al., Reference Metze, Adam and Florindo2019), the results of our current study showed a lower chromatin FD in tumor tissues than in the corresponding benign tissues. Chromatin is divided into two distinct regions based on the gene density: (i) euchromatin (uncondensed and gene-rich conformation) and (ii) heterochromatin (condensed and gene-poor conformation). Losa (Reference Losa2012) studied the association of chromatin compaction with FD. He demonstrated that increasing chromatin compaction induced increasing chromatin FD. This finding can be explained by the fractal geometry of DNA. During condensation, DNA polymer is repeatedly subjected to the self-similar process of crumpling. Since fractal geometry may be created by iterations (Mandelbrot, Reference Mandelbrot1967), condensation results in a folded polymer with fractal features that increase the chromatin FD. Additionally, Yi et al. (Reference Yi, Stypula-Cyrus, Blaha, Roy and Backman2015) also showed that changes in FD may detect chromatin compaction even before it is visible by the light microscopy. Moreover, the recent transmission electron microscopy research about colorectal cancer (Cherkezyan et al., Reference Cherkezyan, Stypula-Cyrus, Subramanian, White, Dela Cruz, Wali, Goldberg, Bianchi, Roy and Backman2014) presented that the chromatin compaction was elevated in the field of carcinogenesis. Therefore, these observations may explain previous results reported in the literature that showed higher FD in tumor tissues than in corresponding normal tissues. On the other hand, in our current study, the obtained lower chromatin FD of malignant cells (Fig. 7a) may be explained by the molecular description of PTC. Several genetic alterations have been described during the pathogenesis of PTC, including BRAFV600E mutation and rearranged during transfection (RET)/PTC rearrangement (Fischer et al., Reference Fischer, Bond, Taysavang, Battles and Wynford-Thomas1998; de Castro et al., Reference de Castro, Penha, Buexm, de Carvalho, Oliveira, Agarez, Pinto and Carvalho2019). In addition, the most recent study about the clinicopathological and molecular characteristics of HT-associated PTC reported that this tumor tissue form is associated with a low probability of BRAFV600E mutation as well (Molnár et al., Reference Molnár, Molnár, Bedekovics, Mokánszki, Győry, Nagy and Méhes2019). Puppin et al. (Reference Puppin, Passon, Lavarone, Di Loreto, Frasca, Vella, Vigneri and Damante2011) in the study about the levels of histone acetylation in thyroid tumors showed that BRAFV600E mutation was, in fact, associated with the increased global histone acetylation in thyroid tumor tissues and in thyroid cell lines expressing BRAFV600E. The function of histone acetylation and deacetylation in nucleus was summarized by Shahbazian & Grunstein (Reference Shahbazian and Grunstein2007). It was reported that these processes regulate (i) nucleosome assembly, (ii) chromatin condensation and folding, (iii) heterochromatin silencing, and (iv) gene transcription. Additionally, in the same study, authors have also reported that histone acetylation produces changes in the euchromatin/heterochromatin ratio resulting in a more open chromatin. Moreover, Fischer et al. (Reference Fischer, Bond, Taysavang, Battles and Wynford-Thomas1998) have investigated whether RET/PTC rearrangement is sufficient to cause the intriguing nuclear morphological alterations characteristic of PTC. It was demonstrated that the infection of cultures of normal human thyroid cells with a retrovirus vector expressing activated RET/PTC can lead to more open chromatin. Therefore, decreasing chromatin condensation induced by BRAFV600E mutation and RET/PTC rearrangement in malignant follicular cells might be associated with the more open chromatin organization and, thus, lower chromatin FD in PTC specimens. Furthermore, this observed finding demonstrated that the chromatin FD of malignant follicular cells in PTC specimens might detect the levels of BRAFV600E mutation since the structure and function of nuclei interact mutually in a dynamic way. Additionally, de Castro et al. (Reference de Castro, Penha, Buexm, de Carvalho, Oliveira, Agarez, Pinto and Carvalho2019) recently reported that BRAFV600E could be useful as a biomarker of local aggressiveness; therefore, the chromatin FD of follicular cells may be a potential biomarker for diagnosis, progression, and prognosis of PTC in HT specimens as well as in PTC-alone specimens.
Lacunarity is another descriptor for the fractal analysis of chromatin that was also created by Mandelbrot (Reference Mandelbrot1967). The results of the lacunarity calculation (Fig. 7b) demonstrated that the malignant cell nuclei from the HT-associated PTC group had significantly higher values when compared with the benign nuclei from the HT group. In a recent review (Metze et al., Reference Metze, Adam and Florindo2019) on the FD and its complementary parameters for the analysis of chromatin organization, it was reported that increasing chromatin lacunarity was often associated with the decreasing chromatin FD, which was observed in our current study as well. Moreover, the FD and lacunarity of nuclei were reported as the markers of early phase apoptosis before the detection of conventional cell markers (Pantic et al., Reference Pantic, Harhaji-Trajkovic, Pantovic, Milosevic and Trajkovic2012a, Reference Pantic, Pantic and Basta-Jovanovic2012b; Yi et al., Reference Yi, Stypula-Cyrus, Blaha, Roy and Backman2015). The authors have also demonstrated that higher apoptosis levels of cells might be associated with the lower chromatin FD and higher chromatin lacunarity. Accordingly, our obtained findings suggested that malignant follicular cells from the HT-associated PTC specimens showed higher levels of apoptosis compared with benign follicular cells from HT specimens. The recent review study on apoptosis, autophagy, necroptosis, and cancer metastasis (Su et al., Reference Su, Yang, Xu, Chen and Yu2015) suggested that apoptosis may block metastatic dissemination by killing misplaced cells. Thus, higher apoptosis levels in HT-associated PTC could be one of the reasons for the excellent prognosis of this tumor type with a life expectancy similar to the general population. Moreover, the detection of apoptosis with chromatin FD and lacunarity also suggested that these fractal descriptors might be used in the prediction of cancers.
FD and lacunarity may be combined with the GLCM textural analysis that can also quantify the discrete nuclear changes (Gupta et al., Reference Gupta, Gupta, Singh, Gupta and Kudesia2010; Pantic et al., Reference Pantic, Harhaji-Trajkovic, Pantovic, Milosevic and Trajkovic2012a, Reference Pantic, Pantic and Basta-Jovanovic2012b; Vesković et al., Reference Vesković, Labudović-Borović, Zaletel, Rakočević, Mladenović, Jorgačević, Vučević and Radosavljević2018; Paunovic et al., Reference Paunovic, Vucevic, Radosavljevic, Pantic, Veskovic and Pantic2019; Todorovic et al., Reference Todorovic, Dincic, Nesovic Ostojic, Zaletel, Lopicic, Dundjerovic, Tatic, Kovacevic, Paunovic, Puskas and Markovic2019). The results of fractal examinations of follicular cell nuclei from the HT-associated PTC and HT-alone specimens were confirmed by the GLCM textural analysis. The results of this analysis showed a statistically significant difference in chromatin ASM only for 8 px distance (Fig. 10c) as well as the chromatin Homogeneity for all investigated pixel distances (Fig. 11) between the investigated nuclei. Similar to the changes in chromatin FD and lacunarity, Pantic et al. (Reference Pantic, Harhaji-Trajkovic, Pantovic, Milosevic and Trajkovic2012a) demonstrated that the lower of local and overall homogeneity of nuclei (ASM and Homogeneity) can also serve to detect higher levels of apoptosis. Therefore, lower chromatin ASM and Homogeneity of malignant cells from the HT-associated PTC group confirmed the higher levels of apoptosis detected with FD and lacunarity. Both Entropy and Difference Entropy showed a statistically significant increase for the HT-associated PTC group, indicating increased randomness of the visual textures in all six comparisons. In addition, a statistically significant increase in chromatin Contrast (Fig. 8c) and Correlation (Fig. 9c) for only 1 px distance was detected in the HT-associated PTC compared with HT-alone specimens. The obtained findings for Contrast suggested that malignant cell nuclei possessed larger local dynamic variations. At the same time, the increasing chromatin Correlation and its reduced variability indicated the higher degree of similarity of the adjacent pixels in the nuclei from the HT-associated PTC specimens in comparison with the benign follicular cell nuclei.
Conclusion
It could be concluded that the differences between specimens of the HT-associated PTC and HT alone can be identified using the FD, lacunarity, and GLCM parameters, such as Contrast, Correlation, ASM, Homogeneity, Entropy, Sum Entropy, and Difference Entropy, of follicular cell nuclei. These results may have interesting clinical implications. The differences in chromatin FD, lacunarity, and GLCM parameter values may be integrated with other diagnostic methods for the evaluation of the distinctive features between the HT-associated PTC and HT in cytology and surgical pathology specimens. Consequently, the quantification of the differences between the investigated specimens by medical image analyses may exclude the subjective experience of a pathologist. Furthermore, these fractal and textural descriptors may be used to assess the progression and prognosis factors of the PTC due to the possibly discovered different levels of gene mutations and apoptosis of follicular cells in the PTC specimens. This study presents a good starting point for the standardization of fractal analysis and its complementary techniques that can be useful for the diagnosis, prognosis, classifications, and treatment of different tumor types.
Financial support
A.Z.I. acknowledges funding provided by the Institute of Physics Belgrade through the grant by the Ministry of Education, Science, and Technological Development of the Republic of Serbia. This work was also supported by the Ministry of Education, Science and Technological Development of the Republic of Serbia by Projects No. 172023 and III-45003.
Ethical standards
The research protocol was approved by the Ethics Committee of the Faculty of Medicine, University of Belgrade, Belgrade, Serbia (4/1-2006) and fulfills the standards recommended by the Helsinki Convention (Helsinki, Finland).
Conflict of interest
The authors declare that there is no conflict of interest.


 Open access