


Flavanols are a structurally complex subclass of flavonoids that are present in a number of foods such as pome fruits (e.g. apples and pears), legumes, cocoa, tea and wine. Dietary intervention studies have shown that flavanols can have a beneficial effect on vascular function and could, therefore, reduce the risk of CVD( Reference Schroeter, Heiss and Spencer 1 – Reference Ried, Sullivan and Fakler 3 ); indeed, the European Food Safety Authority (EFSA) has recently approved a health claim for flavanols( 4 ). However, flavanols are a complex group of phytonutrients, often considered to include free and gallated flavan-3-ol monomers and oligomeric and polymeric compounds known as proanthocyanidins (PA), as well as other derivatives, such as theaflavins and thearubigins( Reference Santos-Buelga and Scalbert 5 ). These compounds differ considerably not only in their structural and functional properties, but also in their metabolism and bioavailability( Reference Santos-Buelga and Scalbert 5 , Reference Manach, Williamson and Morand 6 ).
While dietary intervention studies have been able to show beneficial effects, results from observational studies have been more ambiguous and inconsistent( Reference Cassidy, Rimm and O'Reill 7 , Reference Cassidy, O'Reilly and Kay 8 ). This can be explained not only by lower intake values in observational studies, but also by differences in the types of flavanols used. Dietary intervention studies have used mainly flavanols derived from specific foods, such as cocoa and grape seed extracts( Reference Feringa, Laskey and Dickson 9 ), and have, therefore, focused on very specific compounds. Conversely, in observational studies, the intake of flavan-3-ols has often been calculated as that of all flavan-3-ols, even though the main contributor to total flavan-3-ol intake in the general public, theaflavins, is found neither in cocoa powder nor in grape seeds.
To investigate the potential health effects of flavanols in the general public and to determine whether results from intervention studies could be translated into dietary recommendations, it is important to obtain accurate information on habitual intake and main dietary sources. However, the information currently available( Reference Chun, Chung and Song 10 – Reference Hertog, Hollman and Katan 15 ) is limited, as it is mainly based on observational studies, which are often not representative of the general public( Reference Cassidy, Rimm and O'Reill 7 , Reference Arts, Hollman and Feskens 14 , Reference Arai, Watanabe and Kimira 16 – Reference Knaze, Zamora-Ros and Lujan-Barroso 23 ). Furthermore, differences in the interpretation of flavan-3-ols in the nomenclature make comparisons difficult. Thus, currently available information on the estimated dietary intake of flavanols varies widely and there is a paucity of reliable information on intake in the general public. Indeed, comprehensive data on flavan-3-ol intake in a representative sample of the European population are currently not available.
New food composition databases on flavonoids developed recently( Reference Neveu, Perez-Jimenez and Vos 24 – 26 ) have opened a new approach for the estimation of dietary flavanol intake and the assessment of potential health benefits. In the present study, we used these databases to develop the FLAVIOLA Flavanol Food Composition Database, containing information on the flavanol content of more than 3000 different foods. Using this database and the recently published Comprehensive European Food Consumption Database, we determined the habitual dietary intake of flavanols in a representative sample of European adults in fourteen European countries.
Subjects and methods
The EFSA Comprehensive European Food Consumption Database is a unique tool that has been built from existing national information on food consumption. Food consumption data for adults aged 18–64 years from twenty-one surveys (approximately 30 000 individuals) are available for fourteen countries( 27 ). Information concerning the methodologies used in each survey is given in Table S1 (available online). Food consumption statistics are reported in g/d and for chronic consumption. For each country, consumption data are given according to the first (twenty categories) and second (140 categories) levels of the FoodEx system and for the total population( 28 ). The hierarchical food classification system ‘FoodEx’, developed by the EFSA, was used to codify all the food items.
To estimate the intake of flavan-3-ols in Europe, we developed the FLAVIOLA Flavanol Food Composition Database containing food composition data for approximately 3000 food items. (More information on the database can be found on the website of the FLAVIOLA project, http://www.flaviola.org) The mean values of each flavan-3-ol compound are reported as mg/100 g of fresh weight of edible portion of food. This database is based on the USDA (US Department of Agriculture) Database for the Flavonoid Content of Selected Foods( 26 ) and the PA Content of Selected Foods( 25 ), expanded with values from the Phenol-Explorer, a comprehensive database on the polyphenol content of foods( Reference Neveu, Perez-Jimenez and Vos 24 ). These databases are the most up-to-date databases on flavonoids and polyphenols and include information on 500, 205 and 456 food items for flavonoids( 26 ), PA( 25 ) and polyphenols( Reference Neveu, Perez-Jimenez and Vos 24 ), respectively.
We expanded and completed the FLAVIOLA Flavanol Food Composition Database using DINER (Data Into Nutrients for Epidemiological Research), a food database created for the EPIC (European Prospective Investigation into Cancer and Nutrition)-Norfolk study( Reference Welch, McTaggart and Mulligan 29 ). The EPIC-Norfolk database was used for the calculation of the estimated flavan-3-ol content of approximately 2500 food items (82 % of the 3000 total foods). The flavan-3-ol content of food preparations was calculated using approximately 800 recipes; retention and cooking factors for approximately 500 food items were used to estimate the effect of processing (e.g. frying, boiling and roasting)( Reference Crozier, Lean and McDonald 30 – Reference Holland, Welch and Unwin 32 ). When information on the ingredients of commercial food products was provided by the manufacturers, their flavan-3-ol content was also calculated; where no information was available, products were matched to similar ones if possible. Food items thought not to contain significant levels of flavanols (fish, meat and eggs) were treated as logical zeros and omitted from the database. Dietary intake was estimated for three major flavan-3-ol subgroups (flavan-3-ol monomers, PA and theaflavins) and their seventeen component flavanols: flavan-3-ol monomers (( − )-epicatechin, ( − )-epicatechin-3′-gallate, (+)-catechin, ( − )-epigallocatechin, ( − )-epigallocatechin-3′-gallate, (+)-gallocatechin and (+)-catechin-3′-gallate); theaflavins (theaflavin, thearubigins, theaflavin-3,3′-digallate, theaflavin-3′-gallate and theaflavin-3-gallate); PA (dimers, trimers, tetramers–hexamers, heptamers–decamers and >decamers).
The intake of flavan-3-ols was calculated based on the consumption data for each of the 140 categories of the second level of the FoodEx system. As many categories contain more than one flavan-3-ol-containing food, a weighted average was used to determine the flavan-3-ol content in each of these categories. Using a weighted average was necessary, because rarely consumed foods with high flavan-3-ol-content, for example, some berries, in a category could result in an overestimation of intake. The weighing factors were determined using the FAO food balance sheets for the year of the survey and the frequency of food consumption from the EPIC-Norfolk study (see Table S2, available online). The total flavan-3-ol content of each category was calculated as the sum of the products of the weighing factor and flavan-3-ol content of each individual food included in the respective category.
The estimated mean and median values of flavan-3-ol intake, as well as a range of minimum and maximum values, based on the reported upper and lower ranges of food composition are reported. Values given in further tables are based on mean intake values to allow for comparison with other studies. The European countries represented in the EFSA comprehensive database were grouped into regions to allow for observations in each distinctive area (Southern: Italy, Spain and France; Central: Belgium, Czech Republic, Germany, Hungary, Ireland, Latvia, The Netherlands and UK; Northern: Denmark, Finland and Sweden). Unless indicated otherwise, all the data are given as the mean daily intake of respective flavan-3-ols.
Results
Estimated daily flavan-3-ol intake
The estimated mean and median daily intakes (mg/d) of total flavanols as well as of their subgroups for adults in the European Union (EU) are given in Table 1 and Fig. 1. The mean intake of total flavan-3-ols ranged from 181 mg/d (Czech Republic) to 793 mg/d (Ireland), whereas the median intake ranged from 5 mg/d (Belgium) to 702 mg/d (Ireland). The average intake of flavan-3-ols was 369 mg/d in the EU. The mean intake of the different flavan-3-ol groups was 77 mg/d for monomers, 123 mg/d for PA and 168 mg/d for theaflavins. The highest intake of monomers was observed in Ireland (191 mg/d) and the lowest in Spain (24 mg/d). The intake of theaflavins was highest in Ireland (505 mg/d) and lowest in Spain (9 mg/d). In contrast, the daily intake of PA was highest in Spain (175 mg/d) and lowest in The Netherlands (96 mg/d). The estimated mean and median intakes (mg/d) of total flavan-3-ols and flavan-3-ol subgroups for adults in the three European regions are summarised in Table 2. The mean intake of total flavan-3-ols was 241 mg/d in the Southern region, 449 mg/d in the Central region and 283 mg/d in the Northern region.
Table 1 Estimated mean and median flavan-3-ol intakes (mg/d) for adults in the EFSA (European Food Safety Authority) Comprehensive European Food Consumption Database
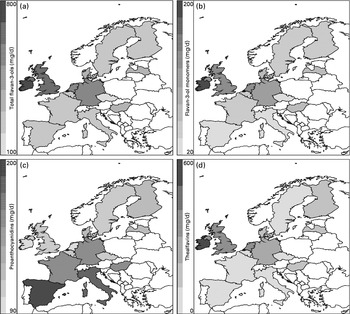
Fig. 1 Estimated intakes (mg/d) of (a) total flavan-3-ols, (b) flavan-3-ol monomers, (c) proanthocyanidins and (d) theaflavins in the European Union.
Table 2 Estimated mean and median flavan-3-ol intakes (mg/d) for adults in the three European regions in the EFSA (European Food Safety Authority) Comprehensive European Food Consumption Database*
* Southern: Spain, France and Italy; Central: Belgium, Czech Republic, Germany, Hungary, Ireland, Latvia, The Netherlands and UK; Northern: Denmark, Finland and Sweden.
The mean daily intake of individual monomers, PA and theaflavins and their quantitative contribution to total intake are given in Table 3 and Fig. 2. Theaflavins were the major contributors to total flavan-3-ol intake (46 %) in the EU, followed by PA (34 %) and monomers (21 %). The main flavan-3-ol groups in the Southern region were PA (67 %), whereas in the Central and Northern regions, theaflavins were the main contributors (52 and 40 %, respectively). The individual compounds with the highest intakes were thearubigins (43 %) and PA polymers (11 %), followed by PA (tetramers–hexamers) (8 %). This pattern was similar for the Central and Northern regions, whereas in the Southern region, PA polymers were the main contributors to flavan-3-ol intake (22 %).
Table 3 Contribution of individual flavan-3-ols and subgroups of flavan-3-ols to total intake in the EFSA (European Food Safety Authority) Comprehensive European Food Consumption Database for adults
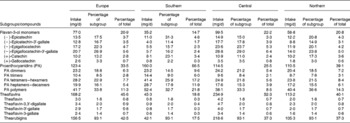
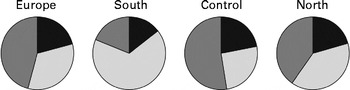
Fig. 2 Relative contribution of flavan-3-ol subgroups to total flavan-3-ol intake in Europe and the Southern, Central and Northern subregions. ![]() , Flavan-3-ol monomers;
, Flavan-3-ol monomers; ![]() , proanthocyanidins;
, proanthocyanidins; ![]() , theaflavins.
, theaflavins.
Major dietary flavan-3-ol sources
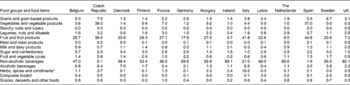
The main sources of dietary total flavan-3-ols in the EU were tea (62 %), pome fruits (11 %), berries (3 %), cocoa products (3 %) and stone fruits (3 %) (Table 4). Tea was the main contributor to monomer intake (75 %), followed by pome fruits (6 %), whereas pome fruits were the main sources of PA (28 %). Table 5 summarises the contributions of the main food groups to flavan-3-ol intake by country. The main sources of total flavan-3-ols were non-alcoholic beverages (46 % in France to 89 % in Ireland), with tea being the major source for most countries. Fruits were the main contributors to flavan-3-ol intake in Italy and Spain (42 and 45 % of total intake, respectively). Alcoholic beverages were also an important source of flavanols in some other countries, with wine being the main contributor to total flavan-3-ol intake within the group of alcoholic beverages.
Table 4 Major food sources of dietary total and individual flavan-3-ols in the EFSA (European Food Safety Authority) Comprehensive European Food Consumption Database
* Small fruits according to the definition used by the EFSA in the FoodEx system: azarole (Mediterranean medlar); bearberries; bilberries or whortleberries; blackberries; blueberries; boysenberries; cloudberries; cranberries; crowberries; currants (red, black and white); dewberries; elderberries; gooseberries; huckleberries; jabuticabas; lingonberries; loganberries; mulberries; physalis; raspberries; rose hips; salmonberries; sea buckthorns; strawberries; strawberry trees; table grapes; thimbleberries; wine grapes; wineberries.
Table 5 Relative contribution of the main food groups to total flavan-3-ol intake by countries in adults
* Dietary assessment is unsuitable to measure the intake values for herbs, spices and condiments accurately, and these values are, therefore, likely to be subject to a larger error than values for other food groups.
† Composite foods according to the definition used by the EFSA (European Food Safety Authority) in the FoodEx system include the following: cereal-based dishes; rice-based meals; potato-based dishes; bean-based meals; meat-based meals; fish- and seafood-based meals; vegetable-based meals; egg-based meals; mushroom-based meals; ready-to-eat soups and prepared salads.
The main food sources of flavan-3-ols in the Southern region were fruits (38 %) and non-alcoholic beverages (23 %) (Table 6 and Fig. 3). In the Central region, non-alcoholic beverages were the major source of total flavan-3-ols (62 %), followed by fruits (19 %). Non-alcoholic beverages were also the main contributors to total flavan-3-ol intake in the Northern region (56 %), with fruits making a significant contribution to flavan-3-ol intake (24 %). The difference in intakes between European regions was due to variations in tea consumption. The major source of total flavan-3-ols within the group of fruits was pome fruits in all the regions; however, the other important sources of flavan-3-ols varied according to region. In the Southern region, stone fruits were the second most important source of flavan-3-ols, whereas in the Northern region, berries were the second most significant source of flavan-3-ols within the group of fruits.
Table 6 Relative contribution (%) of food groups and some main foods to the intake of total flavan-3-ols and groups of flavan-3-ols by European region
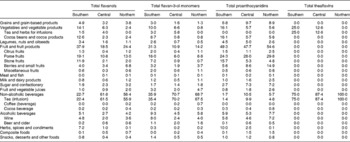
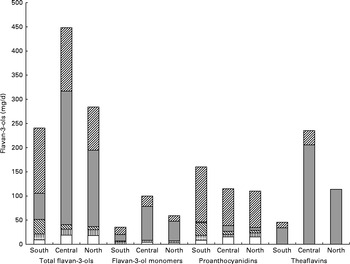
Fig. 3 Contribution of individual food groups to the intake of total flavan-3-ols and subgroups in the Southern, Central and Northern subregions. ![]() , Fruit and vegetables;
, Fruit and vegetables; ![]() , tea;
, tea; ![]() , cocoa products;
, cocoa products; ![]() , alcoholic beverages;
, alcoholic beverages; ![]() , other foods.
, other foods.
Discussion
In the present study, we estimated the habitual intake of flavan-3-ols and their major food sources in the adult European population. An important strength is the FLAVIOLA Flavanol Food Composition Database, which has been developed for the present study: it is based on an amalgamation of the most recent food composition data from the USDA Database and those from the Phenol-Explorer( Reference Neveu, Perez-Jimenez and Vos 24 – 26 ), augmented by data from the EPIC-Norfolk food database, DINER( Reference Welch, McTaggart and Mulligan 29 ), which provides information on recipes and processing effects. With more than 3000 food items, the FLAVIOLA database is one of the most comprehensive food composition databases for flavanols available. The provision of upper and lower estimates of intake based on the variability of food composition data (see Table S3, available online) allows for a better assessment of the likely range of intake values, in particular, to investigate potential health effects and make future recommendations.
There exist some methodological limitations that have to be taken into consideration when interpreting the results. The EFSA provides intake data for food groups, but not for individual foods, and thus food balance sheets and other information had to be used to address this gap and to improve the usability of the data available. Furthermore, differences in the dietary assessment methods (see Table S1, available online) are likely to introduce a certain degree of bias. Food records and 24 h recalls, the methods used in the present study, can result in over- and under-reporting of the intake of individual food items and thus in systematic bias. Calibration studies to adjust for this, as used, for example, in the EPIC study( Reference Kaaks and Riboli 33 , Reference Slimani, Kaaks and Ferrari 34 ), have not been conducted so far, but would be important to make better use of the data available. An additional limitation is the data available on food composition: these data are often based on a fairly small number of analysis reports and thus the paucity of standardised and fully validated analytical methods( Reference Manach, Williamson and Morand 6 , Reference Robbins, Leonczak and Li 35 ) introduces additional variability. There is also limited information available on food preparation methods, which is, in particular, important for foods such as tea, for which brewing time and preparation method may affect the flavan-3-ol content. In the absence of such information, the average food composition value is used.
Despite these limitations, the present study provides the most accurate data on flavan-3-ol intake in the EU that are currently available and, for the first time, allows to estimate the exposure of the European population to flavan-3-ols and to investigate the potential impact on health. A key strength of the present study is based on the fact that the food consumption data used emanated from representative surveys of the European population, thus reducing the selection bias often found in observational studies.
A comparison between flavanol intake values determined in the present study and data from other investigations is challenging, because of a significant divergence in the interpretation and application of flavanol nomenclature. The intake of flavan-3-ols in the EU determined in the present study was 77 mg/d, which is lower than the values reported for the USA (157 mg/d)( Reference Chun, Chung and Song 10 , Reference Wang, Chung and Song 13 ), Japan (380 mg/d)( Reference Otaki, Kimira and Katsumata 36 ) and Australia (422 mg/d)( Reference Johannot and Somerset 11 ). However, the data obtained from Australia and the USA, but not from Japan, include those on theaflavins, flavanol derivatives mainly found in tea. The combined intake of flavan-3-ol monomers and theaflavins in Europe was 245 mg/d and thus higher than that in the USA. Differences in the interpretation of the nomenclature can, therefore, result in the over- or underestimation of intake. Within Europe, the highest intakes of total flavan-3-ols (monomers, PA and theaflavins) were observed in the Central region due to the high intake of tea, especially in countries with a tea culture, such as the UK and Ireland (600 and 793 mg/d, respectively). Similar results were obtained in the EPIC study, where the highest intake was found in a UK cohort (408 mg/d)( Reference Knaze, Zamora-Ros and Lujan-Barroso 23 ), even though total intake was lower than that in the present study, which can be explained by differences in the study population and dietary assessment methods.
For individual subclasses of flavanols also, there were differences with regard to previously reported data: for example, in a representative sample of the Dutch population, flavanol monomer intake was 56 mg/d( Reference Arts, Hollman and Feskens 14 ), which is lower than the values obtained both in the present study and at the EPIC centres of The Netherlands (139 and 89 mg/d, respectively)( Reference Knaze, Zamora-Ros and Lujan-Barroso 23 ). However, this study included an age range (1–93 years) that was wider than that used in both the EPIC study (35–74 years) and the present study (18–64 years). Furthermore, the study relied on food composition data for only a limited number of foods, whereas both the EPIC study and the present study used more comprehensive databases. The intake of PA in the present study was lower than that in the EPIC study (e.g. in the UK: 109 v. 198 mg/d)( Reference Arts, Hollman and Feskens 14 ), and this could be explained by differences in the dietary patterns of participants of observational studies and a representative survey. The main sources of PA in both EPIC study and the present study were pome fruits. However, there were differences in other major sources, supporting different dietary patterns as an explanation for differences observed: while wine and stone fruits were important contributors to total intake in the EPIC study, berries and cocoa products were important contributors in the present study. Differences have also been observed in Scandinavian countries: the intake of flavan-3-ols in Denmark in the present study was almost twice that reported in the EPIC-Denmark study (203 v. 106 mg/d)( Reference Knaze, Zamora-Ros and Lujan-Barroso 23 ), whereas that of PA was much lower (116 v. 237 mg/d). Results from the representative Danish Household Consumption Survey( Reference Johannot and Somerset 11 , Reference Justesen, Knuthsen and Leth 12 ) indicate an average flavan-3-ol intake of 148 mg/d; however, the present study used older data and the lower intake might be explained by differences in the food composition tables used. In countries of the Southern region (France, Italy and Spain), PA were the most important contributors to total flavanol intake. Although the amount of flavan-3-ols consumed was similar in the present study and other studies such as the EPIC study( Reference Knaze, Zamora-Ros and Lujan-Barroso 23 ) and the French SU.VI.MAX (Supplementation en Vitamines et Minéraux Antioxydants) study( Reference Perez-Jimenez, Fezeu and Touvier 37 ), there were some discrepancies in the main sources. The EPIC study identified red wine and tea as the main sources of monomers in Spain, while the present study found pome fruits and cocoa products to be the major sources. A possible explanation for this discrepancy is the circumstance that data for the EPIC study had been collected 10 years earlier and dietary habits might have changed.
When stratified by regions, the intake of flavanols in the Central region was approximately 2-fold higher than that in the Southern region (451 and 242 mg/d, respectively). Conversely, the intake of PA was found to be higher in the Southern region due to the higher intake of fruits. The main source of PA in the Southern region was pome fruits, similar to what was reported in the EPIC study( Reference Knaze, Zamora-Ros and Lujan-Barroso 23 , Reference Zamora-Ros, Andres-Lacueva and Lamuela-Raventos 38 ). The major sources of flavan-3-ols were similar for the Central and Northern regions, with tea being the main source, while in the Southern region, fruits, mainly pome and stone fruits, were the main sources. However, in the Southern and Central regions, the main source of flavan-3-ols within the group of fruits was pome fruits, while in the Northern region, berries were the most significant source. The main flavan-3-ol groups in the Southern region were PA (66 %), whereas in the Central and Northern regions, theaflavins were the most important sources (52 and 40 %, respectively). Monomers contributed 15 % in the Southern region, 23 % in the Central region and 21 % in the Northern region.
A comparison of the mean and median intakes of flavan-3-ols indicated large differences in the distribution of intakes in different countries. Median intake was lower for all the compounds, indicating a skewed distribution, but this difference was smallest in the Central region. The largest difference was found for theaflavins. While the difference between the mean and median intakes of flavan-3-ols and those of monomers in Ireland was approximately 10 %, it was almost 100-fold in Germany (504 v. 6 mg/d for total flavan-3-ols and 111 v. 1·1 mg/d for monomers); this is probably due to a large variation in tea consumption in Germany. For nutrients with a very skewed distribution of intake, a comparison of median and mean values is very important to avoid the over- or underestimation of exposure.
The dietary data obtained in the present study allow for a comparison of habitual intake in the general public with the amounts used in dietary intervention studies and thus the investigation of the potential impact of flavan-3-ol consumption on public health. However, flavan-3-ols used in many dietary intervention studies are not well characterised by compound-specific analyses and are mainly non-specifically described by their source, e.g. cocoa and grape seed extracts. Thus, in the absence of well-characterised foodstuffs and plant extracts, the absolute and relative content of individual flavanols is often not known( Reference Schroeter, Heiss and Spencer 1 ). Therefore, to facilitate meaningful outcome assessments, it is crucial to analytically characterise foods used in dietary interventions and to provide specific information with regard to the content and chemical identity of compounds hypothesised to be bioactive. Nevertheless, even the EFSA-approved health claim for cocoa flavanols( 4 ) – based on an unspecified increase of flow-mediated dilation – only refers to ‘cocoa flavanols with a degree of polymerisation (DP) from 1 to 10’. As gallated compounds are not present in cocoa( 25 , 26 ), this apparently only includes epicatechin and catechin monomers, but food processing and other factors can result in epimerisation and may also affect the DP, all of which can affect bioavailability and bioactivity( Reference Ottaviani, Momma and Heiss 39 , Reference Ottaviani, Kwik-Uribe and Keen 40 ). Similar difficulties apply to grape seed extracts, where there is a paucity of information apart from food composition data (epicatechin, epicatechin-3′-gallate, catechin and PA (dimers–hexamers)), even though differences in extraction procedures will lead to a significant variance in flavan-3-ol content. Applying the definition provided above, it was found that the intake of cocoa flavanols in Europe varied from 84 mg/d (Sweden) to 138 mg/d (Spain), with an average value of 105 mg/d, an amount well below that used in many intervention studies (mean 550 mg/d( Reference Ried, Sullivan and Fakler 3 ); Fig. 4). The intake of grape seed flavanols was lower, with an average value of 98 mg/d (70 mg/d in the Czech Republic to 132 mg/d in Ireland), which is also well below the amount used in intervention studies (150–2000 mg/d( Reference Feringa, Laskey and Dickson 9 )). Thus, on the one hand, it seems that the intake of flavan-3-ols in Europe is well below the intake levels thus far established in the context of dietary interventions to be required to observe beneficial cardiovascular effects. Moreover, most Europeans consume less than 50 % of the 200 mg of cocoa flavanols per d considered by the EFSA to be sufficient for improved vascular function and less than 25 % of the 400 mg/d required to observe a reduction of systolic blood pressure( Reference Hooper, Kay and Abdelhamid 41 ). On the other hand, only the intake of one member of the cocoa flavanol group, namely ( − )-epicatechin, has thus far been reported to be directly and causally linked to the modulation of vascular function (flow-mediated dilation)( Reference Schroeter, Heiss and Balzer 42 , Reference Loke, Hodgson and Proudfoot 43 ) Recent data also demonstrate that while ( − )-epicatechin is absorbed and present as a phase II metabolite in the systemic circulation, the absorption of procyanidins (DP 2–10) in humans is negligible and that these compounds do not contribute to the systemic pool of flavanol metabolites( Reference Ottaviani, Kwik-Uribe and Keen 40 ). Thus, if one were to interpret the opinion of the EFSA on cocoa flavanols based on the intake of ( − )-epicatechin alone, the intake of 200 mg of cocoa flavanols (DP 1–10) would deliver between 15 and 25 mg of ( − )-epicatechin, an amount that many Europeans already consume as part of their daily diet, thus weakening the arguments for food benefit claims at intake levels of 200 mg/d. Nevertheless, various other questions and knowledge gaps exist in this context (influence of age, sex, dietary background and ethnicity on flavanol intake/benefits), and further research is necessary before the results from controlled interventions studies can be meaningfully translated into the context of primary prevention, public health and evidence-based dietary recommendations. Such efforts will require not only a more consistent application of flavanol nomenclature and a better characterisation of foods used in dietary interventions, but also improved methods for dietary assessment, such as nutritional biomarkers. Only a combination of data from intervention studies and those from observational studies will ultimately enable a comprehensive assessment of the impact of flavan-3-ol intake on public health.
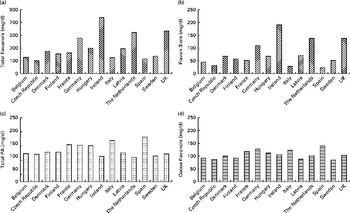
Fig. 4 Estimated mean intake (mg/d) of (a) total flavanols, (b) flavan-3-ols, (c) total procyanidins (PA) and (d) cocoa-flavanols (( − )-epicatechin, (+)-catechin and PA (dimers–decamers)) for adults in the EFSA (European Food Safety Authority) Comprehensive European Food Consumption Database.
Supplementary material
To view supplementary material for this article, please visit http://dx.doi.org/10.1017/S0007114513003930
Acknowledgements
The authors thank all the EPIC-Norfolk study participants and staff for their contribution to the study. They also thank the members of the FLAVIOLA consortium for their critical review of the manuscript.
The present study was supported by the EU (grant 226588, ‘Flaviola’) and an unrestricted grant from Mars, Inc. Mars, Inc. had no role in the design and analysis of the study or in the writing of this article.
The authors' contributions are as follows: A. V. conducted the research, analysed the data and wrote the article; A. A. M., R. N. L. and M. A. H. L. conducted the research, analysed the data and contributed to manuscript preparation; C. H., M. K., M. W. M., J. P. E. S. and H. S. analysed the data and contributed to manuscript preparation; G. G. C. K. wrote the manuscript and had primary responsibility for the final content. All authors read and approved the final manuscript.
H. S. is employed by MARS, Inc., a member of the FLAVIOLA research consortium and a company engaged in flavanol research and flavanol-related commercial activities. None of the other authors has a conflict of interest to declare.


