


Implications
Phosphorus is essential for health, milk production and reproduction of dairy cows but contributes to environmental pollution when excreted. In plant seeds, P is mainly stored as phytate, but phytate degradation and, thus, availability of P in the rumen vary widely between different feeds. Data on ruminal phytate degradation of feeds commonly fed to dairy cows improves diet calculations contributing to an adequate P supply of the animals. In the future, the data base on ruminal phytate degradation can be further increased when near-infrared spectroscopy is used to predict phytate concentrations instead of elaborate chemical analysis.
Introduction
An adequate supply of P is essential to ensure health and performance of dairy cows. However, faecal P excretion increases with P intake in a linear manner (Wu et al., Reference Wu, Satter, Blohowiak, Stauffacher and Wilson2001), and P concentrations in the diet exceeding the animals’ requirement lead to increased faecal P excretion. Phosphorus losses can contribute to eutrophication of natural waters (Desmit et al., Reference Desmit, Thieu, Billen, Campuzano, Dulière, Garnier, Lassaletta, Ménesguen, Neves, Pinto, Silvestre, Sobrinho and Lacroix2018) and, thus, excessive P supply in animal nutrition has to be avoided.
In plant seeds and by-products, P is contained predominantly as phytate (any salt of phytic acid; myo-inositol 1,2,3,4,5,6-hexakis (dihydrogen phosphate); InsP6). Rumen microorganisms show substantial phytase activity (Yanke et al., Reference Yanke, Bae, Selinger and Cheng1998) which enables the hydrolytic cleavage of P bound in InsP6 (InsP6-P) and subsequent P absorption in the intestine. However, results of studies examining total tract disappearance of InsP6 are inconsistent. While several studies found only low faecal InsP6 excretion of about 5% of ingested InsP6 (e.g. Morse et al., Reference Morse, Head and Wilcox1992; Ray et al., Reference Ray, Jarrett and Knowlton2013), others reported higher proportions of InsP6 excreted (e.g. Haese et al., Reference Haese, Müller, Steingass, Schollenberger and Rodehutscord2014: up to 15%; Kincaid et al., Reference Kincaid, Garikipati, Nennich and Harrison2005: more than 20% of ingested InsP6). Some of the observed differences can likely be explained by the wide variation of feed ingredients used in the diets. Earlier in vitro and in situ studies have shown that progression and extent of ruminal InsP6 disappearance differ between feedstuffs. In rapeseed meal (RSM), InsP6 disappearance proceeded slowly compared to maize (Haese et al., Reference Haese, Lengowski, Gräter, Föll, Möhring, Steingass, Schollenberger and Rodehutscord2017a), soybean meal (SBM) and wheat (Haese et al., Reference Haese, Möhring, Steingass, Schollenberger and Rodehutscord2017b), leading to a lower effective InsP6 degradation of RSM in the rumen compared to SBM (Park et al., Reference Park, Matsui, Konishi, Sung-Won, Yano and Yano1999). However, data on effective degradation of InsP6 (InsP6ED) in common feeds for cattle are rare to date. Thus, the first objective of the present study was to determine InsP6ED from different single feeds used in cattle feeding. Furthermore, we determined InsP6ED of compound feeds (CF) to assess if InsP6 degradation values from single feeds are additive in CF. This would allow for calculations of InsP6ED for any compound feed if respective values are given for the utilised single feeds. Increased data on the ruminal availability of InsP6-P from different feeds may allow for more precise calculation of dietary P supply of dairy cows in the future.
In situ studies to determine InsP6ED provide a large number of samples to be analysed for inositol phosphates (InsPs). Most commonly, high-performance ion chromatography (HPIC) with gradient elution or similar chromatography is used to separate InsPs and their isomers in feeds (Blaabjerg et al., Reference Blaabjerg, Hansen-Møller and Poulsen2010). However, this technique is laborious and costly and is not established as a routine method for common feed analysis. Hence, faster and easier methods for analysis of InsP6 would be beneficial to increase the data base of ruminal InsP6 degradation of feeds. Various studies showed that near-infrared spectroscopy (NIRS) can be used to predict the concentration of InsP6 (Zhao et al., Reference Zhao, Xu, Li, Li, Chen, Liu and Zhu2017) and InsP6-P (Tahir et al., Reference Tahir, Shim, Ward, Westerhaus and Pesti2012; Aureli et al., Reference Aureli, Ueberschlag, Klein, Noël and Guggenbuhl2017), while studies that applied this technique to in situ samples were not reported. However, for cereal grains, NIRS has been successfully used to predict CP and starch in bag residues after ruminal incubation (Krieg et al., Reference Krieg, Koenzen, Seifried, Steingass, Schenkel and Rodehutscord2018a). Hence, the second objective of this study was to establish calibrations to predict the InsP6 concentration of feeds and ruminally incubated bag residues using NIRS. In order to examine the suitability of NIRS estimations for the usage in in situ studies, InsP6ED calculated from NIRS-derived InsP6 concentrations was compared to those calculated from chemically analysed InsP6 concentrations of the samples.
Material and methods
Samples and incubations
Samples of single and compound feeds and their respective bag residues originated from an in situ study described in detail by Grubješić et al. (Reference Grubješić, Titze, Krieg and Rodehutscord2019). Nine single feeds (maize, wheat, barley, faba beans, soybeans, SBM, RSM, sunflower meal (SFM), dried distillers’ grains with solubles (DDGS)) and two CF (CF1, CF2) composed of different amounts of these single feeds were used for analysis of InsPs. Compound feed 1 consisted of 10% maize, 46% barley, 16% faba beans, 18% soybeans, 5% SBM and 5% DDGS, while CF2 contained 32% maize, 12% wheat, 16% faba beans, 8% SBM, 17% RSM, 10% SFM and 5% DDGS (values on DM basis). The CF were produced in a commercial feed mill as described in detail by Grubješić et al. (Reference Grubješić, Titze, Krieg and Rodehutscord2019). In brief, single feeds were ground through a 3 mm sieve and mixed into the CF. Subsequently, one portion of the compound feed was pelleted at 50°C to 60°C (exit temperature 80°C to 90°C). For the in situ incubations of CF1 and CF2, samples were taken before (Mash) and after pelleting (Pellet).
The ruminal incubation followed the procedure of Seifried et al. (Reference Seifried, Steingass, Hoffmann and Rodehutscord2017) and was also described in detail by Grubješić et al. (Reference Grubješić, Titze, Krieg and Rodehutscord2019). In brief, feed samples were ground to pass a 2 mm sieve and 8 g were weighed into polyester bags (10 × 20 cm, pore size 50 μm, ANKOM Technology, USA) with 3 to 5 replicates per sample, incubation time and animal. The bags were incubated in the rumen of three rumen-fistulated Jersey cows for 2, 4, 8, 16, 24, 48 and 72 h and washed in a washing machine after incubation. Values for incubation time 0 h were gained by washing three replicates of each feed sample in the washing machine without ruminal incubation. For analysis, the dried replicates were weighed and pooled per feed sample, incubation time and animal.
Chemical analysis
Dry matter of feed samples and bag residues was analysed according to the official methods used in Germany (Verband Deutscher Landwirtschaftlicher Untersuchungs- und Forschungsanstalten, 2007). Analysis of InsP6 and isomers of lower InsPs (myo-inositol pentakisphosphate (InsP5), myo-inositol tetrakisphosphate (InsP4) and myo-inositol trisphosphate (InsP3)) was performed as described by Zeller et al. (Reference Zeller, Schollenberger, Kühn and Rodehutscord2015) with slight modifications regarding sample size and agent used for extraction. In brief, 0.1 g of the sample was extracted for 30 min with 1.0 ml of an extracting agent (0.2 Mol ethylenediaminetetraacetate and 0.1 Mol NaF, pH 8.0) on a rotary shaker. After centrifugation, the supernatant was removed, preserved on ice and the residue re-suspended with 0.5 ml extracting agent and extracted again for 30 min. The supernatants of both extraction steps were merged, filtered and centrifuged. Filtrates were analysed by HPIC (ICS-3000, Fa. Dionex, Idstein, Germany) and UV detection at 290 nm.
Calculations
For each feed, degradation parameters a (%; rapidly disappearing fraction), b (%; potentially degradable fraction), a + b (%; maximum degradation/plateau) and c (%/h; degradation rate) of InsP6 were calculated based on HPIC-derived InsP6 concentrations using the equations described by Orskov and McDonald (Reference Orskov and McDonald1979) (equation (1)) and McDonald (Reference McDonald1981) (equation (2)).
 $${\rm{Deg}} = a + b \times (1 - {e^{ - {\rm{ct}}}})$$
 $${\rm{Deg}} = a + b \times \left( {1 - {e^{ - {\rm{c(t}} - {\rm{L)}}}}} \right)\quad {\rm{for }}\,t \> {\rm{L}}$$
where Deg (%) is the ruminal degradation of InsP6 after t h and L represents lag time. Using the GraphPad Prism software (Version 5.0 for Windows, GraphPad Software, CA, USA), the best fitting model for each feed was selected based on the Akaike Information Criterion. For estimation of degradation values, estimations of fraction a and fraction a + b were constrained to 0 and 100%, respectively. The degradation parameters of InsP6 were then used to calculate the InsP6ED at ruminal outflow rates of k = 5 (InsP6ED5) or 8 (InsP6ED8) %/h with either
 $${\rm{Ins{P_6}ED}} = a + \left[ {(b \times c)/(c + k)} \right]$$
according to Orskov and McDonald (Reference Orskov and McDonald1979) or
 $${\rm{Ins{P_6}ED}} = a + \left[ {(b \times c)/(c + k)} \right]\;{e^{ - k{\rm{L}}}}$$
according to Wulf and Südekum (Reference Wulf and Südekum2005).
For the CF, the degradation parameters and InsP6ED values were additionally calculated from the observed values of single feeds as described by Grubješić et al. (Reference Grubješić, Titze, Krieg and Rodehutscord2019) using
 $$\displaylines{
{\rm{dC}}{{\rm{F}}_{({\rm{1}},{\rm{2}})}}{\rm{calc}} = [\left( {{\rm{dS}}{{\rm{F}}_{\rm{1}}} \times {w_{\rm{1}}}} \right) + \left( {{\rm{dS}}{{\rm{F}}_{\rm{2}}} \times {w_{\rm{2}}}} \right) + \cdots \cr
+ \left( {{\rm{dS}}{{\rm{F}}_i} \times {w_i}} \right)]{\rm{/100}}\; \cr} $$
$$\displaylines{
{\rm{dC}}{{\rm{F}}_{({\rm{1}},{\rm{2}})}}{\rm{calc}} = [\left( {{\rm{dS}}{{\rm{F}}_{\rm{1}}} \times {w_{\rm{1}}}} \right) + \left( {{\rm{dS}}{{\rm{F}}_{\rm{2}}} \times {w_{\rm{2}}}} \right) + \cdots \cr
+ \left( {{\rm{dS}}{{\rm{F}}_i} \times {w_i}} \right)]{\rm{/100}}\; \cr} $$dCF(1,2)calc = calculated degradation characteristics (a, b, c, lag, InsP6ED5, InsP6ED8) of CF1 or CF2
dSFi = observed degradation characteristics (a, b, c, lag, InsP6ED5, InsP6ED8) of single feed i
w i = weighted InsP6 contribution of single feed i to total InsP6 pool of CF1 or CF2
Degradation parameters and InsP6ED were calculated for each cow separately, using cow as experimental unit in statistical analysis.
Near-infrared spectroscopy
Because the number of feeds used in this study was relatively low for developing NIRS calibrations for InsP6, values of samples from earlier in situ studies were added to the data pool. All additional data originated from studies where different feeds were ruminally incubated and analysed for InsP6 concentrations using HPIC as described before. The additional data included values for barley, maize, rye, triticale and wheat (Seifried et al., Reference Seifried, Steingass, Schipprack and Rodehutscord2016 and Reference Seifried, Steingass, Hoffmann and Rodehutscord2017; Krieg et al., Reference Seifried, Steingass, Hoffmann and Rodehutscord2017) and four RSM samples (Haese et al., Reference Haese, Krieg, Seifried, Schollenberger, Steingass and Rodehutscord2017c). Different combinations of samples were tested for the establishment of calibrations in order to compare the performance of local calibrations (including only one type of feed, e.g. cereal grains) with global calibrations (including all feed types) and to achieve the overall best performance. A total of seven data sets was created using different combinations of feeds and corresponding bag residues:
Data set 1: all values for feeds and bag residues of the present study
Data set 2: all values for feeds and bag residues of the present study and the additional studies (Seifried et al., Reference Seifried, Steingass, Schipprack and Rodehutscord2016 and Reference Seifried, Steingass, Hoffmann and Rodehutscord2017; Haese et al., Reference Haese, Krieg, Seifried, Schollenberger, Steingass and Rodehutscord2017c; Krieg et al., Reference Krieg, Seifried, Steingass and Rodehutscord2017)
Data set 3: data set 2, but excluding all values for rye and triticale
Data set 4: only values for feeds and bag residues from grain samples of the present study and the additional studies
Data set 5: data set 2, but excluding all values for grain samples
Data set 6: data set 2, but excluding all values for CF
Data set 7: data set 2, but excluding all values for CF and grain samples.
Number of samples used for calibration and validation data sets are shown in Table 1.
Table 1 Number (n) of feed samples used for calibration development and validation. Mean and range of chemically analysed phytate (InsP6) concentration of feeds and bag residues after in situ incubation`
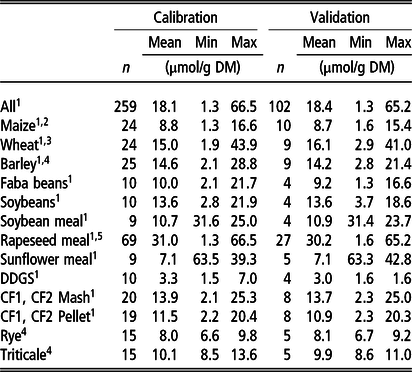
Min = minimum value; Max = maximum value.
Samples of 1the present study, 2Seifried et al. (Reference Seifried, Steingass, Schipprack and Rodehutscord2016) 3Seifried et al. (Reference Seifried, Steingass, Hoffmann and Rodehutscord2017) 4 Krieg et al. (Reference Krieg, Seifried, Steingass and Rodehutscord2017), 5Haese et al. (Reference Haese, Krieg, Seifried, Schollenberger, Steingass and Rodehutscord2017c).
DDGS = dried distillers’ grains with solubles; CF1 = compound feed 1 (containing 10% maize, 46% barley, 16% faba beans, 18% soybeans, 5% soybean meal, 5% DDGS on DM basis); CF2 = compound feed 2 (containing 32% maize, 12% wheat, 16% faba beans, 8% soybean meal, 17% rapeseed meal, 10% sunflower meal, 5% DDGS on DM basis).
Spectra were recorded in duplicate from 680 to 2500 nm (SpectraStar 2500X, Software: Unity InfoStar Version 3.11.1, Unity Scientific, Brookfield, CT). Additionally, spectra of an internal standard as well as external standards (US-STDS-0001 – STD, Wavelength cert, R99 and US-STDS-0003 – STD, Wavelength cert, R99/Poly; Unity Scientific, Brookfield, CT) were recorded throughout the measurements. Mathematical treatment of the spectra and calibrations computation were carried out using the software Ucalibrate (Version: 3.0.0.23; Unity Scientific, Brookfield, CT). The spectra were averaged per sample, and the averaged spectrum of each sample was mathematically pre-treated by standard normal variates and detrending. Derivations of the spectra were computed using a derivation gap and smoothing steps of eight. The derivation option varied between no derivation and first- or second-order derivation. Subsequently, the spectra were used for calibration calculation. The samples were split into a calibration and a validation set for each feed type as outlined in Table 1, attempting to include the whole range of InsP6 concentrations in both calibration and validation sets.
Three wavelength segments were compared: (1) the complete recorded spectrum (680–2500 nm), (2) the recorded spectrum constricted for 50 nm from the beginning and the end (730 to 2450 nm) and (3) the segment of 1250 to 2450 nm. Segment 2 was used to eliminate possible drifts near the limit of the detection. Segment 3 was used because most N–H and C–H bonds are known to be located in this area and because the protein and InsP6 concentration correlated in RSM and SBM after ruminal in situ incubation (Haese et al., Reference Haese, Möhring, Steingass, Schollenberger and Rodehutscord2017b). Each of the three wavelength segments was combined with each derivation, resulting in nine calibrations per data set. Stepwise forward partial least squares (PLS)-regression was used to compute calibrations. Number of groups for cross validation (CV) varied, depending on the number of samples in the calibrations. The T-limit for outlier detection was set to 2.5 (predicted v. reference value), and global distance limit was set to 13.
Calibration evaluation was carried out using the standard error of calibration (SEC) and the standard error of prediction (SEP) as a measure for the accuracy of the calibration (Bellon-Maurel et al., Reference Bellon-Maurel, Fernandez-Ahumada, Palagos, Roger and McBratney2010). Coefficients of determination (predicted v. reference) were also considered. The performance of the calibrations was further evaluated using the bias, the intercept and the slope of the validation step. The target values were zero for the bias and the intercept and one for the slope.
To evaluate the suitability of NIRS as alternative method to HPIC in in situ experiments, InsP6ED was additionally calculated based on NIRS predicted InsP6 concentrations of the feeds and bag residues according to equations 1 to 4 (InsP6ED NIRS). The InsP6 concentrations were predicted using the most accurate calibration and data set. These InsP6ED values were then compared to InsP6ED values deduced from InsP6 concentrations measured using HPIC (InsP6ED HPIC).
Statistical analysis
Degradation parameters a, b, c and lag as well as InsP6ED values were statistically analysed with the SAS MIXED procedure (SAS System for Windows, Version 9.4, SAS Institute, Cary, NC, USA). For single feeds, a one-factorial approach with the following model was used:
 $${Y_{ij}}{\rm{ = }}\mu {\rm{ + }}{A_i}{\rm{ + S}}{{\rm{F}}_j}{\rm{ + }}{e_{ij}}$$
with Y ij as responsive mean, μ as overall mean, A i as random effect of animal (i = 1, 2, 3), SFj as fixed effect of single feed (j = maize, wheat, barley, faba beans, soybeans, SBM, RSM, SFM, DDGS) and e ij as residual error.
Compound feeds were analysed in a two-factorial approach with the model:
 $${Y_{ij}} = \mu + {A_i} + {\rm{C}}{{\rm{F}}_j} + {T_k} + {\rm{C}}{{\rm{F}}_j}{{\rm{T}}_k} + {e_{ijk}}$$
where CFj is the fixed effect of compound feed (j = CF1, CF2), T k is the fixed effect of type (k = Mash, Pellet, Calculated), and CFjT k is the interaction of CFj and T k. Data are presented as least-squares means (LS means) and pooled standard error of the means (pooled SEM).
For comparison of the InsP6ED values based on chemical and NIRS derived InsP6 concentrations also a two-factorial approach was used:
 $${y_{i{\rm{,}}j{\rm{,}}k}} = \mu + {A_i}{\rm{ + }}{M_j} + {F_k} + {M_j}{F_k} + {e_{ijk}}$$
where M j is the method used to determine InsP6 concentration (j = HPIC, NIRS), F k the feed (k = maize, wheat, barley, faba beans, soybeans, SBM, RSM, SFM, DDGS, CF1 Mash, CF2 Mash, CF1 Pellet, CF2 Pellet), and MjFk is the interaction of Mj and Fk.
Statistical significance was declared at P < 0.05 for all models. Following a significant F value, t-tests were performed to show individual significant differences between means.
Results
Concentrations of inositol phosphates in single and compound feeds
The concentration of InsP6 varied from 7.0 µmol/g DM (4.6 g/kg DM) to 49.9 µmol/g DM (32.9 g/kg DM) between the examined feeds (Table 2), with the lowest InsP6 concentrations in DDGS and cereal grains (7.0 to 12.4 µmol/g DM; 4.6 to 8.2 g/kg DM) and the highest in RSM and SFM (36.5 and 49.9 µmol/g DM; 24.1 and 32.9 g/kg DM, respectively). The InsP6 concentrations in CF1 (Mash and Pellet) were considerably lower compared to CF2.
Table 2 Concentrations of phytate (InsP6) and myo-inositol pentakisphosphate (InsP5) in the examined single and compound feeds1(µmol/g DM and g/kg DM)
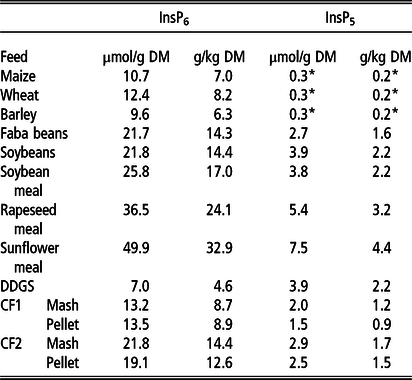
DDGS = dried distillers’ grains with solubles; CF1 = compound feed 1 (containing 10% maize, 46% barley, 16% faba beans, 18% soybeans, 5% soybean meal, 5% DDGS on DM basis); CF2 = compound feed 2 (containing 32% maize, 12% wheat, 16% faba beans, 8% soybean meal, 17% rapeseed meal, 10% sunflower meal, 5% DDGS on DM basis).
*Below limit of quantification, approximate value (mean between limit of detection and limit of quantification).
1 Chemical composition of the feeds besides inositol phosphates published by Grubješić et al. (Reference Grubješić, Titze, Krieg and Rodehutscord2019).
In cereal grains, only traces of InsP5 were determined (below limit of quantification, approximately 0,3 µmol/g DM). In the other feeds, InsP5 concentrations ranged from 1.5 µmol/g DM to 7.5 µmol/g DM (Table 2). The highest InsP5 concentrations were determined in RSM and SFM (5.4 and 7.5 µmol/g DM, respectively). Concentrations of InsPs lower than InsP5 overall were very low and only for DDGS slightly above the quantification limit (1.4 µmol/g DM InsP4 and 1.5 µmol/g DM InsP3, data not shown).
Degradation parameters and effective degradation of phytate from single feeds
Ruminal degradation parameters a, b and c differed significantly between the single feeds and ranged from 0% (RSM) to 77% (DDGS) for fraction a, from 22% (DDGS) to 100% (RSM) for fraction b and from 7.3%/h (RSM) to 28.2%/h (SFM) for degradation rate c (Table 3). The InsP6ED also varied widely between feeds for both calculated passage rates and was highest for faba beans, maize and DDGS (InsP6ED5: 93, 93 and 92%; InsP6ED8: 91, 90 and 89%, respectively), followed by soybeans, wheat and barley (InsP6ED5: 89, 82, 80%; InsP6ED8: 85, 76, 74%, respectively; Table 3). In the oilseed meals, InsP6ED was lowest with values for InsP6ED5 and InsP6ED8 of 76 and 66% for SBM, 75 and 65% for SFM and 59 and 48% for RSM, respectively. A significant lag time was only calculated for SBM (3.6 h) and SFM (3.1 h).
Table 3 Ruminal degradation parameters and effective degradation of phytate (InsP6) for single feeds (n = 3 animals)

a = rapidly degradable fraction (%); b = potentially degradable fraction (%); c = degradation rate of b (%/h); lag = lag time (h); InsP6ED = effective degradation (%) of InsP6 at a passage rate of 5 (InsP6ED5) and 8 (InsP6ED8) %/h.
DDGS = dried distillers’ grains with soluble.
Different superscripts within a row indicate significant differences.
Degradation parameters and effective degradation of phytate from compound feeds
In CF, fraction a was significantly higher for both CF Pellets compared to their respective Mash (CF1: 71 v. 56%, CF2: 56 v. 38%; Table 4). The same was observed for InsP6ED5 (CF1: 91 v. 86%, CF2: 85 v 80%) and InsP6ED8 (CF1: 88 v. 81%, CF2: 80 v. 72%). For fraction c, no interactions between feed and type existed, but the degradation rate was significantly higher for CF2 compared to CF1 (17.5 v. 11.2%/h). Calculated values for fraction a, InsP6ED5 and InsP6ED8 did not differ from observed values for CF1 Mash but were lower than the observed values of CF1 Pellet. For CF2, calculated values for fraction a, InsP6ED5 and InsP6ED8 were lower than the observed values of CF2 Mash and CF2 Pellet.
Table 4 Ruminal degradation parameters and effective degradation of phytate (InsP6) for compound feeds (CF1/2 Mash, CF1/2 Pellet and CF1/2 Calculated, n = 3 animals)

a = rapidly degradable fraction (%); b = potentially degradable fraction (%); c = degradation rate of b (%/h); lag = lag time (h); InsP6ED = effective degradation (%) of InsP6 at a passage rate of 5 (InsP6ED5) and 8 (InsP6ED8) %/h.
CF1 = compound feed 1 (containing 10% maize, 46% barley, 16% faba beans, 18% soybeans, 5% soybean meal, 5% dried distillers’ grains with solubles (DDGS) on DM basis); CF2 = compound feed 2 (containing 32% maize, 12% wheat, 16% faba beans, 8% soybean meal, 17% rapeseed meal, 10% sunflower meal, 5% DDGS on DM basis).
CF Calculated = ruminal degradation parameters and effective degradation of InsP6 calculated from single feeds.
Different superscripts within a row indicate significant differences.
Concentrations of lower inositol phosphates after different incubation times
Isomers of InsP5 were detected in the bag residues of all incubated feeds except for maize. Concentrations of InsP5 in the bag residues during the course of incubation are shown in Figure 1. Compared to the concentrations in the feeds, the InsP5 concentrations in the bag residues initially increased for wheat, barley, RSM, SFM and CF2 Mash after 2 or 4 h but decreased quickly afterwards. Only traces of InsP5 were detected in the bag residues after 16 h (wheat, barley, soybeans, faba beans, DDGS) or 24 h of incubation (SBM, RSM, SFM, CF1, CF2). Inositol phosphates lower than InsP5 were only found in the form of InsP4 in the bag residues of SFM (after 2 and 4 h) and RSM (after 4 h of incubation), but the concentrations were negligible (data not shown).

Figure 1 Concentrations of myo-inositol pentakisphosphate (InsP5; μmol/g DM) in the bag residues of in situ incubated single and compound feeds at different incubation times (n = 3 animals; DDGS = dried distillers’ grains with solubles; CF1 = compound feed 1 (containing 10% maize, 46% barley, 16% faba beans, 18% soybeans, 5% soybean meal, 5% DDGS on DM basis); CF2 = compound feed 2 (containing 32% maize, 12% wheat, 16% faba beans, 8% soybean meal, 17% rapeseed meal, 10% sunflower meal, 5% DDGS on DM basis).
Near-infrared spectroscopy calibrations
The calibration based on data set 7 showed the highest R 2 values and the lowest error measurements (Table 5, Figure 2). For all data sets, the first derivation of the spectra showed the best performance. With the exception of data set 4, the calibration based on the wavelength segment of 1250 to 2450 nm was chosen for all data sets as the best performing one. Deviation of the prediction from the chemically determined InsP6 concentration against the predicted value was homogeneously distributed across the whole range of predictions (Figure 2). The InsP6 concentrations of feeds and bag residues derived from data set 7 were then used to calculate InsP6ED NIRS for comparison with InsP6ED HPIC (Table 6). Significant differences in InsP6ED values occurred for some feeds. For wheat, barley and CF1 Mash, InsP6ED8 NIRS was up to 10 percentage points higher compared to InsP6ED8 HPIC. On the other hand, InsP6ED8 NIRS for maize, SBM and SFM was up to 16 percentage points lower compared to InsP6ED8 HPIC. For the other feeds (faba beans, soybeans, RSM, DDGS, CF1 Pellet, CF2 Mash and CF2 Pellet), InsP6ED NIRS and InsP6ED HPIC did not differ significantly.
Table 5 Performance of different calibrations for estimating the phytate (InsP6) concentration of single feeds, compound feeds and their bag residues after ruminal in situ incubation; cross-validation groups: 5

D,G,S = Derivation, Gap, Smooth; R 2 = squared correlation coefficient; SEC = Standard Error of Calibration; SEP = Standard Error of Prediction; data set 1: all values for feeds and bag residues of the present study; data set 2: all values for feeds and bag residues of the present study and the additional studies (Seifried et al., Reference Seifried, Steingass, Schipprack and Rodehutscord2016 and Reference Seifried, Steingass, Hoffmann and Rodehutscord2017; Haese et al., Reference Haese, Krieg, Seifried, Schollenberger, Steingass and Rodehutscord2017c, Krieg et al., Reference Krieg, Seifried, Steingass and Rodehutscord2017); data set 3: data set 2, but excluding all values for rye and triticale; data set 4: only values for feeds and bag residues from grain samples of the present study and the additional studies; data set 5: data set 2, but excluding all values for grain samples; data set 6: data set 2, but excluding all values for compound feeds; data set 7: data set 2, but excluding all values for compound feeds and grain samples.
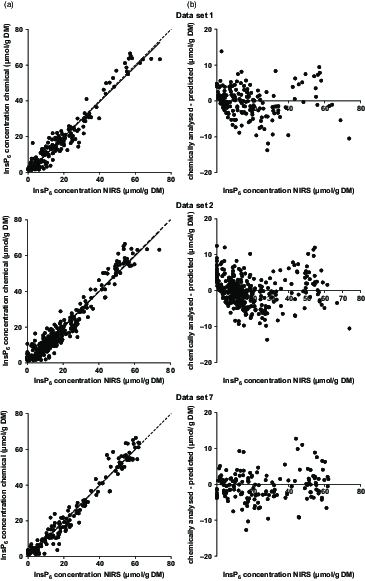
Figure 2 (a) Phytate (InsP6) concentrations (predicted with near-infrared spectroscopy (NIRS) vs. chemically analysed) in samples from in situ studies based on data sets 1, 2 and 7, the corresponding regression line (solid line) and the bisectrix (dashed line). (b) Difference between NIRS predicted and chemically analysed InsP6 concentrations in samples of in situ studies. Negative values were treated as zero.
Table 6 Effective degradation of phytate (InsP6) at a passage rate of 5 (InsP6ED5) and 8 (InsP6ED8) %/h calculated from InsP6 concentrations predicted with near-infrared spectroscopy (NIRS) or chemically (HPIC) analysed

DDGS = dried distillers’ grains with solubles; CF1 = compound feed 1 (containing 10% maize, 46% barley, 16% faba beans, 18% soybeans, 5% soybean meal, 5% DDGS on DM basis); CF2 = compound feed 2 (containing 32% maize, 12% wheat, 16% faba beans, 8% soybean meal, 17% rapeseed meal, 10% sunflower meal, 5% DDGS on DM basis).
Different superscripts within a row indicate significant differences.
Discussion
Phytate degradation from single feeds
The wide variation in InsP6ED between the examined feeds proves the necessity to evaluate the ruminal degradation of InsP6 individually for single feeds. The results showed that even when feeds are categorised in legume seeds (faba beans, soybeans), cereals (maize, wheat, barley) and oilseed meals (SFM, SBM, RSM), InsP6ED varies widely within these categories. For unprocessed feeds, the extent of ruminal InsP6 degradation seems to be influenced mainly by localisation and binding of InsP6 in the seeds (Haese et al., Reference Haese, Lengowski, Gräter, Föll, Möhring, Steingass, Schollenberger and Rodehutscord2017a and Reference Haese, Möhring, Steingass, Schollenberger and Rodehutscord2017b). However, the effects of genotype and harvest year on InsP6 degradation of legume seeds and cereal grains have not yet been studied. As variation of ruminal CP degradation between barley (ED8: 69% to 80%; Krieg et al., Reference Krieg, Seifried, Steingass and Rodehutscord2018b) and wheat (ED8: 72% to 80%; Seifried et al., Reference Seifried, Steingass, Hoffmann and Rodehutscord2017) genotypes has been observed, this might also apply to ruminal InsP6 degradation. In a previous study, we examined the correlation between CP and InsP6 disappearance for different feeds and found high coefficients of determination for the linear regressions (R 2 ≥ 0.93 for oilseed meals, R 2 = 0.83 for wheat; Haese et al., Reference Haese, Möhring, Steingass, Schollenberger and Rodehutscord2017b). Therefore, factors influencing ruminal CP degradation might also affect ruminal InsP6 degradation.
For processed feeds such as oilseed meals, processing conditions seem to have a major influence on the extent of ruminal InsP6 degradation and might explain the relatively low InsP6ED of SBM and RSM compared to other studies. In the studies of Konishi et al. (Reference Konishi, Matsui, Park, Yano and Yano1999) and Park et al. (Reference Park, Matsui, Konishi, Sung-Won, Yano and Yano1999), InsP6ED8 was 59% for RSM and 74% for SBM, while in the present study, InsP6ED8 was only 48% for RSM and 66% for SBM. Heat treatment seems to have a major influence on InsP6ED, as additional heating of meals for 3 h at different temperatures (133°C, 143°C, 153°C) reduced InsP6ED8 for both RSM (46%, 42%, 14%) and SBM (65%, 57%, 45%; Konishi et al. (Reference Konishi, Matsui, Park, Yano and Yano1999)). Steingass et al. (Reference Steingass, Kneer, Wischer and Rodehutscord2013) and Broderick et al. (Reference Broderick, Colombini, Costa, Karsli and Faciola2016) found considerable variation of ruminal degradability of CP in RSM from different oil mills and explained these observations with different heating procedures during toasting. Because disappearance of CP and InsP6 is correlated in oilseed meals (Haese et al., Reference Haese, Möhring, Steingass, Schollenberger and Rodehutscord2017b), it is likely that ruminal InsP6 degradation in RSM and SBM also depends on the production process and thus differs between meals from different processing plants. The same might apply to SFM where, to the best of the authors’ knowledge, data on ruminal InsP6 degradation have not yet been published.
As no accumulation of InsP3-5 was observed for any incubated feed, it can be assumed that InsP6 is completely dephosphorylated once this process has begun on an InsP6 molecule. For poultry, it has been shown that, even when phytase is supplemented to the feed, InsP6 is not completely dephosphorylated in the precaecal part of the digestive tract (Sommerfeld et al., Reference Sommerfeld, Schollenberger, Kühn and Rodehutscord2018). In ruminants, however, the in vitro study of Brask-Pedersen et al. (Reference Brask-Pedersen, Glitsø, Skov, Lund and Sehested2011) as well as the in situ study of Haese et al. (Reference Haese, Möhring, Steingass, Schollenberger and Rodehutscord2017b) suggested that the crucial step in InsP6 degradation is the cleavage of the first phosphate group and hydrolysis of InsP5 and lower InsPs follows soon after. This is consistent with the results of the present study and can probably be assumed for all feedstuffs as a quite broad range of feeds was examined. Still little is known about phytase-producing bacteria and their specific phytases, but Nakashima et al. (Reference Nakashima, McAllister, Sharma and Selinger2007) found two different phytase sequences in the rumen bacterium Selenomonas lacticifex and suggested that in this bacterium multiple phytate degrading enzymes are present. Furthermore, Li et al. (Reference Li, Huang, Zhao, Meng, Zhao, Shi, Yang, Luo, Wang and Yao2014) found that phytase-producing microorganisms did not constantly secrete functional phytases, when rumen samples gained at different times after feeding were analysed. This indicates that in the rumen various phytases are available at any time leading to complete hydrolysis of InsP6, whereas in non-ruminants, where diets are usually supplemented with only one specific phytase, lower InsPs do accumulate.
Additivity of phytate degradation of compound feeds and pelleting effect
Compound feeds are often pelleted, hence it is of practical value if InsP6ED can be calculated from that of single feeds. Calculated InsP6ED underestimated observed InsP6ED of both CF1 Pellet (InsP6ED5: 4, InsP6ED8: 6 percentage points) and CF2 Pellet (InsP6ED5: 8, InsP6ED8: 11 percentage points). This suggests that, at present, InsP6ED of CF cannot be calculated reliably with sufficient precision from values of single feeds. As the difference between calculated and observed values of InsP6ED was smaller for CF1, the precision of the calculation could depend on the single feeds used. So far, CF are mainly used to supply energy and CP, and their contribution to P supply has not yet been of major interest. However, depending on the constituent single feeds its contribution can be relevant, and gaining an estimate of the availability of this P source is an improvement towards precise calculation of diets. Thus, further research is required on this topic as we examined only two different CF in the present study.
Both CF1 Pellet and CF2 Pellet showed higher InsP6ED values compared to the respective Mash (CF1: InsP6ED5: 5, InsP6ED8: 7 percentage points; CF2: InsP6ED5: 5; InsP6ED8: 8 percentage points). This effect was also observed for effective degradation of CP in CF1 and CF2 (Grubješić et al., Reference Grubješić, Titze, Krieg and Rodehutscord2019). As degradation rate c was not affected by pelleting, this effect can probably be ascribed to the increase of fraction a after pelleting (CF1: 15, CF2: 18 percentage points). A higher proportion of finer particles was measured after pelleting of CF1 and CF2 (Grubješić et al., Reference Grubješić, Titze, Krieg and Rodehutscord2019), and it can be concluded that the increased InsP6ED in pelleted feeds derived from fine particles which were prone to leave the bag undegraded and thus increased fraction a. As mentioned before, heat treatment at high temperatures usually impairs ruminal InsP6 degradation. Pelleting proceeded at a temperature of 50°C to 60 °C, and the exit temperature of the pellets was 80°C to 90 °C. Either this temperature was not sufficient to facilitate any structural changes decreasing InsP6 degradation or the changes in particle size distribution covered this effect.
Prediction of phytate concentrations using near-infrared spectroscopy
The performance of the calibration based on data set 7 yielded the highest R 2 in the validation step and the lowest SEP of all calibrations. Thus, the difference between the chemically analysed and NIRS predicted InsP6 concentrations were overall lower for data set 7 than for the other calibrations (Figure 2). However, the bias and intercept were higher for data set 7 calibrations than for the other sets. When regressions were calculated between the error of InsP6 predictions and the predicted InsP6 concentrations, slopes were not significant in any case. This implies that the error of the prediction did not depend on the InsP6 concentration of the sample. This, in turn, means that the prediction of InsP6 concentrations is possible with similar accuracy for feed samples and bag residues, where InsP6 concentrations are distinctly lower due to ruminal incubation.
Overall, the performance of calibrations in the present study was not as good as the performance of calibrations for the prediction of CP concentrations in similar samples (Krieg et al., Reference Krieg, Koenzen, Seifried, Steingass, Schenkel and Rodehutscord2018a). For most of the data sets, the wavelength segment of 1250 to 2450 nm was selected for prediction of CP and InsP6 concentration. The aforementioned correlation between CP and InsP6 concentration in different feeds (Haese et al., Reference Haese, Möhring, Steingass, Schollenberger and Rodehutscord2017b) and the preference for the same wavelength segments support the theory of InsP6 being indirectly predicted from CP. Since InsP6 and CP concentrations are correlated but do not change directly proportional, this theory would also explain the lower performance of InsP6 calibrations compared to the calibrations for predicting CP concentration.
The improvement of the performance of the calibrations by exclusion of cereal grains and CF suggests that strong matrix effects exist between cereal grain samples and protein feeds. No clear separation of spectra from cereal grain samples and their incubation residues from the other samples was visible (principal component analysis plot, data not shown, MATLAB, Fathom Toolbox; Jones (Reference Jones2014)). However, the decrease in the SEP and the increase in the R 2 upon exclusion of grain samples suggest that separate calibrations for cereal grains and protein-rich feeds should be further worked on. Assumedly, the matrix effects occur due to different interactions between InsP6 and CP in cereal grains and protein feeds which result in differing degradation kinetics of CP and InsP6. This probably leads to changes in the relations between InsP6 and CP concentrations of feeds and bag residues which might affect protein-rich feeds to a different extent than cereal grains. Together with the previously assumed indirect prediction of InsP6 by CP, this could lead to a less favourable performance of global calibrations. This theory is supported by the relatively homogenous distribution of the samples in the PCA plot. A separation of grain samples based on the error of the prediction could be expected based on the comparison of the InsP6ED values, but was not given for any of the calibrations (Figure 2). The comparison of InsP6ED NIRS with InsP6ED HPIC also indicates that the NIRS prediction of InsP6 concentrations is not yet sufficiently accurate. While no differences between InsP6ED NIRS and InsP6ED HPIC were observed for some feeds, InsP6ED NIRS was considerably lower (e.g. 16 percentage points for SFM) or higher (e.g. 10 percentage points for wheat) for other feeds. This underlines the need for more data to develop suitable calibrations.
The authors are not aware of any study that reported calibrations to predict InsP6 concentrations in ruminally incubated samples. However, calibrations do exist to predict InsP6-P concentration in poultry feeds (Tahir et al., Reference Tahir, Shim, Ward, Westerhaus and Pesti2012; Aureli et al., Reference Aureli, Ueberschlag, Klein, Noël and Guggenbuhl2017). Values of the present study expressed as InsP6-P ranged from 0.23 to 12.12 g/kg, which is in a similar range as the values of Tahir et al. (Reference Tahir, Shim, Ward, Westerhaus and Pesti2012) and Aureli et al. (Reference Aureli, Ueberschlag, Klein, Noël and Guggenbuhl2017). In the study of Tahir et al. (Reference Tahir, Shim, Ward, Westerhaus and Pesti2012), the R 2 of the validation step ranged from 0.67 (maize) to 0.94 (wheat shorts) and the SEP from 0.09 g/kg (SBM) to 0.23 g/kg (maize, DDGS). Recalculation of the SEP in the present study to g/kg InsP6-P resulted in slightly higher SEP values between 0.7 and 1.0 g/kg. Calibrations of Aureli et al. (Reference Aureli, Ueberschlag, Klein, Noël and Guggenbuhl2017) were based on a slightly bigger range of reference InsP6-P concentrations (0.2 to 14.1 g/kg) and showed a comparable R 2 (0.94) and SEP (0.67 g/kg) than most of the calibrations of the present study. The slightly higher SEP values observed here are probably due to the more heterogeneous sample material (feeds and bag residues after different incubation times) compared to calibrations comprising only feedstuffs. Besides the establishment of local calibrations, the usage of other chemometric techniques than PLS might help to improve the accuracy of the prediction. First trials with data of the present study utilising artificial neural networks instead of PLS to predict InsP6 concentrations delivered promising results and should be further investigated. Overall, the calibrations that were established in the present study demonstrate that InsP6 can be predicted by NIRS in incubated samples of in situ studies as well as in feeds. However, the results also show that the used database needs to be expanded to achieve sufficient performance of the calibrations for the use in in situ studies.
The results of the present study indicate that the availability of InsP6-P should be evaluated individually for feeds. However, to broaden the data base on ruminal InsP6 degradation of different feeds establishing a fast and easy method for analysis of InsP6 is a decisive factor. Predicting InsP6 concentrations in feeds and bag residues using NIRS proved to have the potential to simplify the analytical step of InsP6 in future in situ studies.
Acknowledgements
Doctoral scholarships of the Faculty of Agricultural Sciences of the University of Hohenheim and the H. Wilhelm Schaumann Stiftung for Goran Grubješić are gratefully acknowledged. The authors are grateful to Raiffeisen Kraftfutterwerk (RKW) Kehl for providing single feeds samples and facilities for mixing and pelleting of CF.
E. Haese 0000-0001-7795-1750
J. Krieg 0000-0002-6614-1442
G. Grubješić 0000-0002-5007-6973
M. Rodehutscord 0000-0003-3156-7889
Declaration of interest
The authors have no conflicts of interest to declare.
Ethics statement
The conduction of the study was in accordance with the German animal welfare regulations. Housing, diets and incubation procedure were approved by the Regierungspräsidium Stuttgart (Germany, approval code V319/14 TE).
Software and data repository resources
None of the data were deposited in an official repository.


 Open access