


1. INTRODUCTION
Mineral dust (aerosols) plays an important role in the climate system by altering the radiative balance of the atmosphere both directly by scattering and absorbing solar and terrestrial radiation and indirectly by affecting cloud microphysical properties (Choobari and others, Reference Choobari, Zawar-Reza and Sturman2014; Mahowald and others, Reference Mahowald2014). Insoluble dust can be extracted from snow/ice on high-altitude mountains and Antarctica and Greenland at high latitudes. Such sites provide the most valuable clues regarding the atmospheric circulation patterns of previous glacial-interglacial climate cycles (Mayewski and others, Reference Mayewski1997; Thompson and others, Reference Thompson2000; Lambert and others, Reference Lambert, Bigler, Steffensen, Hutterli and Fischer2012). In addition, such data contribute to the documentation of changes in continental evolution, iron inputs to the ocean and anthropogenic pollutant emissions (Wolff and others, Reference Wolff2006; McConnell and Edwards, Reference McConnell and Edwards2008; Sugden and others, Reference Sugden, Mcculloch, Bory and Hein2009). The effect of dust is now recognised as one of the major uncertainties of climate change and has been the subject of numerous studies (Durant, and others, Reference Durant, Harrison, Watson and Balkanski2009). Atmospheric transport models coupled with global circulation models (GCM), which are used for weather forecasting, have been used to understand the climate and forecast climate change. However, thus far, these approaches have failed to quantitatively reproduce the historical paleoenvironment because the short timescale of the available data allows only for a limited explanation of the atmospheric patterns of the paleoclimate, such as those during the Eemian and the Last Glacial Maximum (Mahowald and others, Reference Mahowald1999; Lunt and Valdes, Reference Lunt and Valdes2002; Dahl-Jensen and others, Reference Dahl-Jensen2013). The strontium (Sr), neodymium (Nd) and lead (Pb) isotopic ratios are powerful indicators that can be used to trace dust provenance because the isotopic compositions of these elements are fundamentally controlled by geological properties and are not significantly altered by weathering, transportation or deposition processes (Grousset and Biscaye, Reference Grousset and Biscaye2005). The Sr and Nd isotopic data from Antarctic snow/ice provide a good opportunity to investigate the provenance and possible temporal variability of dust (Bory and others, Reference Bory2010; Aarons and others, Reference Aarons2017; Delmonte and others, Reference Delmonte2017). Pb isotopic data have demonstrated that the significant Pb pollution in Antarctica has persisted into the 21st century (Mcconnell and others, Reference Mcconnell2014).
However, the precise locations of the dust source areas within the Antarctic ice sheet over long timescales are still debated (Sugden and others, Reference Sugden, Mcculloch, Bory and Hein2009; Delmonte and others, Reference Delmonte2010; Delmonte and others, Reference Delmonte2017). Additionally, the provenance of the dust deposited in other regions of the Antarctic continent (such as Dome A) remains unknown. Improving our understanding of the provenance of the dust deposited on the Antarctic continent is necessary to clarify the transport processes of mineral dust in the modern climate state over long timescales, especially considering several new snow/snowpit profiles.
Many transects extending from Antarctic coastal areas to interior regions have been studied under the framework of the International Trans-Antarctic Scientific Expedition and many valuable glaciochemical datasets have been collected in previous studies (Mayewski and others, Reference Mayewski2005; Dixon and others, Reference Dixon2013; Khodzher and others, Reference Khodzher2014). In general, previous studies primarily focused on the chemical compositions in snow/ice at fixed sites; therefore, it is difficult to determine the mineral dust concentrations over large spatial scales. To overcome this limitation, surface snow sampling can be conducted over a large surface area and is best suited for material-demanding Sr, Nd and Pb isotopic analyses. This sampling approach can be employed to obtain data at a spatial scale that is unattainable with ice cores. Therefore, in this study, insoluble mineral dust was extracted from recent surface snow to investigate dust provenances based on Sr and Nd isotopes. Additionally, the relative effects of natural and anthropogenic sources of Pb were evaluated based on Pb isotopic compositions along the Zhongshan-Dome A transect in East Antarctica.
2. SAMPLING AND MEASUREMENTS
A transect was established in December 2016 from the coastal Zhongshan station (69°37′31″S, 76°37′22″E) to Kunlun station, an interior Chinese research site located at Dome A, which is the highest point in eastern Antarctica (80°25′01″S, 77°06′58″E) (Fig. 1). Surface snow was sampled by the 33rd Chinese National Antarctic Research Expedition (CHINARE-33). The snow samples were collected from this transect in the most favourable sector to avoid possible pollution by camp activities (upwind from the camp according to prevailing summer wind directions). Overall, 122 surface snow samples (2–3 cm) were taken at even intervals along the route for major ion analysis. The sampling containers for all the samples were 500 ml Nalgene low-density polyethylene (LDPE) wide-mouth bottles, which were thoroughly acid-cleaned following a strict cleaning procedure at the State Key Laboratory of Cryospheric Sciences. In addition, for Sr, Nd, Pb measurements, ~5–6 cm-thick layers of surface snow were excavated using a Teflon shovel and the snow samples were placed in 5–l Whirl-Pak bags. Approximately 4–5 bags were collected at each site. Detailed information about the geography along the route and snow accumulation is provided in Table 1. In total, 11 surface snow samples and two sand samples (grain size <71 µm) were collected along the transect (Fig. 1). To avoid contamination from transportation and handling, 11 snow samples were melted at 50 °C on a heating plate in a field laboratory. Finally, the melted snow was immediately filtered through an LCR hydrophilic Teflon membrane filter (0.2 µm pore size and 47 µm diameter, Millipore Corporation) using precleaned (acid-washed) plastic filtration units (Nalgene Filterware 300–4100). The filtration units and Teflon filters were immersed for 1 week in an initial acid bath (20% Fisher ‘Optima’ grade HNO3 diluted in Milli-Q ultrapure water), were then immersed for 1 week in another acid bath (0.1% Fisher ‘Optima’ grade HNO3 diluted in Milli-Q water) and were finally washed with Milli-Q water multiple times before use. Consequently, the insoluble particles with diameters larger than 0.2 µm were collected on the filter and stored in a freezing room (−20°C).
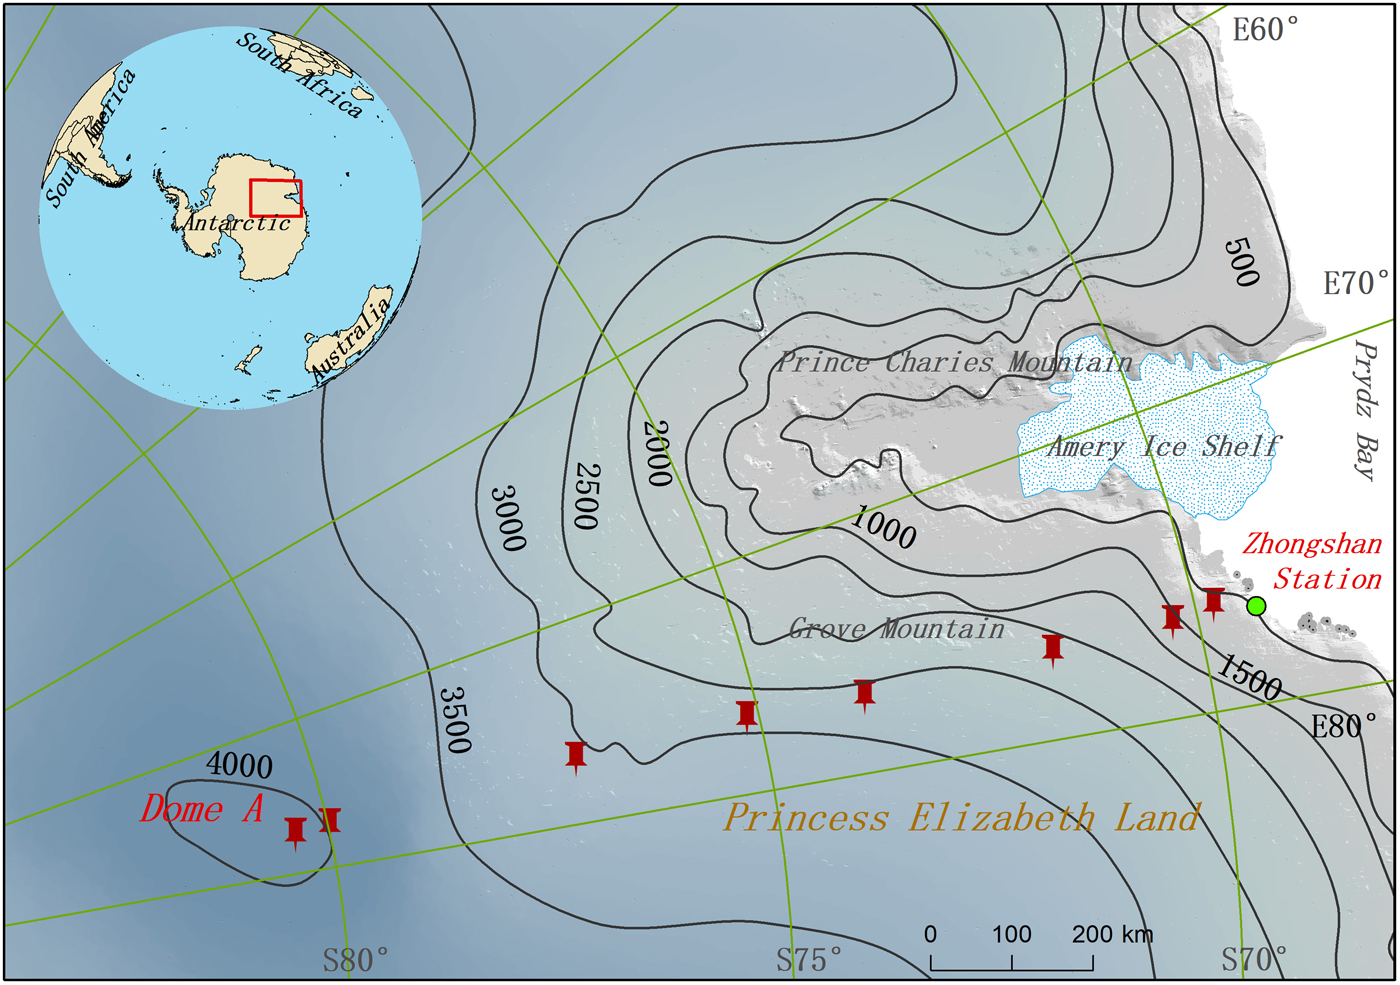
Fig. 1. Location of snow and soil samples along the transect from Zhongshan Station to Dome A, East Antarctica. Red thumbtacks and green solid dots denote the locations where the surface snow and sand samples were collected, respectively.
Table 1. The Sr and Nd isotopic characteristics of insoluble dust in surface snow and sand samples along the Zhongshan-Dome A transect in this study
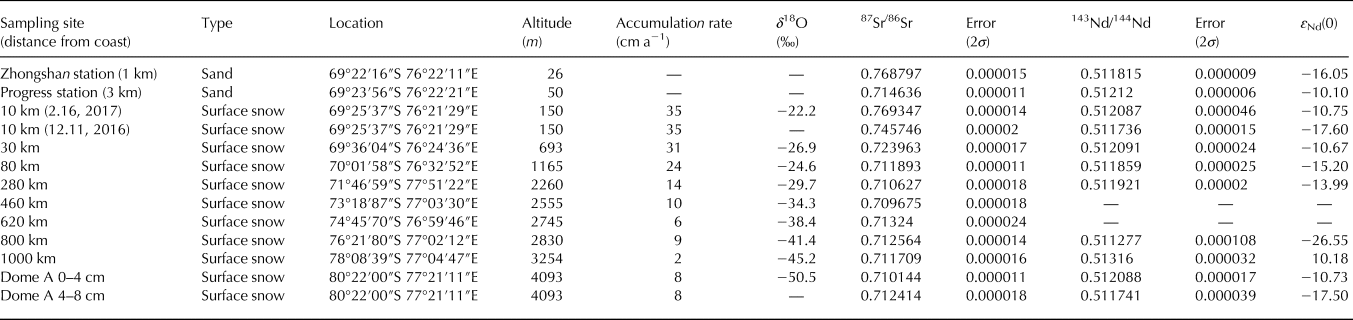
ε Nd(0) = ((143Nd/144Nd)Sample/(143Nd/144Nd)CHUR-1) × 104, (143Nd/144 Nd)CHUR = 0.512638.
All subsequent procedures were performed in clean laboratory facilities at the Analytical Laboratory, Beijing Research Institute of Uranium Geology. The ratios of the Sr, Nd and Pb isotopes were measured by thermal ionisation mass spectrometry (using an IsoProbe-T spectrometer, GV Corporation). The samples were first digested following the digestion process described above. The elements Sr and Nd were successively separated based on the method proposed in a previous study (Du and others, Reference Du, Xiao, Liu and Wu2015). The Pb isotope measurements are briefly outlined in this section. First, Pb was separated using a 100–200-mesh AG1 X8 anion exchange resin (subsamples were loaded in 0.5 N HBr and Pb was eluted with 6 N HCl). Second, Sr and Nd were purified using a standard cation-exchange procedure (φ 0.5 cm × 15 cm, AG50 W × 8 (H+), 100–200 mesh) and loaded in 0.5 N HCl. Then, Sr was eluted with 2.5 M HCl and Nd was eluted with 4 M HCl.
The Sr isotopes were loaded onto single Re filaments and a Ta activator in static multicollection mode. The data were corrected for internal mass biases to 86Sr/88Sr = 0.1194 and the 87Sr/86Sr ratio NBS 987 Sr isotope standard (2σ, n = 10) was 0.710250 ± 7 compared with the recommended value of 0.710248. Nd isotopes were measured using triple Re filaments in static mode. Data were corrected for internal mass bias to 144Nd/146Nd = 0.7219. The 143Nd/144Nd result for the ShinEtsu reference material was 0.512095 ± 9 (2σ, n = 10) and the recommended value is 0.512110. The Pb isotopes were measured using a single Re ribbon with a silica gel emitter in static multicollection mode. To optimise the instrumental accuracy, the NBS 987 Sr and NBS981 Pb (2σ, n = 10) isotope standard samples were used in this study. The 208Pb/206Pb, 207Pb/206Pb and 204Pb/206Pb ratios of the NBS 981 Pb isotope standard were 0.710229 ± 15, 0.914338 ± 7 and 0.0591107 ± 2, respectively. The analytical blank was <100 pg for Pb, Sr and Nd. The results are reported in Tables 1 and 2 in this study.
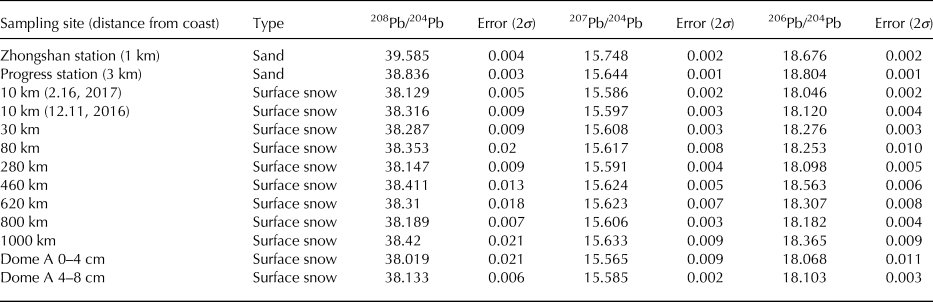
Table 2. Pb isotopic characteristics of insoluble dust in surface snow and sand samples along the Zhongshan-Dome A transect in this study
Snow surface samples (122) were collected in 500 LDPE bottles and melted in a clean room. Approximately 5 ml of each sample was transferred into a clean bottle and used for the major ion analyses and ~1.0 ml was transferred into a glass bottle (1.5 ml) for the stable hydrogen and oxygen stable isotope analyses. The samples were analysed immediately after being melted in a clean room (class 1000 for the room and class 100 for the operating chamber). Cations were analysed with a Dionex ISC 3000 ion chromatograph (Dionex ISC 3000, Thermo Scientific, USA) using an Ion Pac CS12A column, 20 mmol l−1 MSA eluent and a cation electrolytically regenerated suppressor. The anions were analysed using a Dionex ISC3000 ion chromatograph (Dionex ISC3000, Thermo Scientific, USA) with an Ion Pac AS11-HC column, 25 mmol l−1 KOH eluent and an anion electrolytically regenerated suppressor. The specific measurement method was followed that of Li and others (Reference Li2014). The oxygen and hydrogen isotopic compositions of surface snow samples were determined using a cavity ring-down spectroscope (L2120-i, Picarro, Inc.), which is a small, portable instrument and is simple to operate. Liquid water was automatically injected into an evaporation chamber, and the oxygen and hydrogen isotope compositions of water vapour were measured using the analyser. The isotopic ratios were expressed in per mil (‰) units using δ 18O values relative to Vienna Standard Mean Ocean Water (V-SMOW). The 1σ reproducibility was 0.07‰ for δ 18O.
3. RESULTS AND DISCUSSION
3.1. Spatial variations in the chemical components of surface snow
Stable isotope (δ 18O) analyses have been conducted for Antarctic snow and ice and been applied to quantify past changes in polar temperatures and track the origin of moisture (Jouzel and others, Reference Jouzel2003; Xiao and others, Reference Xiao2012). A series of δ 18O values from surface snow samples is presented to understand the variations in the isotopes and the climatic signals in this study (Fig. 2). In comparison with previous results (Xiao and others, Reference Xiao2012; Li and others, Reference Li2016) for surface snow samples collected along the same transect in 2007/08 and 2014/15, our data display elevated δ 18O values (−38.05 ± 7.62‰ vs Xiao's −42.72‰ ± 7.81‰ and Li's −40.95‰ ± 8.13‰). The samples were collected on the same dates in 2014/15 and 2016/17, and the increasing δ 18O values indicate a warming trend in this transect. The δ 18O isotopes in the surface snow samples exhibit remarkable decreasing trends with increasing distance inland (accompanied with increasing elevation), with a mean δ-distance slope of −2.47‰ 100 km−1 for δ 18O. This value is consistent with the Antarctic average value of −2.37‰ 100 km−1 for δ 18O (Li et al., 2016). We also obtained a mean δ-altitude gradient of −0.88‰/100 m for δ 18O. This value is consistent with the Antarctic average value of −0.93‰ 100 m−1 for δ 18O (Li and others, Reference Li2016). The more recent mean annual accumulation rates (2016–2017) were obtained by measuring the heights of bamboo stakes above the snow surface and the snow densities along the transect. In total, 603 sets of accumulation data were collected and are shown in Figure 2. Although complex variability was observed in certain regions, a generally negative trend in accumulation with increasing altitude and distance inland was detected.
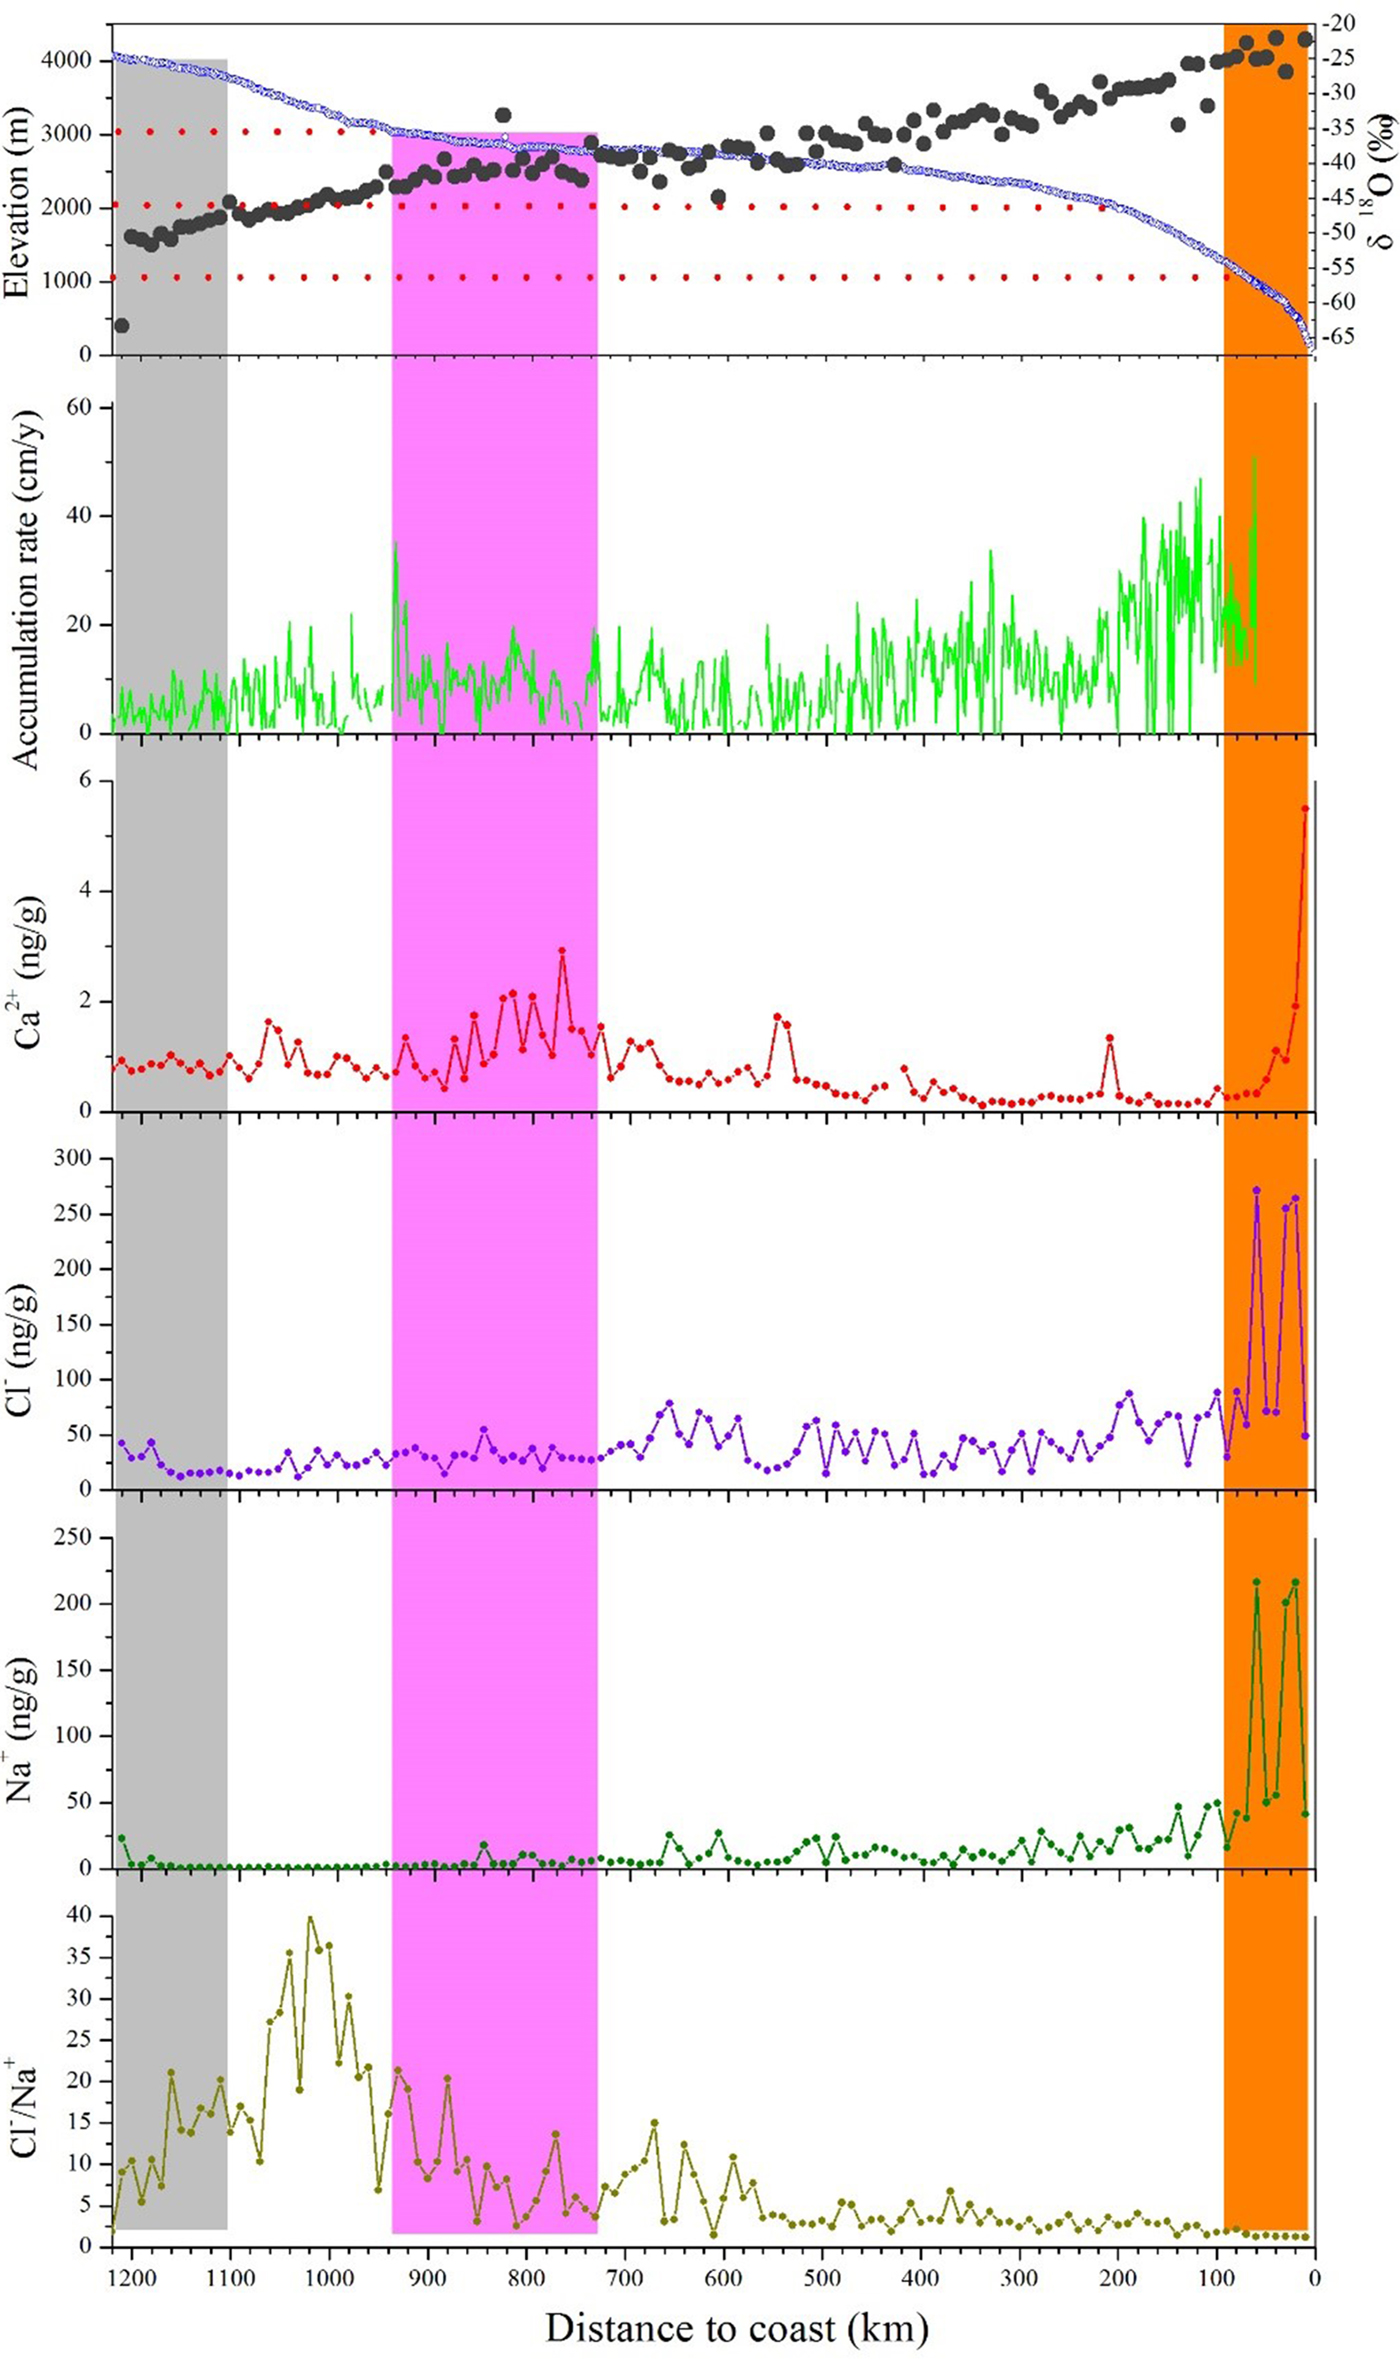
Fig. 2. Spatial distribution of the glaciochemical components (Na+, Cl−, Ca2+ and Cl−/Na+), stable oxygen isotope (δ 18O, dots), accumulation rate (cm a−1) and altitude (m, cycles) along the transect route from Zhongshan Station to Dome A, East Antarctica.
Na+ and Cl− are the main components of sea salt, and previous studies have suggested that sea salt ion concentrations are much higher in coastal areas than in inland areas as a function of elevation rather than the distance from the sea (Delmas, Reference Delmas1992). The Cl−/Na+ concentration ratio was calculated to illustrate the sources and mechanisms that influence the deposition of sea salt aerosols (Suzuki and others, Reference Suzuki2002). The Cl−/Na+ ratio in seawater is 1.81 (Suzuki and others, Reference Suzuki2002). In the surface snow samples from the coastal region, the two ions (Na+ and Cl−) are highly positively correlated with each other, and in particular, the ratio of Cl−/ Na+ (1.46) is close to that of seawater, implying that there is a significant contribution from the sea salt in seawater (Fig. 2). Remarkably, the concentrations of Na+, Cl− and Ca2+ abruptly decrease as the altitude and distance from the coast increase (Fig. 2). In addition, there is a negative relationship between the associated ions (Na+, Cl−, Ca2+) and stable water isotope (δ 18O), indicating that altitude and distance together contribute to the distribution of chemical components along this transect.
We can separate the transect into three sections based on the ion variations. The first section has a distance from the coast of <100 km and the lowest altitude (<1000 m). The 5–6 cm snow layer represents from one to multiple months of snowfall accumulation, or even a few snowfall events of accumulation. This region has the highest concentrations of ions, accumulation rates and stable water isotopes. In addition, the ion concentrations in the coastal region decrease rapidly as the altitude increases sharply. The fit (R 2 = 0.99, n = 10) and slope of the linear regression suggest that sea salt is the dominant source of both Na+ and Cl− in this region (yellow shaded area in Fig. 2) because the major source of sea salt ions is seawater in this region. Therefore, the areas of limited sea ice coverage in the summer may also be responsible for the high sea salt ion concentrations in the surface snow in this region. Second, in the stable region, located between 300 and 950 km from the coast and 2000–3000 m a.s.l., the concentrations of Na+ and Cl− exhibit significant decreasing trends and the ion concentrations fluctuate from 700 to 950 km. This region is characterised by relatively flat topography. In addition, the concentrations of Ca2+ exhibit a slowly increasing trend from 3000 to 4000 m (Dome A). Because the accumulation rates are different in this transect (Table 1), the 5–6 cm snow layer represents a few months of accumulation in this region. These results indicate that in addition to altitude and distance from the coast, there are the other factors, such as high-latitude atmospheric dynamics, local weather systems and annual net deposition rates, that significantly impact the variations in results along the transect. Finally, the inland region, which encompasses of very low accumulation, the ion concentrations in the samples from the 5 to 6 cm snow layer were measured at a distance from the coast of 1000 km to Dome A. The accumulation here may represent all of the summer accumulation or accumulation over an entire year (Wang and others, Reference Wang2013). A slight increasing trend is observed inland (1100–1220 km), and the δ 18O values reach a minimum at Dome A. The extreme aridity and lack of excess moisture may produce this sudden transition.
3.2 Plausible explanations based on Sr–Nd isotopic compositions and mixing models
The measured 87Sr/86Sr and 143Nd/144Nd (normalised to ε Nd(0)) ratios for insoluble dust in snow samples along the transect from Zhongshan to Dome A are listed in Table 1. The 87Sr/86Sr ratio averages 0.724212 (varying from 0.709675 to 0.769347), with a maximum difference of 0.059672 for the 11 snow samples, which exhibit 87Sr/86Sr isotopic values that progressively decrease from the coast to inland. The 87Sr/86Sr ratios range from more radiogenic values in the Zhongshan and Progress station sand samples to less radiogenic values in the inner Dome A snow samples (Fig. 3). The Sr isotopic ratios exhibit a dependence on the distance from the coast, implying that dust grain size is the main factor controlling this variation because of wind sorting in snow samples. The differences between the periphery and interior of the ice sheet in this transect are particularly evident for Sr isotopes, suggesting spatial differentiation in the composition of dust along this transect. The 143Nd/144Nd ratios range from 0.511277 to 0.513160 (with ε Nd(0) averaging −12.59 and ranging from −26.55 to 10.18). The ε Nd(0) values exhibit no significant variations along the transect (Fig. 3). The Nd isotope ratios of mineral dust are independent of the particle grain size and display a high sensitivity to dust origin (Feng and others, Reference Feng, Zhu, Zhen and Hu2009). Therefore, although the fine grain size fraction in insoluble dust from snow samples was not specifically separated, no substantial effect on the Nd isotopic composition was observed. This finding enables a comparison to be made between the Nd isotopic compositions of insoluble dust and other Antarctica data under the appropriate constraints. Our results are mainly based on the comparison of Nd isotopic ratios.
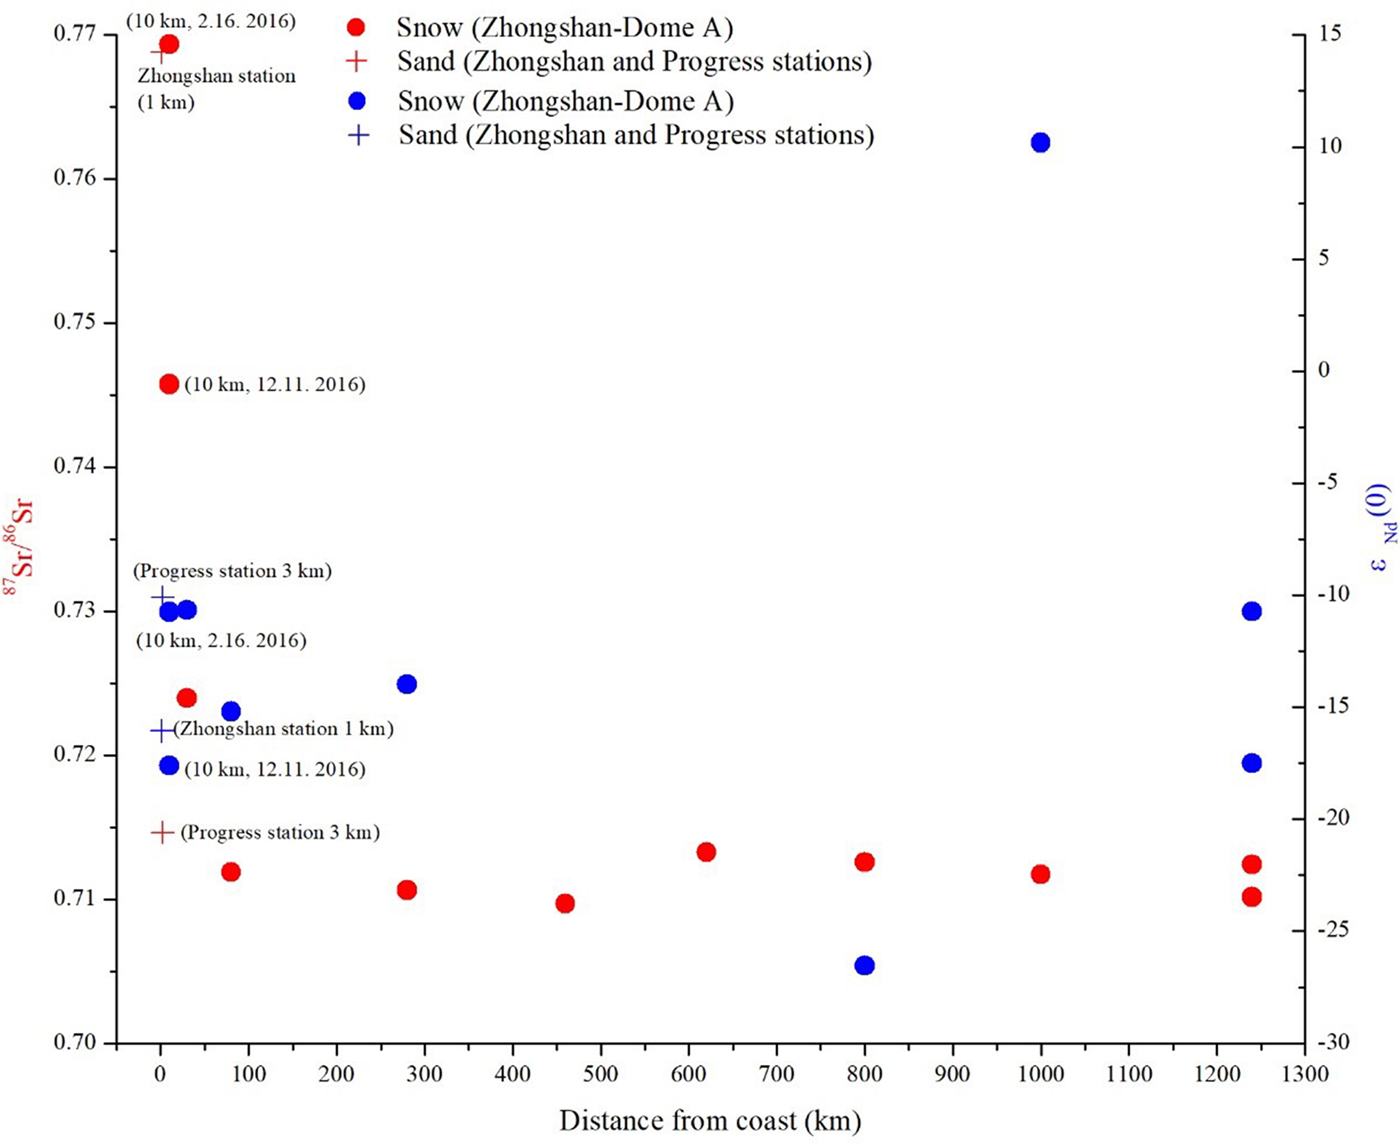
Fig. 3. Spatial variability of isotopic compositions in insoluble dust in snow samples along Zhongshan-Dome A transect and sand from the Zhongshan and Progress stations.
The accumulation rate gradually decreases from the coast to Dome A (Fig. 2). The observed differences in this transect imply that the dust sources are not identical. Specifically, the Sr and Nd isotopic compositions (ε Nd(0) vs 87Sr/86Sr) of insoluble dust in the coastal snow samples (one collected on 11 December 2016 and another collected on 16 February 2017) are similar to those of the sand from the Zhongshan and Progress stations (Figs 1, 3). The Sr and Nd isotopic compositions of insoluble dust were extracted from recent snow layers at the top of the Berkner Island ice sheet (Bory and others, Reference Bory2010) and the results are similar to the Nd isotopic values from the snow samples in this study. The main snow-free outcrops of the old East Antarctic shield are found in the Indian and Atlantic sectors; they are Mac. Robertson Land and Enderby Land, which produce abundant aeolian material (Dalziel, Reference Dalziel1992; Hemming and others, Reference Hemming2007). The air-mass back trajectories provided dust transport from ice-free areas (Mac Robertson Land and Enderby Land) to Berkner (Bory and others, Reference Bory2010). The Zhongshan and Progress stations are closer to Mac Robertson Land than to Berkner Island. Therefore, the local dust from Mac. Robertson Land may be the main source of dust in the coastal snow samples (Fig. 4). In addition, the Sr and Nd isotopic compositions in Victoria Land dust are similar to those in samples from the Zhongshan and Progress stations. These results reveal that the entire geologic structure of the Antarctic continent is similar. The Sr and Nd isotopic compositions in insoluble dust from snow samples collected at the 1000 km site differ from those in the other samples and exhibit more radiogenic values. This phenomenon may be explained by the potential dust sources, namely, South America or Antarctic Dry Valleys (Delmonte and others, Reference Delmonte2004; Gaiero, Reference Gaiero2007). However, the distance to Antarctic Dry Valleys is much shorter than that to the potential South American dust source; therefore, it is much more likely that the mineral dust is derived from Antarctic ice-free regions (such as Mac Robertson Land). A similar result was found by Aarons and others, (Reference Aarons2017), who identified the Ross Sea sector (e.g., Taylor Valleys) as the potential dust source for East Antarctica. Delmonte and others (Reference Delmonte2013) similarly found that the ice-free areas in Victoria Land of Antarctica are important potential dust sources for the Antarctic ice sheet. Therefore, the Antarctic Dry or Taylor Valleys may be potential dust sources for this specific region (1000 km apart from the coast). The 5 cm snow layer in this region (with an accumulation rate of 3 cm a−1 from 2013 to 2015) may represent the total annual accumulation and may contain volcanic material because mixing occurs in drifting snow. The volcanic end member of the Sr and Nd isotopic compositions (ε Nd(0)) in the volcanic ash layers (tephra) from the Vostok ice cores ranged from +6 to +8 and displayed an 87Sr/86Sr ratio ranging from 0.70393 to 0.70478, indicating a relatively radiogenic signature (Basile and others, Reference Basile1997). Therefore, volcanic aerosols can be excluded based on the eruption history and Pb isotope data (Section 3.3).
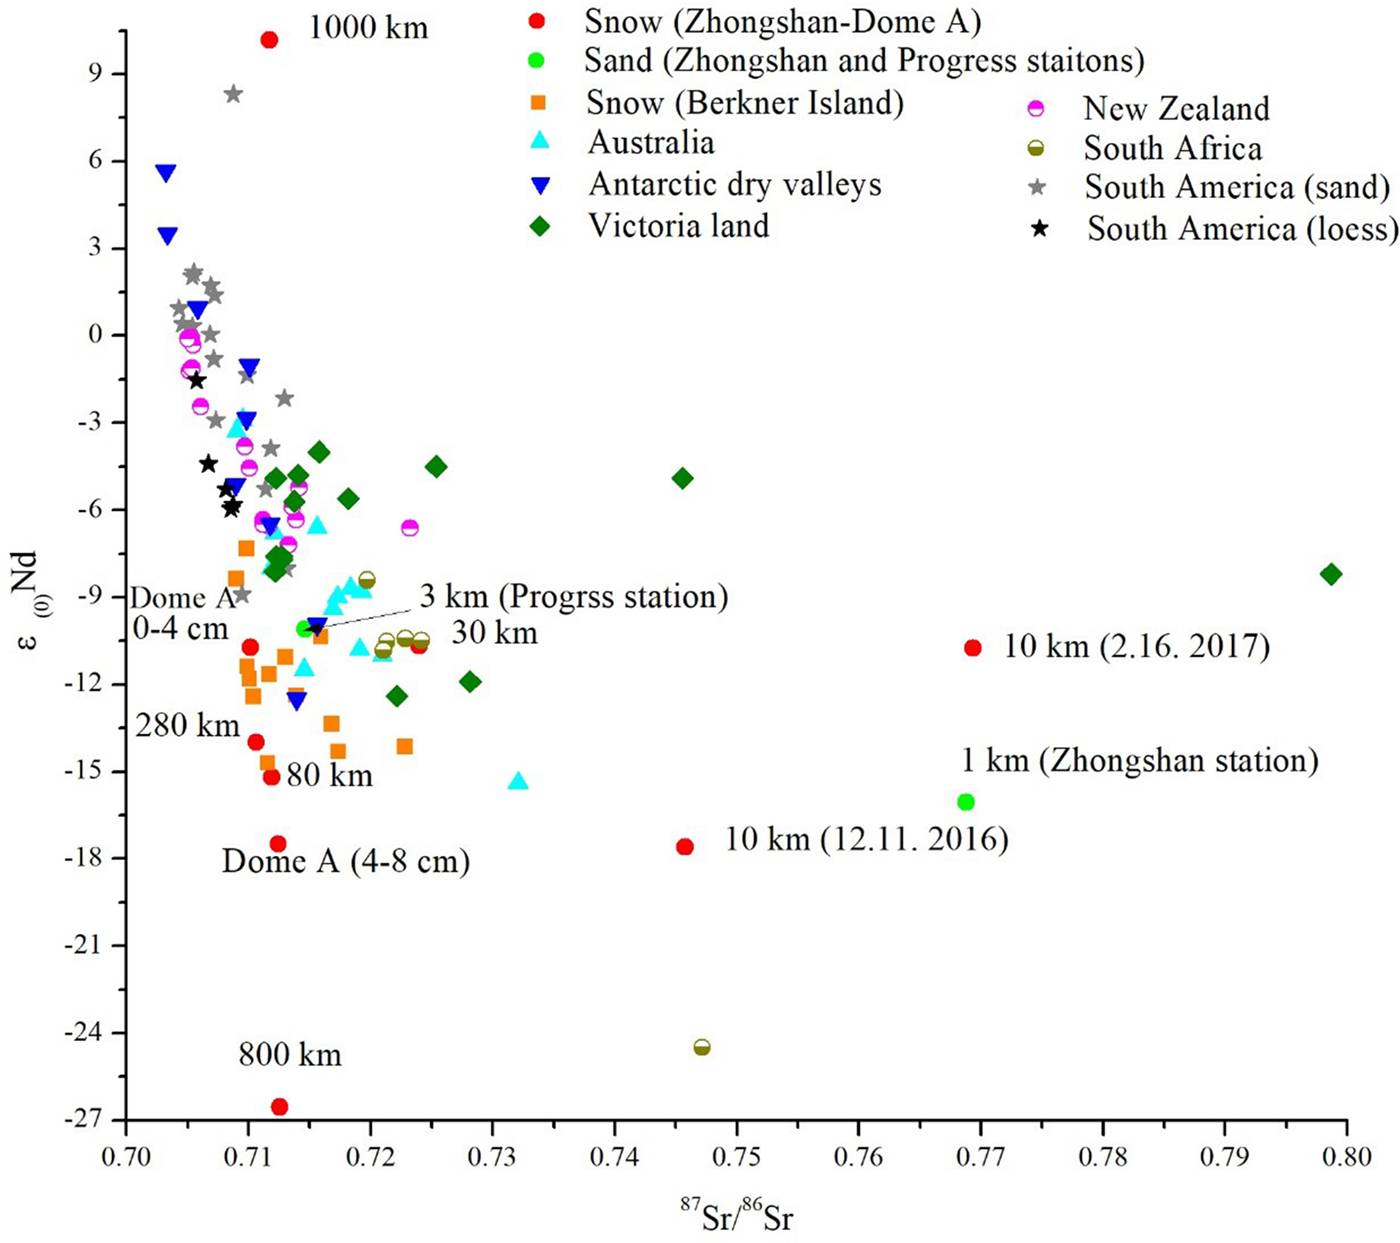
Fig. 4. Sr and Nd isotopic compositions (ε Nd(0) vs 87Sr/86Sr) of insoluble dust in surface snow and sand from Zhongshan and Progress stations to Dome A (snow samples indicated by black dots; sand samples indicated by gray dots) together with data obtained on the potential dust sources (data from Australia dust source areas and aeolian dust deposits from Revel-Rolland and others (Reference Revel-Rolland2006); sand data from South Africa, Antarctic Dry Valleys, New Zealand, South America and Victoria by Delmonte and others (Reference Delmonte2004); loss data from South America by Gaiero and others (Reference Gaiero2007).
For the 800 km snow sample, the value of ε Nd(0) is notably low and the 143Nd/144Nd ratio is much more radiogenic than that at 1000 km, although the values for the sand and soil samples from South Africa and the Antarctic Dry valleys are similar to these values. However, the error for this sample is much larger than the errors for the other snow samples (Table 1), which limits further discussion. Regarding the 30 km, 80 km and 280 km snow samples, one isotopically distinct end member (coastal source) is seemingly not sufficient to account for the entire range of Sr and Nd isotopic signatures in the insoluble dust (Fig. 4). Considering the Nd isotopic values, the results (for the 30 km, 80 km, 280 km and Dome A 0–4 cm samples) are also similar to those obtained for the Australian samples. In assessing seasonal variations, two snow samples collected from Dome A exhibited significant shifts between the 87Sr/86Sr and 143Nd/144Nd ratios (Fig. 4). The accumulation rate was 6 cm a−1 in the region from 2013 to 2015. The 0–4 cm snow layer may represent the summer season of 2017. The 87Sr/86Sr and 143Nd/144Nd ratios in this insoluble dust sample slightly overlap those of the sand samples from Progress Station and Australia (Fig. 4). This finding suggests that the mineral dust originated from both regions. However, it is difficult to distinguish which potential dust source is the most important contributor. The 4–8 cm snow layer from top to bottom at Dome A may represent the autumn or winter season of 2016 and the ratio of 87Sr/86Sr in this sample is larger than that in the 0–4 cm snow layer. Evaluating the 143Nd/144Nd ratios alone, the results are similar to those for the coastal snow and sand samples. On the periphery of the East Antarctic ice sheet, large ice- and snow-free areas occur at low altitudes, particularly in coastal regions, as well as at high altitudes, even above 3000 m a.s.l., in inland regions. Many of these outcrops have been ice-free for millions of years (Yamane et al., Reference Yamane2015; Huang et al., Reference Huang2008) and have been subjected to physical and chemical weathering processes, as indicated by the origin and distribution of salts. In addition, the effects of microorganisms and Bryophyta have resulted in the formation of soil and regoliths in some cases (Oberholzer and others, Reference Oberholzer, Baroni, Salvatore, Baur and Wieler2008; Strasky and others, Reference Strasky2009). As indicated by the origin and distribution of salts, these soil and rock layers were subjected to physical and chemical weathering processes along the coast (<2000 m). Therefore, in addition to Australia, the snow-free areas along the periphery of the East Antarctic ice sheet may be a potential primary dust source for inland regions. The 0–4 cm snow layer may represent the accumulation of one to multiple months (or snowfall events) for the 30 km, 80 km and 280 km snow samples. This accumulation results in increased uncertainty due to the differences in sampling resolution along this transect.
The ε Nd(0) equation was applied to the Nd isotopic data due to the small influence of particle size on the isotopic values (Chen and others, Reference Chen2007). It is possible to estimate the contribution of dust from local sources in this transect, and we adopted the following conventional mixing equation proposed by Xu and others (Reference Xu2012):
 $$X(\percnt) = \displaystyle{{{(\varepsilon _{{\rm Nd}}{\rm (0))}}_{{\rm Samp}}{\rm -} {(\varepsilon _{{\rm Nd}}{\rm (0))}}_{{\rm Aus}}{_{\rm -}} _{{\rm Avg}}} \over {{(\varepsilon _{{\rm Nd}}{\rm (0))}}_{{\rm Local}}{\rm -} {(\varepsilon _{{\rm Nd}}{\rm (0))}}_{{\rm Aus}}{_{\rm -}} _{{\rm Avg}}}}{^\ast}100$$
where X is the fraction of the contribution from the northern desert, (ε Nd(0))samp is the ε Nd(0) value at one of the sampling sites, and (ε Nd(0))Aus−Avg (−7.65) and (ε Nd(0))local (−16.05) are used as the potential end members and represent the average value of ε Nd(0) in Australia and the value of ε Nd(0) for the local source, respectively. The (ε Nd(0))local value is taken from sand at the Chinese Zhongshan Station, Antarctica. The (ε Nd(0))Aus−Avg value is the average value in Australian aeolian dust (Revel-Rolland and others, Reference Revel-Rolland2006). The results show that 36% of the dust at Dome A (0–4 cm snow layer) and 36–90% of the insoluble dust in the transect snow samples (<280 km) were likely transported from the local coast, implying that the ice-free region of the ice sheet may make important dust deposition contributions in East Antarctica.
3.3. Pb isotopic compositions along the Zhongshan-Dome a transect
The Pb isotopic compositions in insoluble dust in snow and sand samples from the Zhongshan-Dome A transect are shown in Table 2. The Pb isotopic ratio exhibits remarkable spatial variations for sand and insoluble dust in this transect. The 206Pb/207Pb and 208Pb/207Pb values in two sand samples from the Zhongshan (1 km) and Progress (3 km) stations are much more radiogenic than those in insoluble dust from the snow samples. The most radiogenic end members of the 206Pb/207Pb and 208Pb/207Pb ratios are ~1.20 and ~2.51 for the sand samples from the Zhongshan and Progress stations, respectively. In addition, the most radiogenic end member of 206Pb/207Pb is ~1.16 and that of 208Pb/207Pb is ~2.44 in insoluble dust from snow samples (Fig. 5). The 206Pb/207Pb ratio of the McMurdo Province volcanic Pb sources is >1.24; therefore, it is not the volcanic source associated with the 1000 km snow sample. The Pb isotopic ratios at Progress station (3 km) exhibit a uniformly increasing trend line for the surface snow results and this characteristic is also displayed by the 87Sr/86Sr and 143Nd/144Nd ratios in the same sample. As seen in Figure 6, the 206Pb/207Pb ratios in insoluble dust from snow samples fall between the less radiogenic Australian and coastal (Zhongshan station) signatures, suggesting that there are two potential source areas in this transect.

Fig. 5. Pb isotopic composition of insoluble dust in surface snow and sand from Zhongshan and Progress stations to Dome A (snow samples indicated by dots; sand samples indicated by squares).
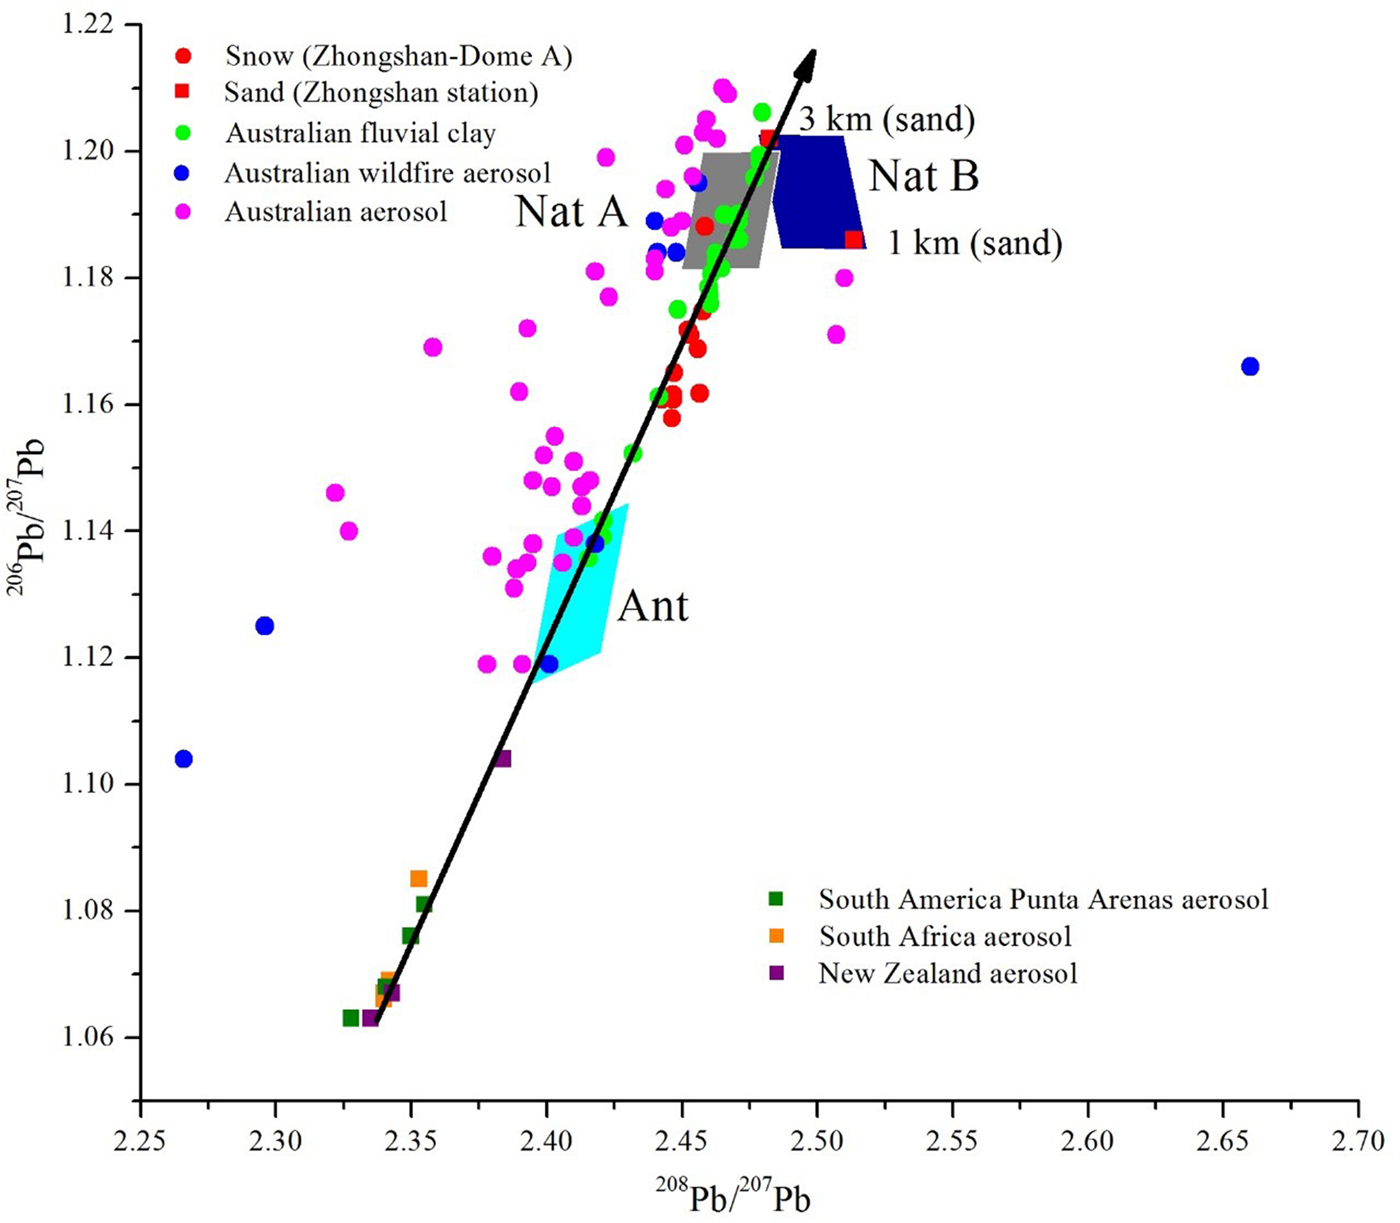
Fig. 6. Lead isotopic compositions in insoluble dust in snow and sand from Zhongshan and Progress stations to Dome A (this work) and PSA samples from the Southern Hemisphere (data on Australian aerosols and wildfire aerosols from Kristensen and others (Reference Kristensen, Taylor and Flegal2017), which are cited from 2000 AD; data on Australian fluvial clay from De Deckker et al. (Reference De Deckker, Norman, Goodwin, Wain and Gingele2010); aerosol data from New Zealand, South America Punta Arenas and South Africa from Bollhöfer and Rosman (2000)).
The previous data indicated that the 206Pb/207Pb ratios fall between 1.23 and 1.24, and these values were considered the most representative of natural preindustrial Pb deposited in Victoria Land (Van de Velde and others, Reference Van de Velde2005). The 206Pb/207Pb ratios in the insoluble dust from the Zhongshan-Dome A transect samples are much lower than ~1.23. As seen in Table 2, the Pb isotopic compositions in the surface samples along this transect are clearly not aligned with those observed during the preindustrial period in Coats Land and at Law Dome (Matsumoto and Hinkley, Reference Matsumoto and Hinkley2001; Vallelonga and others, Reference Vallelonga2002; Planchon and others, Reference Planchon2003; Van de Velde and others, Reference Van de Velde2005). Therefore, the ubiquitous presence of modern-day anthropogenic Pb sources is suggested, as reflected by the modern inputs of Pb with a specific isotopic composition. The previous data suggest that the natural end member is the result of the mixing of volcanic and crustal inputs, whereas the anthropogenic end member is governed by both South American and Australian industrial emissions that reached the Antarctic ice sheet (Matsumoto and Hinkley, Reference Matsumoto and Hinkley2001; Vallelonga and others, Reference Vallelonga2002; Planchon and others, Reference Planchon2003; Van de Velde and others, Reference Van de Velde2005). Clearly, no volcanic event has occurred in East Antarctica in the past 2 years; therefore, a volcanic source can be excluded. Figure 6 shows that this mixing line is common in the surface snow and aerosol samples. Our results are based on modern snow samples, providing further support that Australia is the main anthropogenic source along the Zhongshan to Dome A transect (Fig. 6). The use of leaded petrol decreased after the 1970s and leaded petrol emissions declined from a peak of 7869 tonnes in 1974 AD to zero after 2002 AD (Kristensen and others, Reference Kristensen, Taylor and Morrison2015). Large quantities of leaded petrol emissions were deposited locally in soils and sediments from Australia, indicating that the spatial gradients of the Pb isotopes in the Zhongshan-Dome A transect are consistent with the results of previous studies (Birch and others, Reference Birch, Vanderhayden and Olmos2011; Kristensen and others, Reference Kristensen, Taylor and Flegal2017; Rouillon and others, Reference Rouillon, Harvey, Kristensen, George and Taylor2017). The Sr, Nd and Pb isotopes from potential dust source areas and aeolian dust deposits located in semiarid Australia and the Pb isotopes from fluvial clay samples indicate that mineral dust from Australia was deposited on the Antarctic ice sheet under the modern climate system. Although these data will be beneficial for understanding the dust cycle in East Antarctica, as discussed above, the spatial differences of the Sr, Nd and Pb isotope components are large because of the different resolutions along the transect. Therefore, much more work needs be carried out on deep ice cores from Dome A and adjacent regions in the future.
A closer examination of these transect data on a three-isotope plot (of 206Pb/207Pb vs. 208Pb/207Pb; Fig. 6) shows that they are grouped along a line. This result usually indicates that the Pb in the samples is a binary mixture, with the sources being the end-points of the line. We can determine that Australia is one possible anthropogenic end member, and there are two primary natural dust sources, the ice-free regions of the coast near Zhongshan station and Australia. Based on the abundances of 206Pb, 207Pb and 208Pb measured in the insoluble dust in this transect, we obtained an approximate estimate of the contributions of Australian dust and local coastal dust using a ternary mixing equation (Yu et al., 2014):
 $$X_{{\rm Ant}}( \percnt) = \displaystyle{{[{({}^{206}\hbox{Pb/}{}^{{\rm 207}}\hbox{Pb)}}_{{\rm sample}} \,{\rm -} \,{\rm (}{}^{206}\hbox{Pb/}{}^{{\rm 207}}\hbox{P}\hbox{b}_{{\rm Nat}}{\rm )]}} \over {[{({}^{206}\hbox{Pb/}{}^{{\rm 207}}\hbox{Pb)}}_{{\rm Ant}} \, {\rm -} \, {\rm (}{}^{206}\hbox{Pb/}{}^{{\rm 207}}\hbox{P}\hbox{b}_{{\rm Nat}}{\rm )]}}} {\rm {^\ast}}100$$
where the suffixes ‘sample,’ ‘ant,’ and ‘nat’ represent the results for the transect snow samples, anthropogenic sources and natural samples, respectively. X Ant is the fractional contribution of anthropogenic sources. Additionally, the relative contribution of the Australian anthropogenic sources (including wildfires and aerosols) can be estimated. Considering the smaller difference in the Pb isotopic composition between Australian (Ant A) and coastal sand (Ant B), we assume that there are two dust sources in this transect. Therefore, the reference value for the natural sample in the Australian aeolian dust is 1.195 (the average ratio of mineral dust in the fluvial clays, which is larger than the ratio of 206Pb/207Pb in the insoluble dust from snow samples), and that for sand from Progress station is 1.202. The Pb released from wildfire ash is a mixture of natural and anthropogenic Pb. The remobilisation of historic Pb deposits in wildfire ash has also been documented in Australia. The release of Pb during wildfire events and the redistribution of environmental contaminants have received increasing research interest in recent years (Kristensen and others, Reference Kristensen, Taylor, Odigie, Hibdon and Flegal2014; Kristensen and others, Reference Kristensen, Taylor and Flegal2017). Therefore, (206Pb/207Pb)Ant was set to 1.134 based on the average of the results from Australia, including aerosol and wildfire sources (1.139 for aerosols and 1.129 for wildfires; Kristensen and others, Reference Kristensen, Taylor and Flegal2017). These results indicate that the anthropogenic contributions from Australian pollutants account for ~11.3–60.9%, assuming the natural dust is from the local coast and 20.4–65.0%, assuming the natural dust is from Australia mineral dust, of the insoluble dust in this transect. Therefore, Australia may be the main source of pollutants for the Zhongshan-Dome A transect.
4. CONCLUSIONS
The spatial distribution pattern of sea salt ion concentrations included higher concentrations along the coast and significantly lower concentrations inland. These findings imply that physical and chemical weathering processes near the coast significantly contribute to the sea salt ions observed in low-altitude regions (<2000 m). The grain size variability of dust in East Antarctica can be interpreted as being controlled by alternating high- and low-level dust advection towards the polar plateau based on the Sr isotopic data. The Sr and Nd isotopic results indicate that the mineral dust source is the ice-free area surrounding the Zhongshan-Dome A transect. Thus, there is an enhanced lower tropospheric transport path to this transect. In addition, the Sr, Nd and Pb isotopic data from this transect demonstrated that Australian mineral dust and atmospheric aerosols are additional natural and anthropogenic sources, respectively. These results improve our understanding of the modern dust cycle along the transect. The spatial differences are large along the transect due to the different temporal resolution of the snow samples. Therefore, improving the temporal-spatial resolutions along this transect will be important for providing constraints on the dust provenance for future Dome A deep ice cores from the East Antarctica ice sheet during glacial-interglacial cycles.
AUTHOR CONTRIBUTIONS
Zhiheng Du and Cunde Xiao designed the study and performed the fieldwork in Antarctica. Zhiheng Du conducted the Sr–Nd–Pb isotopic analyses. Zhiheng Du, Cunde Xiao, Minghu Ding and Chuanjin Li wrote the paper. All authors contributed to the discussion/interpretation of results.
ACKNOWLEDGEMENTS
This work was supported by the National Natural Science Foundation of China (Grant Nos. 41425003, 41701071, 41421061 and 41671053); the Strategic Priority Research Program of the Chinese Academy of Sciences (Grant No. XDA19070103); the Key Research Program of Frontier Sciences, CAS (QYZDY-SSW-DQC021); the State Oceanic Administration of the People's Republic of China Project on Climate in Polar Regions (CHINARE2017-02-02); and the CAS ‘Light of West China’ ProgramWe thank all the members who participated in the 2016–2017 CHINARE field campaigns for sample collection.


 Open access