


Worldwide, the prevalence of obesity continues to rise in both adults and children(1,2) . Obesity is the leading cause of non-communicable diseases (NCD) and premature death globally(2–Reference Forouzanfar, Afshin and Alexander4). Unhealthy diets, characterised by an overconsumption of foods high in energy, fats, free-sugars and sodium and inadequate consumption of fruits and vegetables, are a key driver of obesity and NCD(5–Reference Cohen, Sturm and Lara10). In Australia, few people adhere to recommended dietary guidelines(11). Discretionary food (defined by the Australian Dietary Guidelines, as food and beverages that are not necessary for a healthy diet(12)), such as chocolate, confectionery, chips (crisps), sweet biscuits, pizza, ice cream and soft drinks, make up 35 % of energy intake in Australia(11). Discretionary food is also typically ultra-processed in nature(Reference Machado, Steele and Levy13). Studies have shown positive associations between consumption of ultra-processed food and CVD(Reference Srour, Fezeu and Kesse-Guyot14), all-cause mortality(Reference Rico-Campà, Martínez-González and Alvarez-Alvarez15) and cancer risk(Reference Fiolet, Srour and Sellem16). Accordingly, efforts to reduce discretionary food consumption are critical for improving population diets and health.
There is widespread recognition that obesity and poor population diets are driven by global food systems that heavily produce and promote processed food(Reference Swinburn, Sacks and Hall17). More specifically, food retail environments, where consumers source most of their food, have significant power to shape diets through their influence on food purchasing decisions(Reference Glanz, Sallis and Saelens18). In Australia, supermarkets account for 67 % of total food and beverage spending, making them the leading source of food for most households(Reference Spencer and Kneebone19). Australia has one of the most highly concentrated grocery sectors in the world, with three leading chains (Woolworths, Coles and Aldi) holding a combined market share of 76·7 %(20). These three supermarket groups, plus independent supermarkets which account for a further 16·2 % of the grocery market(20), play an important role in influencing population diets in Australia.
Marketing techniques used in supermarkets (including manipulation of product, placement, price and promotion) powerfully influence purchasing behaviour(Reference Glanz, Bader and Iyer21–Reference Cohen and Lesser27), particularly when purchasing decisions are unplanned(Reference Glanz, Bader and Iyer21,Reference Dijksterhuis, Smith and Van Baaren28) . Several studies have investigated availability and marketing of food within supermarkets. In relation to availability of healthy and unhealthy foods, a UK study of twelve supermarkets found 36 % of all food and beverages were high in fat and/or sugar, despite recommendations that these foods make up no more than 8 % of the diet(Reference Mulrooney and Bell29). A number of studies have compared shelf space of selected categories of healthy and discretionary food. An eight-country study that calculated the ratio of shelf space allocated to fruit and vegetables compared with that for chips, chocolate, confectionery and soft drinks found Denmark and the UK had far higher (healthier) ratios than Canada, the Netherlands, New Zealand, USA, Australia and Sweden(Reference Thornton, Cameron and McNaughton30). Other studies conducted in New Zealand(Reference Vandevijvere, Waterlander and Molloy31) and the USA(Reference Farley, Rice and Bodor32) showed significantly more shelf space devoted to selected categories of discretionary food than healthy food. In relation to placement of foods in promotional displays, discretionary food has been found to be prominent in end-of-aisle and checkout displays in studies from Australia(Reference Thornton, Cameron and McNaughton33), USA(Reference Miller, Bodor and Rose34), UK(Reference Ejlerskov, Stead and Adamson35,Reference Horsley, Absalom and Akiens36) and New Zealand(Reference Vandevijvere, Waterlander and Molloy31), while island bins (temporary, free standing displays) are also often used in prominent in-store locations to display discretionary food(37). Importantly, there have been no relevant studies of the healthiness of in-store supermarket environments in Australia since 2012.
In Australia and many higher-income countries, both dietary patterns and the incidence of NCD are socio-economically patterned(38–Reference Grech, Sui and Siu42). Studies have found differences in healthiness of supermarket food environments according to socio-economic position (SEP), including investigations of shelf space devoted to healthy v. unhealthy food in Australia (thirty-five stores)(Reference Cameron, Thornton and McNaughton43) and New Zealand (204 stores)(Reference Vandevijvere, Waterlander and Molloy31). Other studies have found no association with SEP including one small study of shelf space in nine Australian stores(Reference Vinkeles Melchers, Gomez and Colagiuri44), one study examining number of snack food varieties available in-store(Reference Ball, Timperio and Crawford45) and studies measuring other aspects of the in-store environment (checkout displays, end-of-aisle displays and island bin displays)(Reference Vandevijvere, Waterlander and Molloy31,Reference Thornton, Cameron and McNaughton33) .
A number of instruments have been used to measure healthiness of in-store supermarket environments, typically assessing either availability(Reference Ohri-Vachaspati and Leviton46,Reference Black, Ntani and Inskip47) or placement(Reference Kerr, Sallis and Bromby48) of food in-store. The International Network for Food and Obesity/NCD Research, Monitoring and Action Support (INFORMAS), an international network that aims to monitor healthiness of food environments globally, has developed a protocol for determining both availability and placement of food in retail food environments(Reference Swinburn, Sacks and Vandevijvere49). Our study aimed to apply the INFORMAS approach to assess availability and placement of healthy and discretionary food in Australian supermarkets and examine variation by supermarket chain and area-level SEP.
Methods
A random sample of 104 stores from four Australian supermarket groups: Coles, Woolworths, Aldi and Independent stores (referred to herein as ‘Independent’, and primarily branded as IGA and Foodworks stores) were included in the current study (n 26 for each group). Prior consent to collect data was obtained from head offices of Coles, Woolworths and Aldi. Consent from store managers of independently owned stores was obtained at the time of data collection.
Sampling
The study was undertaken in neighbourhoods in Victoria classified as ‘major cities of Australia’ by the Australian Bureau of Statistics (ABS), which encompassed greater metropolitan Melbourne and Geelong(50). Sampling only from ‘major cities’ was a pragmatic decision. Neighbourhoods were categorised using Statistical Area Level 2 (SA2) classification produced by the ABS(51). SA2 areas (average population 10 000) represent functional areas where people come to access services, including grocery stores(39). SA2 areas were ranked by quintiles of the ABS Index of Relative Socio-economic Advantage and Disadvantage (IRSAD) with a lower quintile indicating greater relative disadvantage and a lack of advantage in general(52).
Stores were chosen from randomly selected SA2 areas listed in the ‘major cities of Victoria’ category by the ABS, stratified by IRSAD quintile. A random sequence of SA2 areas for each IRSAD quintile stratum was produced. For each supermarket group, a total of ten stores from quintile 1 (Q1) and four stores from each of the remaining quintiles (Q2, 3, 4 and 5) were selected. Given dietary patterns and incidence of NCD are socio-economically patterned(38–Reference Grech, Sui and Siu42), IRSAD quintile 1 was over-sampled to increase power to detect differences between the most disadvantaged (Q1) and all other areas (Q2–Q5). Stores located in each of the randomly selected SA2 areas were identified by overlaying the ABS Australian Statistical Geography Standard Map(53) onto Google Maps. One store per supermarket group was randomly selected in each SA2. Because not all supermarket groups were represented in every SA2, this process was repeated until the required number of stores per chain and IRSAD quintile were obtained. Sample size was defined based on a pragmatic approach rather than sample size calculations, as previous studies did not use comparable outcomes to the ones proposed for the current study. The 104-store sample included approximately 18 % of all full-service supermarkets (excluding express supermarkets) located in the ‘major cities of Victoria’ and was deemed sufficient to detect meaningful differences by supermarket group or by area-level SEP.
Audit tool and measures
A supermarket audit tool was developed for the Australian supermarket context, based on the INFORMAS protocol(Reference Ni Mhurchu, Vandevijvere and Waterlander54) and a previous application of that protocol in New Zealand(Reference Vandevijvere, Waterlander and Molloy31). The audit tool can be found in online supplementary material, Supplemental file 1. In addition to measures assessing availability and placement of food, we collected data on in-store price promotions, the results of which will be the subject of a separate report. Healthiness of food was defined according to the Australian Dietary Guidelines(55) and ABS Discretionary Food List(12). Food was classified as ‘healthy’ if it was a ‘Five Food Group’ food (vegetables and legumes/beans; fruit; grain (cereal) foods; lean meats, poultry, fish, eggs and meat alternatives; dairy and dairy alternatives), unsaturated oil/spreads or water. Discretionary food included chocolate, confectionery, chips/crisps, sweet biscuits, sugar and artificially sweetened beverages and other food items listed in the ABS Discretionary Food List(12). Food unable to be classified as healthy or discretionary, such as formulated supplementary foods and culinary ingredients (e.g. protein supplements, meal kits and baking powder), and non-food items were categorised separately.
Availability of healthy and discretionary food in usual aisle location
Relative availability of discretionary food compared with healthy food was assessed by measuring shelf space of the static display (usual aisle location) of selected categories of discretionary food (chocolate, confectionery, chips/crisps, sweet biscuits, soft drinks and energy drinks) and selected categories of healthy food (fresh and frozen fruit and vegetables). For this measure, temporary island bins and end-of-aisle displays, on promotional rotation, were excluded. Selection of food categories was based on an INFORMAS validation study that found these food categories to be a valid proxy for overall in-store availability of healthy and unhealthy food in New Zealand supermarkets(Reference Vandevijvere, Mackenzie and Ni Mhurchu56). Due to the prominence of ice cream in Australian supermarkets, shelf space for ice cream was also measured and included in a separate calculation. Shelf space, in square metres, was calculated by measuring shelf length of a category (using a measuring wheel) and multiplying this by shelf height. Shelf height was determined for each supermarket group by calculating the average shelf height for each category in a sub-sample of approximately 25 % of stores. For fruit and vegetables, shelf space was calculated by measuring length × width of fruit and vegetable display bins, plus length × height of vertical shelves (both refrigerated and frozen). Proportion of shelf space allocated to discretionary food was the total shelf space of selected categories of discretionary food divided by the combined shelf space of all selected categories of healthy and discretionary food.
Placement of discretionary food in checkouts and dynamic promotional displays
Placement of discretionary food at checkouts and in promotional displays at end-of-aisles, as well as temporary, free-standing island bin displays throughout the store, was assessed in two ways: (1) For each display type (checkout, end-of-aisle and island-bin displays), an indicator variable (yes/no) was created to record whether the display contained discretionary food. For each display type, the proportion of displays containing discretionary food was calculated as the percentage of all displays and (2) the proportion of space devoted to discretionary food within each type of display was calculated as total space devoted to discretionary food divided by total space of the type of display. End-of-aisle displays were measured separately for those facing front-of-store and those elsewhere, checkout displays were assessed separately for those serviced by staff (staff-assisted) and self-service checkouts (self-checkouts) and island bins were assessed separately for those located near checkouts, near end-of-aisles, near store entrance and elsewhere in-store. To calculate space in end-of-aisle displays, a weight was given to each section of the display (centre display = 0·5, left side display = 0·25, right side display = 0·25). For island bins, a weight was applied based on the size (surface area) of island bins (small (<1 m2) = 0·5, medium (1–1·5 m2) = 1, large (1·5–2 m2) = 1·5, extra-large (>2 m2) = 2). For checkouts, side displays (displays above conveyer belt) and end displays were considered to be of equivalent size (no weight applied). Display type details can be found in online supplementary material, Supplemental file 1, Addendum A.
Store size was calculated by measuring the perimeter of the inside of the store, in metres, using a measuring wheel. The number of checkouts promoted as healthy (e.g. ‘confectionery-free’) was also recorded.
Data collection and statistical analysis
Each store was visited once by one of the two data collectors trained in the audit tool, over a period of 8 weeks in June and July 2019. This period was chosen to exclude Christmas, Easter and other major events likely to significantly affect dynamic promotional displays. Data collectors audited an equal number of stores from each supermarket group. Inter-rater reliability was assessed estimating intra-class correlation coefficient based on audits of four stores (one from each chain), with each store audited by both data collectors on the same day. All outcomes showed high inter-rater reliability (intra-class correlation coefficient = 0·97–0·99).
Data were analysed using STATA 16 statistical software package (Statacorp). Descriptive statistics (mean proportions and 95 % CI) were obtained for each outcome. IRSAD quintiles were categorised into three groups according to the level of SEP (Q1: most disadvantaged; Q2–3: medium disadvantage and Q4–5: least disadvantaged). Outcome measures were compared across supermarket groups and SEP strata using linear regression models which included supermarket group (four levels: Coles, Woolworths, Aldi and ‘Independent’), SEP (three levels: Q1, Q2–3 and Q4–5) and the interaction group by SEP. Pairwise comparisons between supermarket groups or SEP levels were Sidak’s adjusted.
Results
A total of 104 stores were audited across four supermarket groups: Coles, Woolworths, Aldi and ‘Independent’ (n 26 for each group) and three IRSAD quintile groups: Q1 (n 40); Q2–3 (n 32) and Q4–5 (n 32). A total of twelve independent stores declined to participate in the study and were replaced by independent stores from the nearest SA2 area with the same IRSAD quintile ranking. Table 1 describes characteristics of stores in the sample.
Table 1 Characteristics of a sample of 104 Australian supermarkets audited in 2019

Shelf space of food in usual aisle location
Proportion of shelf space devoted to selected categories of discretionary food relative to selected categories of healthy food was calculated for each store. Across all stores, 66·6 % (95 % CI 64·7, 68·5 %) of measured shelf space was devoted to discretionary food, with ‘Independent’ stores having more shelf space devoted to discretionary food (72·7 %), than Woolworths (65·7 %), Coles (64·8 %) and Aldi (63·2 %), all P < 0·005.
Shelf space in ‘Independent’ stores was clearly different from the other three supermarket groups across SEP levels (interaction of supermarket group by area-level SEP, P = 0·002) (Fig. 1). Due to this fact, the same analysis excluding ‘Independent’ stores was conducted (Table 2). In that analysis, no other significant interactions between supermarket group and area-level SEP (P = 0·947) or supermarket group effect (P = 0·814) were found, but a significant SEP effect (P = 0·020) was observed overall. Stores located in the lowest SEP areas (Q1) had an additional 9·7 % of shelf space for discretionary food than stores in the highest SEP areas (Q4–5) (P < 0·001) and 7·1 % more shelf space for discretionary food than stores in medium SEP areas (Q2–3) (P = 0·002) (Table 2). Within each chain, there appeared to be a pattern whereby stores in lower SEP areas had a higher proportion of discretionary food, although these differences were not statistically significant (Fig. 1). When shelf space for ice cream was included in discretionary food categories, similar differences between chains and area-level SEP were found. See online supplementary material, Supplemental file 2, for average shelf space of each category measured.

Fig. 1 Mean proportion of shelf space of key categories of discretionary food as a proportion of the combined shelf space of key categories of discretionary and healthy food*, by supermarket group and area-level socio-economic position (SEP)†. Figure depicts results of linear regression models that included supermarket group, SEP and interaction of supermarket group by SEP. *Discretionary food refers to chocolate, confectionery, sweet biscuits, chips, soft drinks and energy drinks; healthy food refers to fresh and frozen fruit and vegetables. †SEP based on quintiles of Australian Bureau of Statistics Index of Relative Socio-economic Advantage and Disadvantage (IRSAD)
Table 2 Mean proportion of shelf space devoted to selected categories of discretionary food as a proportion of the combined shelf space of selected discretionary and healthy food*, by supermarket group and area-level socio-economic position (SEP)†,‡
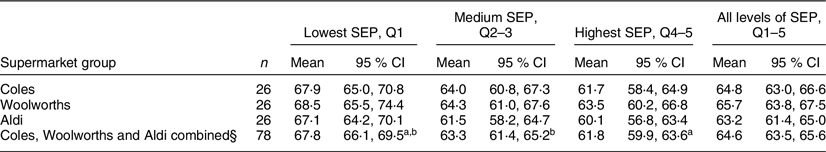
Values within rows with the same superscript letter denote that means were significant different a P < 0·001; b P = 0·002.
* Discretionary food refers to chocolate, confectionery, sweet biscuits, chips, soft drinks and energy drinks; ‘healthy’ food refers to fresh and frozen fruit and vegetables.
† SEP based on quintiles of Australian Bureau of Statistics Index of Relative Socio-economic Advantage and Disadvantage (IRSAD).
‡ Results of linear regression models that included supermarket group, SEP and interaction of supermarket group by SEP.
§ ‘Independent’ group excluded from analysis. See Fig. 1 for results of regression model including ‘Independent’ group.
End-of-aisle
End-of-aisle displays
Across all stores, 50·2 % (95 % CI 47·6, 52·7 %) of end-of-aisle displays included discretionary food (52·1 % near front-of-store and 46·8 % elsewhere in-store) (Table 3). There were no differences between supermarket groups. Of note, Aldi had significantly fewer end-of-aisle displays than Coles, Woolworths and Independents (all P < 0·001) (Table 1). Proportion of space in end-of-aisle displays devoted to discretionary food was 30·1 % (95 % CI 28·2, 32·1 %) across the entire sample (33·8 % near front-of-store and 27·1 % elsewhere in-store) (Table 4). Of end-of-aisle displays near the front-of-store that had a discretionary food present, 72·3 % (95 % CI 67·3, 77·4 %) of display space was devoted to discretionary food. Aldi had a significantly lower proportion of space devoted to discretionary food in end-of-aisle displays compared with all other supermarket groups (all P < 0·001), while no differences were found between the other three supermarket groups (Table 4).
Table 3 Mean percentage (%) of promotional displays that included a discretionary food or beverage (95 % CI) in a sample of 104 Australian supermarkets in 2019
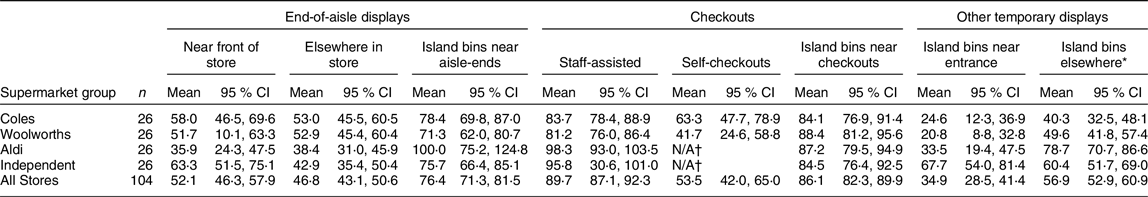
* Island bins elsewhere refer to island bins found in any location except those near checkouts, end-of-aisles and store entrance.
† Self-checkouts not present at Aldi and ‘Independent’ stores.
Table 4 Mean proportion (%) of space in promotional displays (end-of-aisle, checkouts and island bins) devoted to discretionary food (95 % CI) in a random sample of 104 Australian supermarkets in 2019
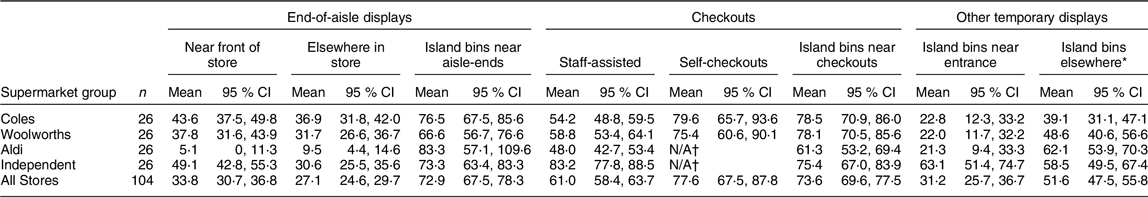
* Island bins elsewhere refer to island bins found in any location except those near checkouts, end-of-aisles and store entrance.
† Self-checkouts not present at Aldi and ‘Independent’ stores.
Island bins near end-of-aisles
Across all supermarkets, discretionary food was present in 76·4 % (95 % CI 71·3, 81·5 %) of island bins located near aisle-ends and an average of 72·9 % (95 % CI 67·5, 78·3 %) of space within those island bins was devoted to discretionary food. No significant differences between supermarket groups were observed for either measure (Tables 3 and 4). Notably, Aldi had significantly fewer island bins located near aisle-ends (Table 1).
No differences were observed according to SEP, and no significant interactions were observed between supermarket group and area-level socio-economic disadvantage for measures relating to end-of-aisle displays or island bins near aisle-ends. See online supplementary material, Supplemental file 3, for the mean proportion of discretionary food space in all display types by supermarket group and area-level socio-economic disadvantage.
Checkouts
Checkout displays
Across all stores, 83·4 % (95 % CI 80·3, 86·6 %) of checkouts included discretionary food (89·7 % of staff-assisted checkouts and 53·5 % of self-checkouts) (Table 3). The percentage of staff-assisted checkout displays with discretionary food was greatest in Aldi (98·3 %) and ‘Independent’ (95·8 %) stores, which were significantly greater than Coles (83·7 %, P = 0·001 and P = 0·007, respectively) and Woolworths (81·2 %, P < 0·001 and P = 0·001, respectively) (Table 3). There were no significant differences between Coles and Woolworths stores. Self-checkouts were only present at Coles and Woolworths stores, which had discretionary food present in 63·3 and 41·7 % of displays, respectively (Table 3). One Coles and one Woolworths store had two staff-assisted checkouts each (0·5 % of all staff-assisted checkouts assessed) that were promoted as confectionery-free or lolly-free. Products displayed at these checkouts included batteries and ‘health and beauty’ items, and no drinks fridge. No checkouts were promoted as confectionery-free in Aldi or ‘Independent’ stores.
Proportion of space in checkout displays devoted to discretionary food was 63·7 % (95 % CI 60·6, 66·7 %) across all stores (61·0 % at staff-assisted checkouts and 77·6 % at self-checkouts) (Table 4). Proportion of space devoted to discretionary food in staff-assisted checkout displays was higher for ‘Independent’ stores than all other supermarket groups (all P < 0·001). Aldi had the lowest proportion of space devoted to discretionary food, which was significantly different from Independents (P < 0·001) and Woolworths (P = 0·035). No significant difference was found between Coles and Woolworths (Table 4).
Island bins near checkouts
The percentage of island bins located near checkouts that included discretionary food was 86·1 % across all stores (Table 3). Proportion of space within these island bins devoted to discretionary food was 73·6 % (Table 4). Aldi had the lowest proportion of space devoted to discretionary food in island bins near checkouts, significantly lower than Coles (P = 0·011), Woolworths (P = 0·014) and ‘Independent’ (P = 0·032) (Table 4). No differences were observed between other supermarket groups. On average, Aldi also had significantly fewer island bins near checkouts than Coles and Woolworths (Table 1).
No differences were observed according to SEP, and no significant interactions were observed between supermarket group and area-level socio-economic disadvantage for checkout displays and island bins near checkouts (online supplementary material, Supplemental file 3). The most common foods found at checkouts and end-of-aisle displays were ‘chocolate and confectionery’ and beverages such as sugar and artificially sweetened soft drinks, energy drinks, sports drinks and ice tea. See online supplementary material, Supplemental file 4, for the most prevalent food categories found in promotional displays.
Other temporary displays
Aldi had the lowest number of island bins, overall and across all in-store locations (Table 1). Across all supermarkets, the percentage of island bins near store entrance that included discretionary food was 34·9 % (Table 3), with 31·2 % of space in these island bins devoted to discretionary food (Table 4). ‘Independent’ stores had a higher percentage of discretionary island bins near store entrance than Coles and Woolworths (both P < 0·001) and Aldi (P = 0·010). ‘Independent’ stores also had a high proportion of space devoted to discretionary food compared with all other supermarket groups (P < 0·001).
For island bins ‘elsewhere’ in-store, 56·9 % contained discretionary food (Table 3) and 51·6 % of space within these island bins was devoted to discretionary food (Table 4). Aldi (62·1 %) and Independents (58·5 %) had the highest proportion of space devoted to discretionary food in island bins located ‘elsewhere’, which was significantly higher than Coles (P = 0·001 and P = 0·006, respectively) and non-significantly higher than Woolworths (Table 4).
Island bins near store entrance and elsewhere in-store had the lowest proportion of space devoted to discretionary food compared with island bins near end-of-aisles and checkouts. All measures related to island bins located near store entrance and ‘elsewhere’ in-store showed no difference according to SEP, and no significant interactions were observed between supermarket group and area-level socio-economic disadvantage (online supplementary material, Supplemental file 3). See online supplementary material, Supplemental file 4, for the most prevalent food categories found in island bins.
Discussion
The current study assessed availability and placement of healthy and discretionary food within all major Australian supermarkets by level of socio-economic disadvantage. In all Australian supermarkets, discretionary food was found to be common at end-of-aisles and almost universally present at checkouts. Significant differences were observed between supermarket groups in relation to the number of displays (far fewer in Aldi) and types of products displayed. Aldi had the least space devoted to discretionary food in end-of-aisle displays and checkout displays, while ‘Independent’ stores had the highest figures for these same indicators, as well as the greatest proportion of shelf space devoted to discretionary food. Findings overall were similar for Coles and Woolworths, Australia’s two largest supermarket retailers. Socio-economic patterning was observed for shelf space, but not other indicators, with a greater proportion of space devoted to discretionary food in the most disadvantaged areas.
These results are broadly consistent with the previous literature(Reference Vandevijvere, Waterlander and Molloy31,Reference Thornton, Cameron and McNaughton33,Reference Cameron, Thornton and McNaughton43,Reference Parkinson, Dixon and Scully57) . Our findings that discretionary food was present in 50 % of end-of-aisle displays was similar to a New Zealand study that found 53 % of end-of-aisles displayed ‘junk food’(Reference Vandevijvere, Waterlander and Molloy31). Furthermore, our study found discretionary food in 52 % of front end-of-aisle displays and 47 % of end-of-aisle displays elsewhere in-store, which was broadly consistent with an earlier Australian study that found a limited number of discretionary foods (chips, chocolate, confectionery and soft drinks) were present in 38 % of front-facing and 33 % of end-of-aisle displays elsewhere(Reference Thornton, Cameron and McNaughton33). End-of-aisle displays are a ‘prominent’ in-store location and have been strongly linked with increased product purchases(Reference Glanz, Bader and Iyer21,Reference Inman, Winer and Ferraro24,Reference Nakamura, Pechey and Suhrcke25) . Given approximately two-thirds of food purchasing decisions are made while in-store, marketing decisions to place discretionary food in prominent end-of-aisle displays is likely to have considerable impact on the healthiness of food choices made(Reference Glanz, Bader and Iyer21).
All stores in our study had discretionary food at checkouts, with 90 % of staff-assisted checkouts displaying discretionary food (most commonly chocolate, confectionery and discretionary beverages). This is comparable to previous Australian studies that found 99 % of stores displayed chips, chocolate, confectionery or soft drinks at checkouts(Reference Thornton, Cameron and McNaughton33) and 80 % of staff-assisted checkouts displayed chocolate, gum or confectionery(Reference Parkinson, Dixon and Scully57). Our results were also consistent with a recent New Zealand study that found ‘junk food’ in 85 % of checkout displays(Reference Vandevijvere, Waterlander and Molloy31). These findings suggest that it is near impossible to pay for groceries in major Australian supermarkets without being exposed to discretionary food and beverages.
Similar to the previous New Zealand study, some significant differences between supermarket groups were observed for all indicators(Reference Vandevijvere, Waterlander and Molloy31). However, there was not one chain that was consistently better on all indicators. For example, Aldi had the highest percentage of checkout displays with discretionary food, but the proportion of space devoted to discretionary food at Aldi checkouts was lower than Woolworths and ‘Independent’. Aldi also had a significantly lower proportion of space devoted to discretionary food at end-of-aisle displays, as well as fewer end-of-aisle displays compared with all other supermarket groups. These findings reflect important differences in business practices of the major supermarket chains. In particular, Aldi has a substantially different business model in which they predominantly stock own-brand products, with few products lines in each category, few price promotions on food and a rotating selection of temporary non-food products. Variability observed across all measures for ‘Independent’ stores may reflect the larger degree of control that individual independent store owners have over their in-store environment. Ways in which public health considerations, such as the relative availability of healthy products, can be integrated and prioritised within business practices of the major supermarket chains warrants further exploration, taking into account their differences in business models.
Consistent with earlier studies in both Australia and New Zealand, shelf space devoted to selected discretionary food was higher in the most compared with the least disadvantaged areas(Reference Vandevijvere, Waterlander and Molloy31,Reference Cameron, Thornton and McNaughton43) . Likewise, studies from the USA(Reference Larson, Story and Nelson58–Reference Franco, Roux and Glass60) and Brazil(Reference Leite, Assis and Carmo61) have also found supermarkets in the most deprived areas were less healthy than other areas. Conversely, the current study found no clear socio-economic patterning for indicators related to checkout, end-of-aisle and island bin displays. The decision-making processes that led to these findings are worth examining to better understand leverage points for change. For example, it appears decisions regarding products placed at end-of-aisle displays are applied relatively consistently across all stores of a chain. Factors such as store size, store format and age of the store fittings are potentially stronger drivers of the healthiness of in-store environments than area-level socio-economic status.
There is some evidence from previous studies investigating ‘food deserts’ (areas in which there is limited access to healthy food) that suggests that the presence of supermarkets can improve the healthiness of neighbourhood food environments(Reference Glanz, Sallis and Saalens62), although these findings are not universally true(Reference Ghosh-Dastidar, Hunter and Collins63–Reference Giskes, Van Lenthe and Brug65). Indeed, the heavy promotion of discretionary food within supermarkets means that despite the fact that they typically sell a wide range of healthy food, supermarkets cannot be categorised as entirely healthy places to shop. Availability and promotion of discretionary food need to be taken into account when measuring the healthiness of supermarkets and when considering their potential role in improving population diets.
The current study, along with others, shows the unhealthy state of current supermarket food environments in Australia. Decisions regarding the marketing of food in supermarkets are the result of complex relationships between food and beverage companies and retailers. Food manufacturers pay for shelf space to promote their products in prominent promotional displays, and it is mostly larger manufacturers (such as multinational producers of processed foods) that can afford this(Reference Rivlin66). Placement and promotion of food in prominent locations are also more likely to target foods that are typically purchased on impulse, which are largely discretionary in nature(Reference Inman, Winer and Ferraro24,Reference Piacentini, MacFadyen and Eadie67) . Promotional displays are often linked to other promotional techniques, such as price promotions and advertising in supermarket circulars (catalogues). Previous Australian research found 43 % of food advertised in Coles, Woolworths, Aldi and IGA catalogues were discretionary(Reference Cameron, Sayers and Sacks68). Furthermore, a recent study that monitored price promotions in an Australian supermarket over a 12-month period found discretionary food were price promoted almost twice as often as healthy food (28·8 v. 15·1 %)(Reference Riesenberg, Backholer and Zorbas69). The relationship between product placement and price promotions in Australian supermarkets will be the subject of a forthcoming paper from the current study.
Recommendations for supermarkets willing to take action to create healthier in-store environments include policies to ensure healthier checkout and end-of-aisle displays and working towards increasing the proportion of shelf space devoted to healthy food compared with discretionary food. To date, food manufacturer and supermarkets policy action to restrict availability and promotion of discretionary food has been minimal(Reference Pulker, Trapp and Scott70–Reference Sacks and Robinson72), which is reflected in the similarity between our findings and the only previous study conducted in 2012(Reference Thornton, Cameron and McNaughton33). While a small number of supermarkets in Australia have taken action to promote a small number of confectionery-free checkouts, the results of the current study demonstrate that these types of initiatives need to be expanded in scope to also restrict promotion of discretionary beverages, include both fixed checkout displays and island bins near checkouts, ensure ‘healthier’ checkouts are ‘open’ to shoppers, and rolled out more broadly across supermarket chains
Government regulation in relation in-store availability and placement of discretionary food promoted at key display sites may be required to create a level playing field for all retailers. Policy actions targeting food environments are potentially powerful and equitable because they target the majority of the population(Reference Ni Mhurchu, Vandevijvere and Waterlander54). Recent policy proposals aimed at reducing prominence of unhealthy food and beverages in supermarkets suggest there is potential for governments to intervene through regulatory action. For example, Scottish and UK governments have proposed bans or restrictions on the placement of unhealthy food and drinks in prominent in-store locations, such as checkouts and end-of-aisles(73,74) .
In recent years, governments in Australia have largely favoured voluntary industry approaches to achieving population nutrition-related goals. For example, current flagship Australian government nutrition initiatives include the voluntary Health Star Rating nutrition labelling scheme(75) and the Healthy Food Partnership, a collaboration between the government, public health sector and food industry(76). The Healthy Food Partnership has made some progress in areas related to reformulation, portion sizes and education(76); however, supermarket in-store environments are not currently a priority area. Findings from monitoring studies, such as the current study, could provide evidence for including supermarket in-store environments as part of the partnership’s agenda, as has been the case in New Zealand(77). However, the UK experience of this type of multi-sectoral collaborative approach has been criticised for not delivering meaningful change to population health, and several recommendations to strengthen the impact of the Healthy Food Partnership have been made(Reference Jones, Magnusson and Swinburn78).
Strengths of the current study include the large sample of 104 supermarkets that included stores from all area-levels of SEP. Data collection excluded events that may affect dynamic displays such as Christmas, Easter, Mother’s Day and Halloween when promotion of discretionary food in supermarkets is typically far greater. Therefore, results will not be skewed by these promotional activities; however, findings may under-estimate overall marketing of discretionary food in supermarkets over the course of a year. The audit tool was based on INFORMAS protocols designed for use across countries and included multiple healthiness indicators of supermarket in-store environments. Food categories included for the shelf space measure were based on an INFORMAS validation study that assessed how reflective these categories were of all healthy and unhealthy food in New Zealand supermarkets. Previous studies, including the New Zealand study based on the INFORMAS protocols, measured only the percentage of displays containing discretionary food. This was the first study to also measure the proportion of space in promotional displays devoted to discretionary food, providing a deeper insight into the degree to which discretionary food is marketed. Inter-rater reliability of all measures used was very strong.
The findings should be interpreted in light of the following limitations. Resource constraints meant sampling was restricted to ‘major cities’ of Victoria and these findings may not equally apply elsewhere in Australia, or in rural and remote areas. A larger sample size, incorporating more diverse geographical areas in Australia, would be of value. Non-response from 31·6 % of independent stores may have biased the ‘Independent’ sample; however, replacement stores were also independent, and from nearby areas with the same level of disadvantage. Data collection was restricted to 8 weeks, so seasonal variations were not assessed; however, the potential for weekly change in dynamic displays to bias results was mitigated by ensuring data collection in any week included stores from each supermarket group and IRSAD quintile. Shelf space was calculated based on the simple measurement of aisle length × overall shelf height rather than the cumulative length of individual shelves, as was reported in the INFORMAS study from New Zealand(Reference Vandevijvere, Waterlander and Molloy31). In addition, shelf space devoted to discretionary food was calculated as a proportion of total space of healthy and discretionary food, rather than a ratio measure of healthy to discretionary food, as has been reported in several previous studies(Reference Vandevijvere, Waterlander and Molloy31–Reference Thornton, Cameron and McNaughton33). The calculation of proportions was preferred due to challenges in interpreting and comparing ratio values below and above one (the distance between zero and one being equivalent to the distance between one and infinity); however, direct comparisons of shelf space devoted to discretionary food in the only other study to date using INFORMAS protocols (New Zealand) cannot be made.
Conclusion
Exposure to discretionary food in Australian supermarkets is at odds with Australian Dietary Guidelines, which recommend discretionary food be consumed only sometimes and in small amounts. There are important differences in the healthiness of in-store supermarket environments across supermarket groups and by area-level socio-economic disadvantage that means that discretionary food exposure can depend on where Australians live and the chain at which they shop. Such differences may contribute to variations in Australian diets, and these findings should be used to inform policies (government and corporate) to improve supermarket food environments. A commitment to monitor supermarket environments at regular intervals is required to track changes in food environments, facilitate target setting, evaluate in-store initiatives and hold supermarkets to account for their policy commitments. The audit tool and protocols developed for the current study provide a framework for future monitoring of in-store supermarket environments in Australia and elsewhere. Future research could explore broader characteristics of food systems, including the relationships between food and beverage manufacturers and retailers, to better understand policy and other levers that might help reduce the prominence of discretionary food in supermarkets.
Acknowledgements
Acknowledgements: G.S. is supported by a Heart Foundation Future Leader Fellowship (102035) from the National Heart Foundation of Australia. G.S., A.J.C. and L.O. are researchers within a National Health and Medical Research Council (NHMRC) Centre of Research Excellence in Food Retail Environments for Health (RE-FRESH) (APP1152968) (Australia). G.S. and L.G.D. are researchers within a NHMRC Centre for Research Excellence entitled Reducing Salt Intake Using Food Policy Interventions (APP1117300). A.J.C. is a recipient of a Discovery Early Career Researcher Award (DE160100141) from the Australian Research Council (ARC). Financial support: Funding for this research has been provided from the Australian Government’s Medical Research Future Fund (MRFF). The MRFF provides funding to support health and medical research and innovation, with the objective of improving the health and well-being of Australians. MRFF funding has been provided to The Australian Prevention Partnership Centre under the MRFF Boosting Preventive Health Research Program. MRFF had no role in the design, analysis or writing of this article. Conflict of interest: G.S., A.J.C., J.M. and L.O. are academic partners on a healthy supermarket intervention trial that includes Australian local government and supermarket retail (IGA) collaborators. G.S. led a study to benchmark the policies and commitments of food companies (including supermarkets) related to obesity prevention and nutrition. Authorship: G.S., A.J.C. and E.R. designed the study, with input from L.O. S.S. and L.G.D. conducted data collection. J.M. provided food classification advice. S.S., A.J.C. and L.O. analysed and interpreted the data. S.S. drafted the manuscript, with critical input from all other authors. Ethics of human subject participation: The current study was conducted according to the guidelines laid down in the Declaration of Helsinki, and all procedures involving human subjects/patients were approved by the Deakin University Human Research Ethics Committee (Reference number: HEAG-H 57_2019). Written informed consent was obtained from all subjects/patients.
Supplementary material
For supplementary material accompanying article paper visit https://doi.org/10.1017/S1368980020002505


