


The consumption of sugars has markedly increased since the 19th century, and it still contributes to about 15 % of the daily energy consumption of US children, despite a reduced intake of added sugars in recent years(Reference Welsh, Sharma and Grellinger1). In particular, fructose-containing sweeteners (e.g. sucrose or high-fructose corn syrup) are widely used due to their crispness and positive hedonic taste. Despite similar properties of fructose to glucose, fructose results in specific physiological consequences that are not elicited by glucose or other monosaccharides. Specifically, fructose is first metabolised in the small intestine, followed by the liver where fructose transports (i.e. GLUT2 and GLUT5) and metabolising enzymes are present(Reference Tappy2). Of note, in contrast to tight control over glycolysis, fructose-metabolising enzymes, namely fructokinase and aldolase B, are essentially not regulated; hence almost all fructose transported to the liver is rapidly degraded and induces de novo fatty acid synthesis and possible metabolic disturbances(Reference Tappy2). Despite extensive research in regard to fructose and its implications to metabolic diseases, limited studies have investigated the mechanisms by which xenobiotic signalling pathways are interlinked with fructose consumption.
Living organisms are continuously exposed to foreign chemical species referred to as xenobiotics. These xenobiotics, which are normally not produced or found in an organism, could interact within our bodies and then exert teratogenic, mutagenic and even carcinogenic effects via various mechanisms. As expected, humans have several defence systems against xenotoxic compounds, and biotransformation enzymes (BTE) are part of a complex defence system that plays a central role in the metabolism, elimination and/or detoxification of endogenous and exogenous compounds(Reference Lang and Pelkonen3). Despite their complexity, BTE can be classified into two phases; phase I enzymes are mainly composed of a superfamily of mono-oxygenase enzymes that are haeme-thiolate proteins called cytochrome P450 (CYP)(Reference Byrd and Luther4). In contrast, phase II enzymes consist of diverse superfamilies of enzymes such as uridine 5′-diphospho-glucuronosyltransferases (UGT) and glutathione S-transferases (GST)(Reference Cross and Sinha5). These enzymes are found in a variety of tissues, but are mainly found in the liver. Their conjugation activity usually leads to compound detoxification(Reference Muckel, Frandsen and Glatt6).
Of the multiple signalling pathways, canonical aryl hydrocarbon receptor (AhR) signalling modulates gene expression of diverse BTE. Specifically, AhR is a transcription factor that is activated by ligand binding; once activated, the AhR translocates to the nucleus and forms a heterodimer with the AhR nuclear translocator (ARNT). The heterodimer induces the transcription of target genes, including both phase I and phase II enzymes(Reference Schmidt and Bradfield7). In addition, it is now appreciated that AhR contributes to reducing inflammation as well(Reference Benson and Shepherd8, Reference Ji, Xu and Sun9). Furthermore, AhR-knockout mice are hypersensitive to lipopolysaccharide (LPS)-induced septic shock, suggesting its multifaceted roles in disease development as well as BTE regulation(Reference Sekine, Mimura and Oshima10). In the present study, we fed fructose-supplemented water to mice at their free will for 6 weeks; afterwards, hepatic transcriptomics analysis was performed to comprehensively examine the effects of fructose intake on liver metabolism. In our subsequent computational analyses, it was predicted that AhR signalling is an upstream regulator that governs overall changes in the hepatic transcriptome induced by fructose. This prediction was further validated by quantitative RT-PCR analyses.
Materials and methods
Animal housing, fructose intervention and study design
A total of 24 C57BL/6N mice (both male and female; 4 weeks old) were obtained from the Jackson Laboratory and maintained in cages (six mice per cage) in a windowless room with a 12-h light/dark cycle at a constant temperature of 23 ± 2°C and humidity of 40 ± 10 %. The mice were acclimated for a week prior to study intervention. The control group (CON) mice were fed a commercial pelleted American Institute of Nutrition (AIN)-76A diet (Central Lab Animals) with deionised water. Macronutrient composition of the AIN-76A diet is provided in online Supplementary Table S1. In contrast, the fructose group (FRU) mice were fed the pelleted AIN-76A diet and were subjected to a 34 % fructose solution with the same deionised water(Reference Glendinning, Breinager and Kyrillou11). Fructose-supplemented solutions were prepared using deionised water at room temperature in the animal facility; fresh fructose solutions were provided every 2 d in order to prevent microbial contamination. All animals’ body weights were recorded every week for 6 weeks. After the 6-week intervention, all mice were killed by exsanguination via cardiac puncture under anaesthesia using 2,2,2-tribromoethanon (Sigma-Aldrich). Harvested liver tissues were quickly stored in the RNALater solution (Qiagen) at –80°C until analysed. All animal handling and experiments were performed in accordance with protocols approved by the Institutional Animal Care and Use Committee of the University of Arkansas (Protocol Approval No. 17044).
Hepatic transcriptomic analysis
Total RNA from liver tissue was isolated using the RNeasy Plus Mini Kit (Qiagen). The quality of isolated RNA was first assessed using the conventional A260:280 ratio and A260:230 ratio measurements (SpectraMax i3x Multi-Mode Detection Platform; Molecular Devices), which were both satisfactory. In addition, the RNA Integrity Number (RIN) was assessed using the RNA R6K assay for the Agilent 2200 TapeStation (Agilent Technology) in which RINs ranged between 8·5 and 9·5. Next, RNA sequencing library preparation was carried out at the Research Technology Support Facility of Michigan State University. Liver transcriptome (n 6 per group; both male and female) was analysed via a 1 × 50 bp single-end read using an Illumina HiSeq system (Illumina Inc.) as we described elsewhere(Reference Kong, Hudson and Seo12). The total mapped counts were subjected to log2 transformation based on the number of reads per million in order to stabilise the variance. Normalised values were then subjected to further computational bioinformatics and statistical analyses.
Bioinformatics analyses
For the transcriptomics dataset, a short list of mRNA (or differentially expressed genes, DEG) was generated based on the criteria: mRNA between CON and FRU groups showing a P <0·05 and fold-change >2. To visualise changes within the transcriptome dataset of the CON mice in response to fructose intake, a volcano plot and heat map were generated using the R package software (R Studio 3.5.2 version; The R Foundation; available at r-project.org). The heat map was generated for the shortlisted mRNA by creating a normalised z-score. Also, shortlisted mRNA were subjected to the Protein Annotation Through Evolutionary Relationships (PANTHER) over-representation test in order to assess over-represented (or under-represented) changes associated with transitions between CON and FRU mice; in this, the DEG were compared with default reference lists of PANTHER tools using the Gene Ontology (GO)-Slim Biological Process terms (available at pantherdb.org). P values were adjusted using a Bonferroni correction within the tool, and the over-representation was expressed as fold enrichment.
Similarly, the DEG were subjected to the Ingenuity Pathway Analysis (IPA; Qiagen) software in which Upstream Regulator Analysis was performed in order to identify upstream regulator(s) for DEG and related canonical pathways in response to fructose intervention; these predictions were based on previous knowledge regarding associations between upstream regulators and their downstream target genes archived in the Ingenuity Knowledge Base. P values were calculated by Fisher’s exact test for the Upstream Regulator Analysis. A schematic diagram of data acquisition, bioinformatics analyses and validation experiments is provided in Fig. 1.
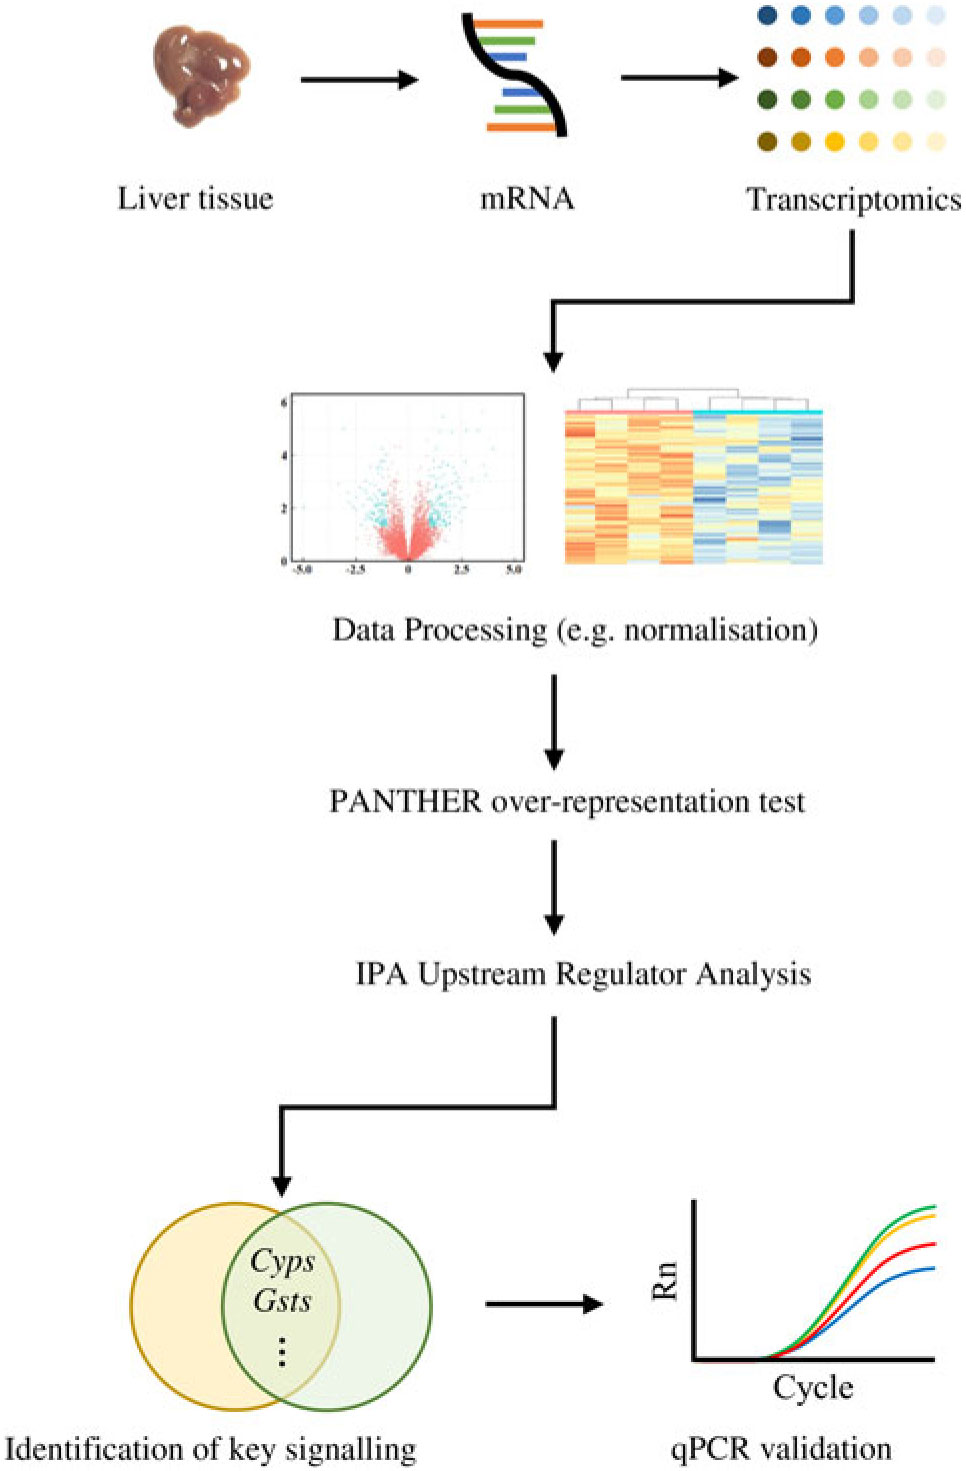
Fig. 1. Analyses of transcriptomics dataset followed by computational analyses and quantitative RT-PCR (qPCR) validation: a flowchart.
In vitro cell culture experiments
AML12 (CRL-2254; American Type Culture Collection (ATCC)), a mouse hepatocyte, was grown in DMEM/F12 media (ATCC) supplemented with 10 % fetal bovine serum, 40 ng/ml dexamethasone and Insulin-Transferrin-Selenium-G supplement (Invitrogen). In addition, HepG2 (HB-8065; ATCC), a human hepatocellular carcinoma, was grown in EMEM media (ATCC) supplemented with 10 % fetal bovine serum. Cultures were maintained at 37°C with 5 % CO2 and water saturation. Cell culture media was refreshed every 2 d and the cells were split once the culture reached 80–90 % confluency. For fructose treatment, the AML12 and HepG2 cells were cultured in six-well plates to 90–95 % confluency. Cells were treated with either 50 mm glucose or 50 mm fructose (FRU) for 72 h. The cells treated with glucose was considered as the control group (CON). For this treatment, a glucose-free medium supplied equal amounts of macronutrients, and media containing glucose or fructose were refreshed daily. Subsequently, the cells were washed with phosphate buffered saline and then harvested for RNA extraction using the RNeasy Plus Mini Kit (Qiagen).
Quantitative RT-PCR analysis
Transcriptomics and computational bioinformatics analyses were validated by quantitative RT-PCR analysis using the StepOnePlus system (Applied Biosystems). Total liver RNA was isolated as described above. Afterwards, 2 μg of total RNA was reverse-transcribed utilising the High Capacity cDNA Reverse Transcription Kit (Applied Biosystems) per the manufacturer’s protocol. The reaction mixture contained TaqMan Gene Expression Mastermix, primers tagged with TaqMan probe, and cDNA. Amplification was conducted under the following conditions: one cycle at 50°C for 2 min and 95°C for 10 min, followed by forty cycles of denaturation (95°C for 15 s) and annealing (60°C for 1 min). Genes of interest were normalised to that of the reference gene (Actb). Data were analysed with StepOne Software (version 2.1; Applied Biosystems) using the 2–ΔΔCT method.
Hepatic lipid accumulation analysis
Liver tissues were fixed in 4 % paraformaldehyde in phosphate buffered saline (w/v) and embedded in the Tissue-Tek Optimal Cutting Temperature compound (Sakura Finetek). The embedded tissues were cut at 5 μm thickness and mounted on staining slides. Tissue sections were rinsed with three changes of distilled water. Subsequently, the tissue slides were placed in absolute propylene glycol for 5 min to avoid carrying water into Oil Red O dye. Afterwards, the tissue slides were placed in Oil Red O solution for 60 min at 60°C. The tissue slides were rinsed in three changes of distilled water followed by counter-staining in Gill No. 2 haematoxylin for 30 s for nucleus staining. The stained tissue slides were washed thoroughly in running tap water for 5 min, and mounted with glycerine-based mounting medium. Stained lipid droplets were visualised using a BX50 microscope (Olympus) and were quantified using ImageJ software (National Institutes of Health).
Statistical analyses
A power calculation was performed using the G*Power software (University of Düsseldorf, Germany) to determine the sample size per group. The sample size for two groups was calculated using a one-way ANOVA test with input parameters as follows: effect size of 0·55, α error probability of 0·05, and power probability of 0·08. As a result, the total sample size required for the study was 24 (twelve mice per group). Data were expressed as means with their standard errors. All data were analysed by a two-tailed Welch’s t test. P ≤0·05 was considered statistically significant (SAS 9.4 version; SAS Institute Inc.).
Results
Six weeks of fructose intervention did not increase body weight gain and liver weight
Ad libitum daily water intake and food intake were measured over 24 h, twice a week throughout the study period. In the CON group, mice consumed 3·32 (se 0·52) g AIN-76A diet per d, whereas the FRU group ate 1·69 (se 0·99) g AIN-76A diet per d, which was statistically different (P = 0·005). In contrast, the FRU group consumed more water (9·45 (se 0·94) ml fructose-supplemented water per mice per d) compared with the CON group (6·74 (se 0·51) ml deionised water per mice per d; P<0·05). When converted to energy intake, the FRU group consumed 18·20 (se 4·93) kcal (76·15 (se 20·63) kJ) per mouse per d, while the CON group consumed 12·58 (se 2·26) kcal (52·63 (se 9·46) kJ) per mouse per d, which was not statistically different (P>0·05); this was consistent with our body weight gain and tissue weight data (Fig. 2(a) and (b)).
Fig. 2. Ad libitum fructose intake did not change body weight and liver weight in C57BL/6N mice. Data are expressed as means with their standard errors (n 12 per group; both male and female; n 6 each). Body weight was monitored throughout the study period, while liver and adipose tissue weights were measured after euthanising mice. No differences were noted in average body weight (a) or tissue weights (b). All data were analysed by a two-tailed Welch’s t test. P ≤0·05 was considered statistically significant (SAS version 9.4; SAS Institute Inc.). -○-, □, Control group; -•-, ▪, fructose group.
Identification of differentially expressed mRNA in response to fructose intervention
In order to explore global impacts of ad libitum fructose intake on hepatic transcriptome, we conducted mRNA expression profiling on the livers of mice fed fructose for 6 weeks via RNA sequencing-based transcriptomics analysis. First, we generated two separate lists of DEG using both male and female sequencing data because sex can be a critical variable in terms of fructose-induced metabolic syndrome(Reference Kang and Kim13). Afterwards, the lists of DEG were subjected to the GO Biological Process analysis separately as shown in the flowchart (Fig. 1). Biological process terms involved in ‘xenobiotic metabolism’ were significantly enriched in both male and female datasets (e.g. ‘P450 pathway’, fold enrichment 27·04 and 30·82 in male and female, respectively; ‘exogenous drug catabolic process’, fold enrichment 15·52 and 17·70 in male and female, respectively; and ‘xenobiotic metabolic process’, fold enrichment 9·96 and 12·61 in male and female, respectively), clearly indicating that the ‘xenobiotic metabolism’ was significantly impacted by fructose, regardless of sex. Therefore, both male and female datasets were combined for further analyses to secure reliable sample size and stronger statistical power. The lists of DEG from male and female mice are available in online Supplementary Tables S2 and S3, respectively.
In our sequencing dataset (combining male and female samples), a total of 8730 transcripts were detected where 4411 genes were up-regulated while 4319 genes were down-regulated in the FRU mice compared with the CON mice. Differences in the expression levels of transcripts between the FRU and CON mice following the criteria of >2-fold under- or overexpression and statistical significance (P<0·05) were displayed using a volcano plot. Based on these criteria, we identified eighty-nine down-regulated and eighty-eight up-regulated mRNA in the FRU mice liver samples compared with those of CON mice liver samples. The mRNA that passed the criteria were highlighted in bright blue, while those that failed were marked in red (Fig. 3(a)); a complete list of 177 mRNA (i.e. DEG) is provided in online Supplementary Table S4. Using the DEG, a hierarchical clustering analysis was conducted, which clearly depicted segregations within the shortlisted mRNA of respective groups and showed different patterns between the FRU and CON mice (Fig. 3(b)).
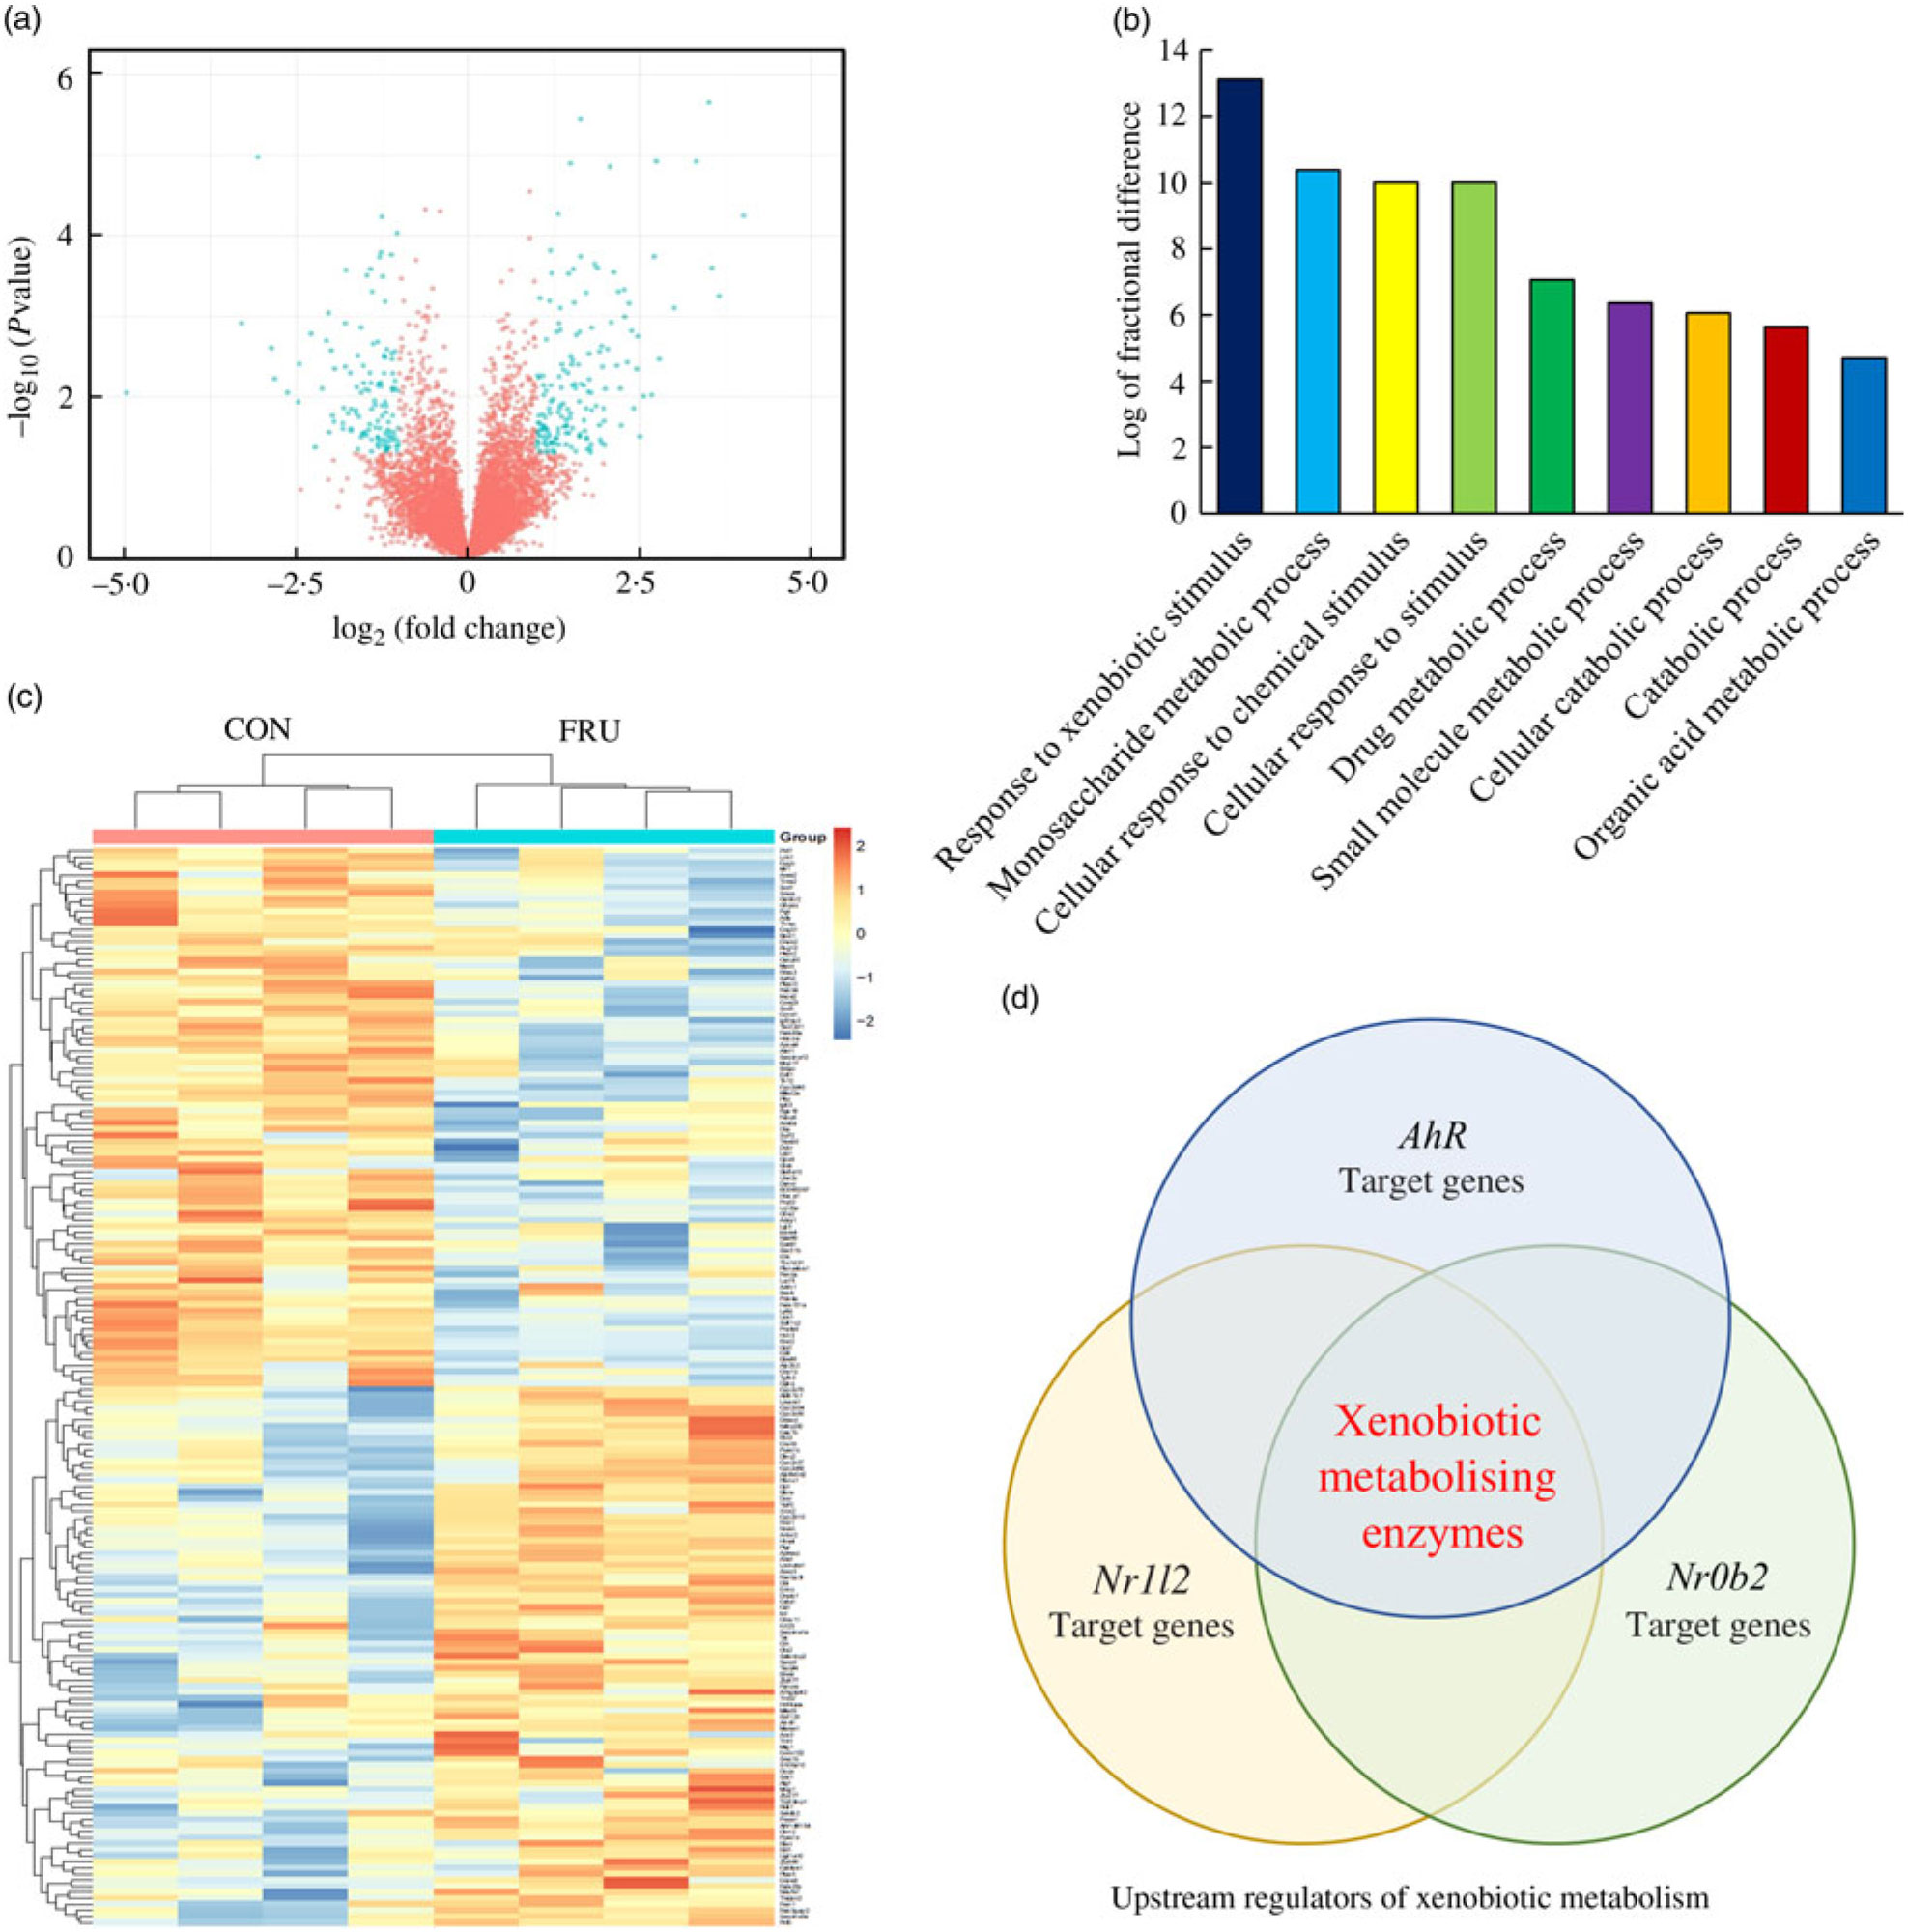
Fig. 3. Volcano plot, heatmap, Protein Annotation Through Evolutionary Relationships Gene Ontology (PANTHER GO) analysis and Ingenuity Pathway Analysis (IPA) Upstream Regulator Analysis. To visualise changes in the transcriptome, a volcano plot (a) and heat map (b) were generated using the R software package (R Studio version 3.5.2; The R Foundation). Further, shortlisted mRNA were subjected to the PANTHER over-representation test in which the GO-Slim Biological Process terms were used (c). Last, the short list was subjected to the IPA Upstream Regulator Analysis to identify upstream regulator(s) for differentially expressed genes and related canonical pathways in response to fructose intervention (d). Of the top twenty upstream regulators identified, aryl hydrocarbon receptor (Ahr), Nr1l2 and Nr0b2 were the three regulators involved in xenobiotics-metabolising enzymes. CON, control; FRU, fructose.
Analysis of Gene Ontology biological processes of differently expressed mRNA using the PANTHER
The PANTHER over-representation tool was used to understand functional classifications of shortlisted mRNA and to help identify the shared biological processes among genes in the list of DEG. As listed, there were nine biological processes that were significantly over-represented in the mRNA retrieved from fructose-fed mice liver transcriptome. In particular, ‘response to xenobiotic stimulus (GO:0009410)’ was over-represented the most in the shortlisted mRNA with a P value of 0·00031 and 14·12-fold enrichment (Table 1). The other biological processes over-represented in the shortlisted mRNA include ‘monosaccharide metabolic process (GO:0005996)’, ‘cellular response to chemical stimulus (GO:0070887)’, ‘cellular response to stimulus (GO:0051716)’, ‘drug metabolic process (GO:0017144)’, ‘small molecule metabolic process (GO:0044281)’, ‘cellular catabolic process (GO:0044248)’, ‘catabolic process (GO:0009056)’ and ‘organic acid metabolic process (GO:0006082)’. These processes were all statistically significantly different in terms of fold enrichment (Table 1).
Table 1. Significantly over-represented biological processes for hepatic transcriptome of fructose-fed mice*
PANTHER, Protein Annotation Through Evolutionary Relationships; GO, Gene Ontology.
* Shortlisted mRNA were subjected to the PANTHER over-representation test in order to assess over-represented (or under-represented) changes associated with transitions between control and fructose-fed mice. P values were adjusted using a Bonferroni correction within the tool, and the over-representation was expressed as fold enrichment.
Analysis of differently expressed mRNA using Ingenuity Pathway Analysis software
According to IPA, the top twenty upstream regulators of DEG were Ppara, Foxo1, Nr1l2, Srebf2, Atp7b, Rorc, Smarcb1, Rora, Mlxipl, Hnf1a, Gpd1, Slc25a13, Slc13a1, Cebpa, Ahr, Fech, Insig1, Acly, Abcb6 and Nr0b2. All of the predicted upstream regulators were statistically significant with P values <0·001 (Table 2). Of the twenty upstream regulators, three (i.e. Nr1l2, Nr0b2, and Ahr) were related to the ‘xenobiotic metabolism signalling’ or ‘AhR signalling’ canonical pathway.
Table 2. Top twenty upstream regulators of shortlisted mRNA*
* The shortlisted mRNA were subjected to Ingenuity Pathway Analysis (IPA) software in which the Upstream Regulator Analysis was used to identify upstream regulators responsible for overall changes in mice liver transcriptome induced by fructose. P values were calculated by Fisher’s exact test for the IPA Upstream Regulator Analysis.
† Canonical pathways were retrieved from Ingenuity Knowledge Base of IPA Gene View that is from categorised literatures.
Quantitative RT-PCR confirmed the suppression of aryl hydrocarbon receptor signalling by fructose
We wanted to confirm if representative genes of the canonical AhR signalling pathway were impacted by fructose as predicted by aforementioned computational analyses. Specifically, Cyp1a2 mRNA expression, a well-characterised target gene of AhR signalling in liver, was first assessed via quantitative RT-PCR. In our transcriptomics analysis, Cyp1a2 was decreased by 25 % in FRU mice (P<0·05), while quantitative RT-PCR validation showed about 48 % decrease in FRU mice (P<0·001; Fig. 4(a)), which led us to further explore whether other AhR-inducible phase II BTE genes are down-regulated in FRU mice livers. Interestingly, in addition to the phase I BTE gene (i.e. Cyp1a2), Gst mRNA possessing xenobiotic response elements (XRE) consensus sequences in mouse were all significantly down-regulated in the FRU mice (i.e. Gsta2, Gsta4, and Gstp1; P<0·01 for all; Fig. 4(b)). Likewise, Ugt1a1, a key phase II BTE gene of xenobiotics and carcinogens, was down-regulated by approximately 40 % in the FRU mice (Fig. 4(b)). Last, the expression level of NAD(P)H:quinone oxidoreductase 1 (Nqo1), containing XRE in its promoter region, was decreased by about 45 % in the FRU mice compared with the CON mice (Fig. 4(b)).
Fig. 4. Ad libitum fructose intake suppressed the canonical aryl hydrocarbon receptor (AhR) signalling pathway: validation experiments. Data are expressed as means with their standard errors (n 4 per group). First, as a representative gene of aryl hydrocarbon receptor (AhR) signalling, Cyp1a2 expression was validated using quantitative RT-PCR (qPCR) (a). Further, downstream genes of AhR signalling pathway were validated: Ugt1a1, Nqo1, Gsta2, Gsta4 and Gstp1 (b). To examine regulatory mechanisms, gene expressions of transcription factors (Ahr and AhR nuclear translocator (Arnt) (c)), negative regulators (Nr2f1, Ncor2 and Nrob2 (d)) and positive regulators (Sp1 and Rb1 (e)) were assessed. All data were analysed by a two-tailed Welch’s t test. P ≤0·05 was considered statistically significant (SAS version 9.4; SAS Institute Inc.). *P<0·05; **P<0·01; ***P<0·001. □, Control group; ▪, fructose group.
Although we predicted and validated that both phase I and phase II BTE genes were down-regulated in mice liver by fructose intervention, the mechanism(s) by which the AhR signalling pathway was suppressed were not clear. Hence, we further examined how fructose influences both positive and negative regulator genes of canonical AhR signalling as well as two transcription factor genes of the AhR heterodimer (i.e. AhR and ARNT). Interestingly, Arnt, one of two transcription factors of AhR signalling, was significantly down-regulated in the FRU mice by approximately 40 % (P<0·001); although it was not statistically significant, there was a trend of decrease in Ahr mRNA expression in the FRU mice as well (P = 0·08) (Fig. 4(c)). We also found that Ncor2, a negative regulator of AhR signalling, was significantly increased (P<0·05), whereas Rb1, a positive regulator, was reduced by 35 % (P<0·05) (Fig. 4(d)), both of which are consistent with target gene expression patterns. However, fructose intervention did not change the expression of Sp1, a regulatory factor that acts on basic transcription element, the other DNA element present in the promoters of CYP, to facilitate interaction between the AhR/ARNT heterodimer and XRE.
In addition to the quantitative RT-PCR validation using mice liver tissues, we further validated key mRNA levels in fructose-treated hepatocytes. Both mouse and human cell lines were treated with 50 mm fructose for 72 h. Expressions of Ahr, Arnt and Cyp1a2 were down-regulated by fructose treatment to AML12 mouse hepatocyte (Fig. 5(a); 12·4, 15·9 and 26·4 %, respectively). Similarly, ARNT and CYP1A2 expressions in HepG2 human hepatocellular carcinoma treated with fructose were significantly down-regulated by 41·5 and 55·1 %, respectively, although a change in AHR was not altered in the FRU group compared with the CON group (Fig. 5(b)). Altogether, our results consistently indicate that fructose intervention may suppress AhR signalling on (1) transcription factor gene expression (specifically Arnt; Figs. 4 and 5) and (2) regulatory factor gene expression (Ncor2 and Rb1; Fig. 4).
Fig. 5. Fructose treatment suppressed aryl hydrocarbon receptor (Ahr), AhR nuclear translocator (Arnt) and cytochrome P450 1A2 (Cyp1a2) mRNA expression in mouse and human hepatocytes. Data are expressed as means with their standard errors (n 6 per group). Expression of key genes in the AhR signalling pathway was validated using quantitative RT-PCR in mouse hepatocyte (AML12 (a)) and human hepatocellular carcinoma (HepG2 (b)) cells. Expression levels of Ahr (AHR), Arnt (ARNT) and Cyp1a2 (CYP1A2) were examined in cells treated with either 50 mm glucose (control; □) or 50 mm fructose (▪) for 72 h. All data were analysed by a two-tailed Welch’s t test. P ≤0·05 was considered statistically significant (SAS version 9.4; SAS Institute Inc.).
Discussion
A hepatic transcriptomics analysis was performed to examine the effect of ad libitum intake of fructose on liver metabolism using mice fed 34 % fructose-supplemented water for 6 weeks. First, we observed fat accumulation in liver tissues (online Supplementary Fig. S1), but there was no change in body, liver or adipose tissue weights. The lack of effects from fructose intervention on body weight gain was somewhat unexpected, especially given the speculation that overconsumption of sugar-sweetened beverages contributes to the metabolic epidemic (e.g. obesity(Reference Berkey, Rockett and Field14)). However, multiple studies have also not observed fructose-induced weight gain in mice, when using fructose intervention conditions similar to our study design(Reference Bergheim, Weber and Vos15, Reference Tillman, Morgan and Rahmouni16). For instance, Tillman et al. (Reference Tillman, Morgan and Rahmouni16) reported no change in body weight although fructose-fed male C57BL/6 mice consumed more energy than the fructose-free diet-fed mice. That study is similar to our design in terms of energy contribution. In our study, approximately 64 % of energy was from fructose, nearly identical to Tillman et al.’s study. Additionally, they used mice of similar ages to ours and started the intervention at the fourth week from birth, which is almost identical to the present study (i.e. started at the fifth week from birth). We cannot explain at this moment what exactly differentiates these studies, but it seems that body weight can be responded differently to fructose intervention depending on even slight changes in experimental design. In addition to the phenotypes assessed in the study, we further utilised knowledge-based computational analyses to gain insight into biological functions and predict key signalling pathways in response to dietary fructose.
Among the nine GO biological processes, ‘response to xenobiotic stimulus (GO:0009410)’ was the most over-represented term (Fig. 3(c)), and three genes related to ‘xenobiotic metabolism signalling’ or ‘AhR signalling’ canonical pathway (i.e. Nr1l2, Nr0b2 and Ahr) were predicted as upstream regulators (Fig. 3(d)). Nr1l2 (which encodes the pregnane X receptor) is a well-known nuclear receptor that regulates the transcription of BTE in response to exogenous compounds such as drugs or toxins(Reference Tolson and Wang17). Xenobiotic-metabolising enzymes regulated by Nr1l2 include both phase I (CYP including CYP1A2) and phase II (UGT and GST) enzymes. Of note, Nr1l2 stimulates Ahr expression and constitutive androstane receptor (or Car) expression, which also induces Ahr expression, suggesting that Nr1l2 serves as a direct or indirect Ahr stimulator(Reference Maglich, Stoltz and Goodwin18). In addition, according to IPA, Nr0b2 (that encodes small heterodimer partner) was a suggested upstream regulator for overall gene expression changes made by fructose. Importantly, Nr0b2 is a known negative regulator of the canonical AhR signalling pathway along with Ncor2 (encodes silencing mediator for retinoic acid and thyroid hormone receptor) and Nr2f1 (encodes COUP transcription factor-1)(Reference Klinge, Jernigan and Risinger19). Lastly, IPA predicted Ahr as an upstream regulator for differentially expressed mRNA within the mice liver transcriptome following fructose intervention (P = 0·0000665; Table 2). Our schematic figure describes that AhR is a transcription factor orchestrating both phase I and phase II enzymes through the formation of heterodimer with ARNT (Fig. 6); the heterodimer might eventually bind to pentanucleotide core sequence (5′-GCGTG-3′) of XRE(Reference Schmidt and Bradfield7).
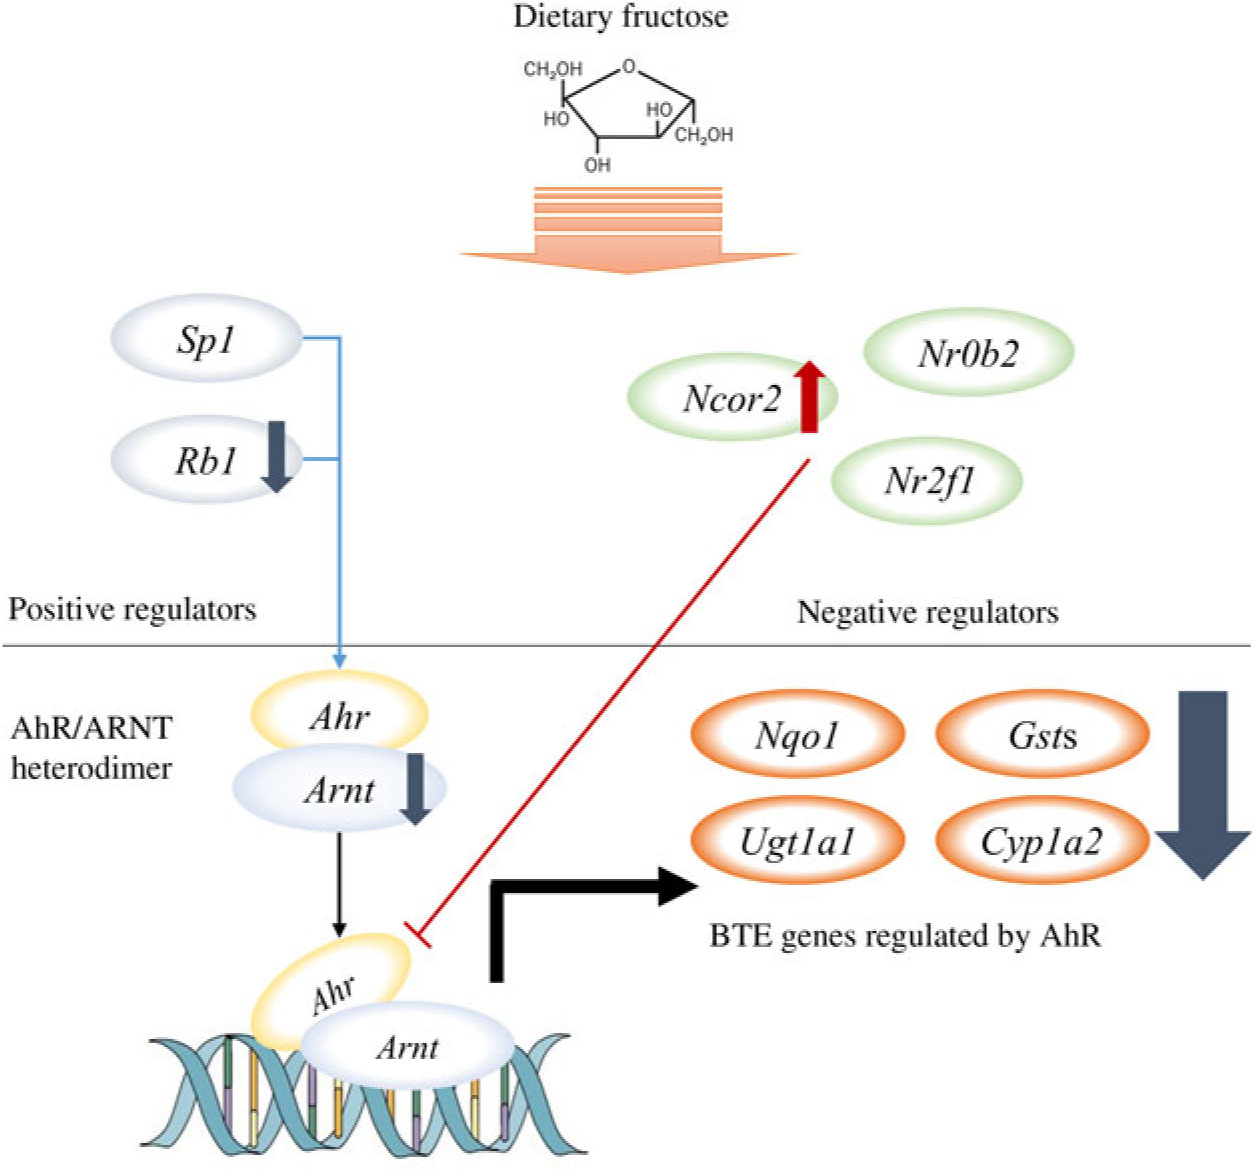
Fig. 6. Schematic pathway. Our unbiased transcriptomics analysis as well as quantitative RT-PCR validation experiments revealed that 6 weeks of ad libitum fructose intake can suppress the canonical aryl hydrocarbon receptor (AhR) signalling pathway. ARNT, AhR nuclear translocator; BTE, biotransformation enzymes.
The canonical AhR signalling pathway is known to control a variety of developmental and physiological events and is transactivated through a ligand-activated heterodimer transcription factor; it is especially well known for its critical roles in detoxification of endo- and xenobiotics through the transcription regulation of BTE(Reference Bock and Kohle20). Therefore, given our current data, it may be reasonable to postulate that fructose intake modulates BTE, thereby compromising the detoxification of many dietary carcinogens that are hydroxylated (by CYP) and conjugated (by GST or UGT) for excretion; examples include heterocyclic aromatic amines, a class of dietary carcinogens(Reference Sugimura, Wakabayashi and Nakagama21). In addition, we found that mRNA expression of Nqo1 was significantly decreased, which also closely relates to protection against oxidative stress and carcinogenesis(Reference Nioi and Hayes22). Therefore, further investigation is needed to examine whether fructose can exacerbate carcinogenicity via the suppression of the AhR signalling pathway.
In addition to its implications for carcinogen metabolism, recent studies demonstrated additional physiological roles of AhR, which include, but not limited to, inflammation (via interacting with RelB of NF-κB(Reference Vogel, Sciullo and Li23)), cell cycle control (e.g. p53 and MYC(Reference Mejia-Garcia, Gonzalez-Barbosa and Martinez-Guzman24)) and epigenetic mechanisms (e.g. chromatin remodelling(Reference Wang and Hankinson25)). Of note, it is now appreciated that AhR has a role in reducing inflammation. In a mouse model of Crohn’s disease, treatment of mice with 2,3,7,8-tetrachlorodibenzodioxin (a known agonist of AhR signalling) prior to induction of disease suppressed inflammation in the gut, as indicated by reduced levels of IL-6, IL-12 and TNF-α(Reference Benson and Shepherd8). Similarly, in mice with dextran sodium sulfate-induced colitis, the activation of AhR reduced levels of IL-7, a cytokine that leads to intestinal inflammation via activating immune responses(Reference Ji, Xu and Sun9). Last, AhR-knockout mice were more sensitive to LPS-induced septic shock, indicating that AhR has a role in antagonising lipopolysaccharide LPS-induced inflammation(Reference Sekine, Mimura and Oshima10). Interestingly, as of February 2019, when using the combination of keywords ‘fructose’ and ‘ahr’, only one relevant study was retrieved from the PubMed database in which researchers examined the effects of antagonist AhR on glucose and fructose utilisation in spermatocytes(Reference Omurtag, Esakky and Debosch26).
When it comes to inflammation, the crosstalk between NF-κB and AhR, downstream genes of the AhR signalling pathway, may also be related to anti-inflammatory effects. Specifically, CYP1A are involved in arachidonic acid metabolism and primarily form terminal/subterminal hydroxyeicosatetraenoic acids, which inhibit neutrophil adhesion and thus are anti-inflammatory(Reference Capdevila, Falck and Harris27, Reference El-Sherbeni and El-Kadi28). Interestingly, our IPA upstream analysis also predicted that arachidonic acid production might be significantly suppressed in the FRU mice (P = 0·0001, z-score = –2·412). Further, CYP1A appear to play a protective role in attenuating inflammation mediated by oxidative stress; this was demonstrated using Cyp1a2-knockout mice in which Cyp1a2-deficient mice were more sensitive to hyperoxic-induced lung damage and had increased levels of TNF-α and IL-6 compared with wild-type mice(Reference Wang, Lingappan and Jiang29). Hence, an activated AhR may reduce inflammation, at least in part, by increasing the expression of CYP1A. The other mechanism of AhR is linked to the Wnt/β-catenin signalling pathway. Aberration of the Wnt/β-catenin signalling pathway has well-established involvement with colon cancer(Reference Krausova and Korinek30). In addition to its role as a transcription factor, AhR is a ligand-dependent E3 ubiquitin ligase(Reference Ohtake, Baba and Takada31). As such, activated AhR participates in β-catenin degradation, thus reducing its aberrant activation and limiting its action to promote unregulated cell proliferation and increase colon cancer risk(Reference Krausova and Korinek30). Collectively, these studies reinforce the significance of this signalling pathway, calling for further comprehensive studies to identify potential mechanistic links between fructose-induced perturbation and other health-related conditions.
In our study, the mice were subjected to fructose-supplemented water at their free will, and hepatic fat accumulation was significantly increased without changing body weight and liver tissue weight. In this, two things should be noted: (1) fructose intake was not matched with other types of carbohydrates consumed in the CON mice although total energy intake was not significantly different; this was demonstrated by the lack of change in body weight gain and tissue weight; and (2) it should be verified whether the burden on liver tissues is a precedent for the AhR signalling pathway. The unmatched carbohydrate intake could be considered a limitation but, at the same time, may better reflect reality, especially considering the well-known effects of fructose on hunger cues. For instance, in humans, after fructose intake, the hypothalamus stays active, while there is little increase in insulin; further, fructose ingestion does not attenuate levels of ghrelin, an appetite stimulation hormone(Reference Page, Chan and Arora32). In order to address the above issues, we are currently planning an additional animal feeding study with a pair feeding design (i.e. matched with other types of carbohydrates (or sugars)); in the follow-up study, longitudinal effects of fructose will be examined by different time points of fructose feeding.
Conclusions and future directions
Here, through an unbiased transcriptomics analysis followed by computational analyses and validation experiments, we demonstrated that ad libitum fructose intake can suppress the canonical AhR signalling pathway in mice, which was further recapitulated in follow-up in vitro experiments. When it comes to regulatory mechanisms, our quantitative RT-PCR validation showed that Ncor2, a negative regulator of AhR signalling, was significantly increased, whereas both Rb1 and Arnt were reduced in the FRU mice; this might have led to the down-regulation of target genes, including both phase I and phase II BTE. Based on our current observations, further studies are warranted, especially with regard to the effects of co-exposure of fructose and (1) other types of carcinogens or (2) inflammation-inducing agents (or even diets such as a high-fat diet), to find implications of fructose-induced suppression of the AhR signalling pathway.
Acknowledgements
The authors thank Elizabeth M. Hopper (University of Arkansas, School of Human Environmental Sciences) for manuscript English editing service, and thank Dr Gisela Erf (Department of Poultry Science, University of Arkansas) for permission to use cryotome and microscope.
This work was supported by the University of Arkansas VPRED start-up fund and Dale Bumpers College of Agricultural, Food and Life Sciences (J. K. K. and J. H. P.). Support has also been provided, in part, by the Arkansas Biosciences Institute, a partnership of scientists from Arkansas Children’s Hospital, Arkansas State University, the University of Arkansas–Division of Agriculture, the University of Arkansas in Fayetteville and the University of Arkansas for Medical Sciences. The Arkansas Biosciences Institute is the major research component of the Arkansas Tobacco Settlement Proceeds Act of 2000 (J. K. K., J. H. P., K. E. B., M. C. R., Y. J. C., and B. C. K.). This work was also supported by the China Scholarship Council (J. T. as a mentee; J. K. K. and J. Z. as mentors).
J. K. K., J. H. L., J. Z. and B. C. K. conceived and designed the present study, discussed the results and wrote the manuscript. J. K. K., J. T., K. E. B., M. C. R., Y. J. C. and J. H. P. performed the experiments. J. T., E. C. S. and J. K. K. carried out statistical analyses, while J. H. P., Y. J. K., B. C. K., J. Z. and J. K. K. contributed to computational bioinformatics analyses. All authors read, edited and approved the submitted manuscript.
The authors have no conflicts of interest to disclose.
Supplementary material
For supplementary material/s referred to in this article, please visit https://doi.org/10.1017/S0007114519001612


