


1. Introduction
The magnitude and duration of fast ice flow events control the transfer rate of ice from interiors to margins of ice sheets, thus influencing their mass balance (Mouginot and others, Reference Mouginot2019; Rignot and others, Reference Rignot2019), potentially raising sea level (Zemp and others, Reference Zemp2019) and controlling the dynamics of marine- and land-terminating outlet glaciers (Patterson, Reference Patterson1997; Jennings, Reference Jennings2006; Ingólfsson and others, Reference Ingólfsson2016; Kochtitzky and Copland, Reference Kochtitzky and Copland2022). Fast-flow events can consist of either monthly to yearly cyclic ice speed-up events with ice moving at velocities up to 100 times faster than normal, referred to as surges (Björnsson and others, Reference Björnsson, Pálsson, Sigurđsson and Flowers2003), or sustained fast-flow along ice stream corridors (20 to 40 times faster than surrounding ice) over decades to centuries (Bennett, Reference Bennett2003), with potential switches from surge- to stream-like flow regimes (Zheng and others, Reference Zheng, Pritchard, Willis and Stearns2019). Periods of ice flow speed-up of smaller amplitudes (up to four times faster than pre-melt speeds) can also occur at daily to seasonal timescales in response to variations in surface melting and runoff supply to the subglacial bed (Davison and others, Reference Davison2020). A relationship between the evolution of subglacial meltwater drainage and ice flow velocity has been demonstrated at daily to seasonal timescales from various investigation methods: tracer experiments, numerical modelling, ground penetrating radar and seismic monitoring (Chandler and others, Reference Chandler2013, Reference Chandler2021; Davison and others, Reference Davison2020; Pitcher and others, Reference Pitcher2020; Nanni and others, Reference Nanni, Gimbert, Roux and Lecointre2021). Studies of long-term (i.e. multi-year or more) evolution of subglacial hydrology inferred from satellites imagery and/or weather stations (Tedstone and others, Reference Tedstone2015; van de Wal and others, Reference van de Wal2015), palaeoglaciology (Jennings, Reference Jennings2006; Burke and others, Reference Burke, Brennand and Perkins2012; Storrar and others, Reference Storrar, Stokes and Evans2014) and modelling (Gagliardini and Werder, Reference Gagliardini and Werder2018; Lelandais and others, Reference Lelandais2018; Hager and others, Reference Hager, Hoffman, Price and Schroeder2021) are very limited. When, where and how subglacial water drainage enhances or impedes glacier flow for timespans stretching beyond the observational record therefore remains uncertain.
Drainage efficiency, by affecting subglacial pressure and basal lubrication is one of the most critical parameters to consider for deciphering the origin and duration of fast ice flow events (Zwally and others, Reference Zwally2002; Das and others, Reference Das2008; Joughin and others, Reference Joughin2008; Palmer and others, Reference Palmer, Shepherd, Nienow and Joughin2011; Fitzpatrick and others, Reference Fitzpatrick2013). The drainage efficiency characterises the rate of meltwater transfer in the subglacial drainage system; as such, it describes the balance between meltwater supply, storage and discharge. Under efficient drainage, all meltwater is routed and transferred to the margin through passageways without causing sustained increase of subglacial water pressure although pressure spikes are commonly recorded when the rate of meltwater delivery is sufficient (Chandler and others, Reference Chandler2021). Under inefficient drainage, the capacity of meltwater transfer is reduced, resulting in higher subglacial water pressure.
Various kinds of meltwater passageways have been recognised over the years and have been generally classified in two categories, respectively associated with (i) efficient and (ii) inefficient drainage (Flowers, Reference Flowers2015). Drainage elements classically associated with efficient drainage include conduits cut either up into the ice (Röthlisberger channel) or down into the bed (Nye channel; meltwater channels, tunnel valleys) (e.g. Röthlisberger, Reference Röthlisberger1972; Shreve, Reference Shreve1972; Hooke and others, Reference Hooke, Laumann and Kohler1990). Inefficient drainage elements are classically characterised by either water films, linked cavities, braided canals or groundwater flows (Lliboutry, Reference Lliboutry1968; Weertman, Reference Weertman1972; Walder, Reference Walder1986; Kamb, Reference Kamb1987; Walder and Fowler, Reference Walder and Fowler1994; Boulton and others, Reference Boulton, Caban and Van Gijssel1995).
Considering the intricate relations between subglacial drainage, water pressure and ice flow velocity at multiple timescales, theories of surging and streaming must better address the issue of long-term drainage efficiency evolution (Kamb and others, Reference Kamb1985; Fowler, Reference Fowler1987; Elsworth and Suckale, Reference Elsworth and Suckale2016; Lelandais and others, Reference Lelandais2018; Benn and others, Reference Benn, Fowler, Hewitt and Sevestre2019). However, direct observations of the subglacial drainage system under present-day ice sheets for decadal to centennial timespans remain challenging for obvious reasons. To circumvent the challenge of long-term monitoring, we associate experimental modelling and palaeoglaciological mapping of subglacial drainage systems beneath outlet glaciers. Recent modelling developments have allowed the evolution of subglacial drainage type (channelized vs distributed) and ice flow dynamics to be experimentally monitored for wet-based and land-terminating outlet glaciers resting on permeable, erodible and deformable sedimentary beds (Lelandais and others, Reference Lelandais2018; Vérité and others, Reference Vérité, Ravier, Bourgeois, Pochat, Lelandais, Mourgues and Atkinson2021). The interplay between the subglacial drainage and ice dynamics have been modelled for unprecedented periods of time (potentially tens to hundreds years) corresponding to the formation and evolution of tunnel valleys (Lelandais and others, Reference Lelandais2016), the lifecycle of ice streams (Lelandais and others, Reference Lelandais2018) or the development of subglacial bedform fields (Vérité and others, Reference Vérité, Ravier, Bourgeois, Pochat, Lelandais, Mourgues and Atkinson2021, Reference Vérité2022). The modelling approach is complementary to the morphometric and spatial analysis of exposed subglacial landscapes where tens to hundreds years of meltwater drainage and ice flow dynamics evolution have potentially been fossilised through assemblages of landforms (eskers, tunnels valleys and channels, moraines) and bedforms (streamlined and ribbed bedforms) assemblages (Kehew and others, Reference Kehew, Nicks and Straw1999; Storrar and others, Reference Storrar, Stokes and Evans2014; Lewington and others, Reference Lewington, Livingstone, Clark, Sole and Storrar2020; Sharpe and others, Reference Sharpe, Lesemann, Knight and Kjarsgaard2021). Considering the enhanced confidence in the hydrodynamic and glaciodynamic interpretation of subglacial landforms and bedforms (Stokes and others, Reference Stokes2018; Ahokangas and others, Reference Ahokangas2021), palaeoglaciology is becoming more and more relevant to inform our understanding of processes occurring at the ice-bed interface for either past and present-day ice sheets.
This approach offers the opportunity to discuss the interplay between drainage efficiency, subglacial bed morphology and the nature of ice speed-up events (i.e. surge- and stream-like flow regimes) for land-terminating glacier margins over multi-annual to decadal timescales. Even though timespans involved might be different, we intend to compare and discuss our results and interpretations to present-day monitoring and modelling of the interactions between subglacial hydrology and ice flow dynamics.
2. Experimental modelling
2.1. Methods
2.1.1. Experimental setup and scenario
The experimental method and scaling are fully described in Lelandais and others (Reference Lelandais2016, Reference Lelandais2018). The model is set in a glass box (70 cm long, 70 cm wide and 5 cm deep) (Fig. 1a). A 5 cm thick, flat, horizontal, permeable, deformable and erodible bed, made of sand (d 50 = 100 μm) saturated with pure water and compacted to ensure homogeneous values for its density (ρ bulk = 2000 kg m−3), porosity (Φ = 41%) and permeability (K = 10−4 m s−1), rests on the box floor. The ice sheet portion is modelled with a 3 centimetre-thick cap of viscous (η = 5 × 10⁴ Pa s−1) and transparent but refractive (n = 1.47) silicone putty placed on the bed (Fig. 1b). The silicone cap is circular in plan view to avoid lateral boundary effects and 15 cm in radius at the onset of the experiments. Subglacial meltwater production is simulated by injection of water with a pump (Fig. 1b). The injector is placed at a depth of 1.5 cm in the bed below the centre of the silicone cap and connected to a pressure sensor. During the experiment, the water discharge generates a water flow within the bed and at the silicone-bed interface. Once injected, water flow occurs as darcian flow within the bed and interfacial flow at the silicone–bed contact. The water flowing at the silicone–bed interface originates from a pipe that forms in the bed above the injector, once the water pressure has exceeded the cumulative pressure of the silicone and sand layers. The ratio between darcian and interfacial flows, as computed from the input discharge, the water discharge through the pipe and the bed permeability, is on the order of 3 (Lelandais, Reference Lelandais2018).

Fig. 1. Description of the experimental device (after Lelandais and others, Reference Lelandais2018) with (a) a setup overview showing the injection apparatus and the monitoring system and (b) a cross-sectional profile of the analogue device displaying the position of UV markers and the physical characteristics of both the bed and the silicone cap. Parameters measured to compute the lobe cover index (L ci) and the drainage cover index (D ci) is presented in (c).
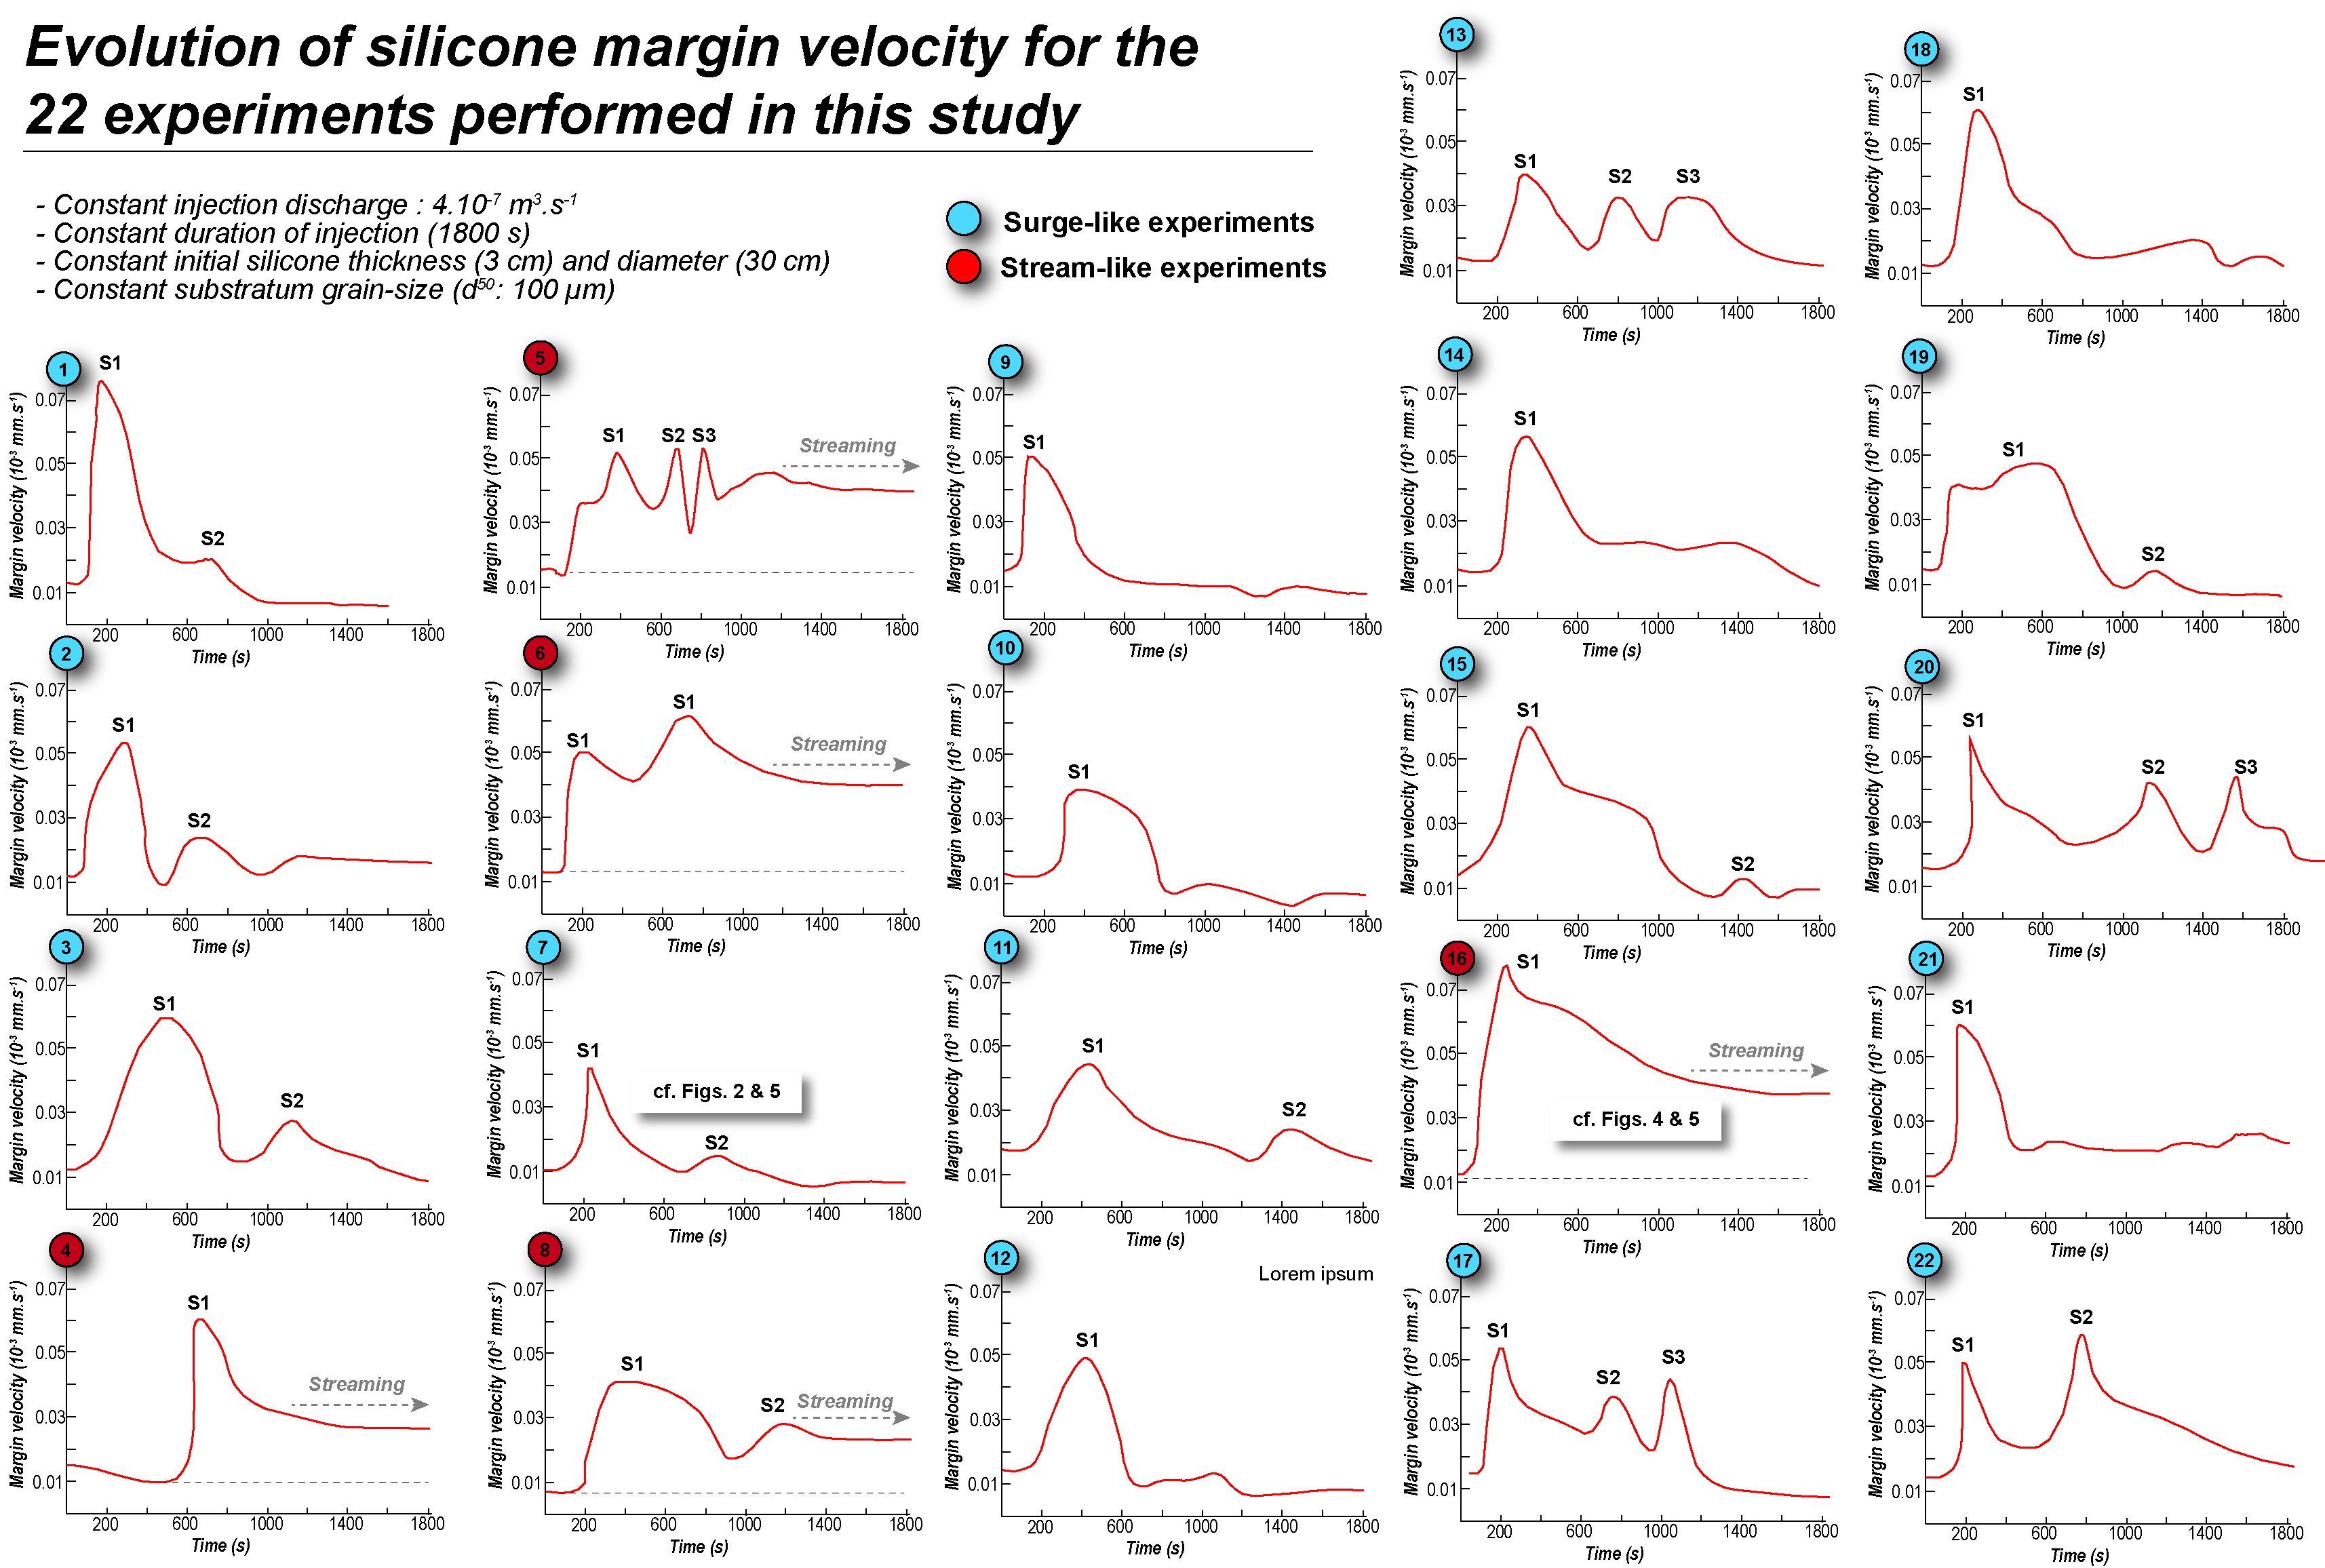
We performed 22 experiments with constant water discharge (4 × 10⁻⁷ m3 s−1) during 30 min. They produced two types of drainage landsystems and silicone flow regimes. The results of two typical experiments (no 7 and 16; Table S1), representative of these regimes, are shown in Figures 2 and 3. The results of the other experiments are compiled in (Table 1, Table S1 and Fig. S1).

Fig. 2. Typical evolution scenario for the first class of experiments (surge-like flow regime) illustrated with interpreted snapshots, surface velocity maps and surface shear strain rate maps. Stage I: silicone surge and development of shear margins coeval with the drainage of the initial water pocket. Stage II: silicone slowing during the channelization phase; formation of Tunnel Valleys (TV). Stage III: Second and minor surge, lateral migration of the fast-flowing silicone corridor and formation of a new tunnel valley. Stage IV: Silicone flow stabilisation to pre-injection velocity; shear margins vanish while tunnel valleys keep expanding.

Fig. 3. Evolution of the second experimental scenario (stream-like flow regime) described with interpreted snapshots, surface velocity maps and shear strain rate maps. Stage I: Sustained high silicone flow velocity (triggered during outburst flood, cf. stage I in Fig. 2) although channelization was initiated through formation of a tunnel valley. Minor channels form in parallel due to rapid cessation of the tunnel valley activity. Shear bands delineating the margin of a fast-flowing silicone corridor are observed. Stages II to IV: Tunnel valley is inactive, multiple generation of small water channels form, many of them being disconnected from the margin. The magnitude of silicone flow velocity and shear strain rates maintain at high levels throughout the experiment.
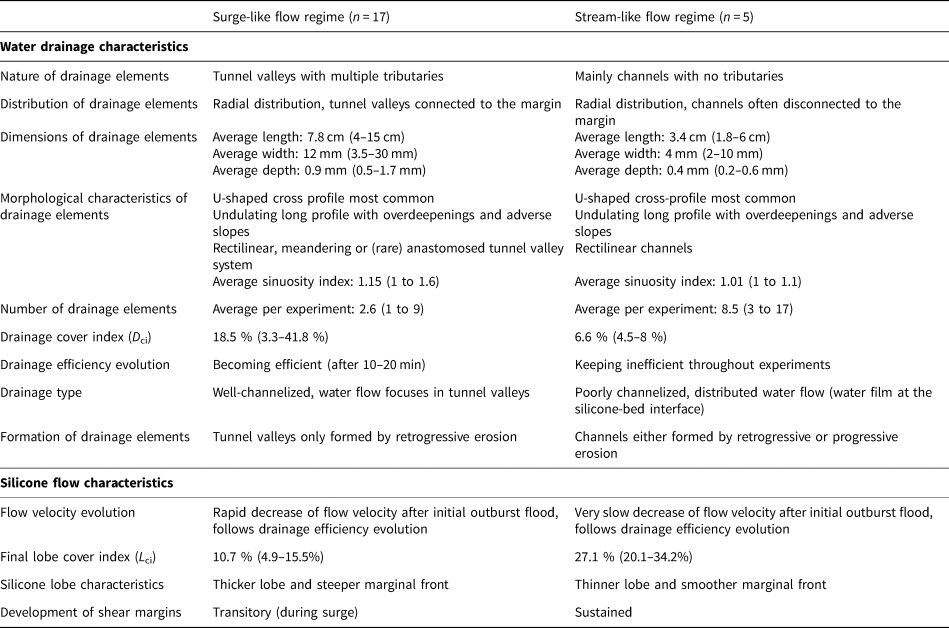
Table 1. Comparison of water drainage and silicone flow characteristics, respectively for surge-like and stream-like silicone flow regimes
2.1.2. Monitoring
Monitoring of the experiments is achieved by means of seven synchronised cameras to ensure the production of time series silicone flow velocity maps and Digitial Elevation Models (DEMs) (Fig. 1a). Photogrammetry is used to build DEMs of the silicone surface and silicone-bed interface (Lelandais and others, Reference Lelandais2016, Reference Lelandais2018). Morphological parameters (width, depth, length and sinuosity) are extracted for any single drainage element from these DEMs.
The displacement of punctual UV markers scattered at the silicone surface is monitored by a central camera, allowing the silicone flow velocity to be determined using particle image velocimetry techniques (Fig. 1a). The horizontal deformation of the silicone cap surface is quantified by measuring the magnitude of the horizontal shear strain rate (ε shear; Nye, Reference Nye1959). Those indicators are computed for each triangle of a mesh, established by a Delaunay triangulation of all the UV markers following methods developed by Vérité and others (Reference Vérité, Ravier, Bourgeois, Pochat, Lelandais, Mourgues and Atkinson2021). Simultaneous monitoring of subglacial drainage landforms, silicone flow velocity and silicone deformation allows connections between the subsilicone drainage system and silicone dynamics evolution to be analysed (Lelandais and others, Reference Lelandais2018).
We use the DEM time series to compute the maximal discharge capacity the drainage elements are able to accommodate in order to correlate water flow, morphological changes of the bed and silicone dynamics. We use the Poiseuille law Eqn (1), which connects the hydraulic radius (R h) of a drainage element, its length (L), the water viscosity (η) and the water pressure gradient (ΔP) through the drainage element to the maximal discharge (Qmax element) the element is able to drain when considered at bankfull state. The water pressure gradient is estimated by assuming a linear drop in pressure from the value measured upstream (pressure sensor) to the atmospheric pressure at the drainage element outlet. The hydraulic radius is taken as the ratio between the area (A) and perimeter (P) of the drainage element cross-sections.


By summing maximal discharge capacities of all observed drainage elements, we compute the maximal discharge capacity of the whole drainage landsystem (Qmaxsystem) Eqn (2). To monitor drainage efficiency through time, we compare Qmaxsystem to the effective water discharge flowing at the silicone-bed interface (Qint), which is approximately 25% of the measured water pump discharge (Lelandais, Reference Lelandais2018). If Qmaxsystem < Qint we consider the drainage system as inefficient, while if Qmaxsystem ⩾ Qint we consider the drainage system as efficient. Qmaxsystem might be overestimated since we are not able to take into account the silicone creep that possibly decreases the hydraulic radius of drainage elements.
We define the drainage cover index (Dci) Eqn (3) as the ratio between the area covered by the drainage network and the area covered by the silicone lobe. The lobe area is delimited laterally from the rest of the silicone cap by inflection points at the margins of the protruding lobe (Fig. 1c). Dci is an adaptation of the drainage density classically used to describe watersheds, landscape dissection, run-off potential and drainage efficiency in subaerial water drainage systems (Yang and others, Reference Yang, Smith, Andrews, Fettweis and Li2022).

Finally, to compare the extent of silicone lobes between various experiments, we compute the lobe cover index (L ci) Eqn (4) as the ratio between the area covered by the silicone lobe and the total area of the silicone cap.

2.1.3. Scaling
Considering that this model uses water and silicone for simulating meltwater and ice respectively, the rules of a classical scaling in which the model is a perfect miniaturisation of nature are not practical (Paola and others, Reference Paola, Straub, Mohrig and Reinhardt2009). The use of silicone putty also induces a major scaling limitation since the viscosity ratios between the cap materials, either ice or silicone putty, the basal fluid, water in both cases, are different. For these reasons, Lelandais and others (Reference Lelandais2016) based the scaling of this model on the displacement of the natural ice and experimental silicone margins through time. They used a unit-free speed ratio between the silicone and ice velocity measured at the margin and the incision rate of experimental and natural tunnel valleys. In this way, the complexity of the relations among subglacial hydrology, subglacial erosion and ice flow, which is one of the main issues in numerical modelling, is included in the velocity values. The scaling attests that the value of the ratio between margin velocity and incision rate of tunnel valleys in the experiment falls within the field validity defined by the range of natural settings.
2.1.4. Model limitations
The model is designed to explore the basic mechanical interactions between a simplified water-routing system, a deformable, permeable and erodible sedimentary bed and an impermeable viscous cover. The model simulates the dynamic of terrestrial-based outlet glaciers; the impossibility to produce fracture (no crevasses, no calving processes) in the range of experimental flow velocities reproduced and the lack of a floating marginal silicone shelf limits comparisons between experimental results and the dynamic of marine-based outlets. However, up the calving shelf, the subglacial hydrology response to surface melting and the implications for oscillations of ice flow velocities can be (cautiously) discussed in the light of experimental results. The formation of drainage landforms in the experiments involves interactions between the silicone putty, the injected water and the sand bed. The silicone putty is Newtonian, isotropic and impermeable. Under the experimental conditions (between 15–20°C and at atmospheric pressure), its viscosity is nearly independent on temperature and the bed keeps constantly wet and saturated. Consequently, temperature-dependent processes (shear heating, heat softening, melting and freezing) and shear softening/hardening related to the nonNewtonian behaviour or the anisotropy of ice are not reproducible. This implies that subglacial conduits (R-channels) and cavities thermally eroded up into the ice base cannot be reproduced: indeed the model only reproduces conduits cut into a sedimentary bed (e.g. N-channels) precluding the difference between R-channels, N-channels and linked-cavity system in the modulation of drainage efficiency and ice flow velocity to be investigated. Considering that R- and N-channels can both efficiently drain water at the ice-bed interface, we assume that the influence of experimental channels and tunnel valleys (N-channels) on drainage efficiency and ice flow dynamics can be discussed in the lights of present-day monitoring and modelling of subglacial hydrological system even though drainage elements might often be conceptualised as R-channels. The Newtonian silicone putty is unable to localise viscous deformation when stress increases implying an overestimation of the width of experimental lateral shear margins (Vérité and others, Reference Vérité, Ravier, Bourgeois, Pochat, Lelandais, Mourgues and Atkinson2021). For the same reason, we also expect smaller spatial velocity gradients in the experiment than in nature. Internal production of meltwater, complex spatial variations in subglacial hydrology, and lobe margin ablation and retreat are not reproducible either. Finally, the deformable, erodible and permeable sand substratum we use for modelling the subglacial might limit the result's applicability to soft subglacial bed substratum and permeable and erodible bedrock, thus limiting comparisons and interpretations made of meltwater landform assemblages observed on crystalline bedrocks.
2.2. Progress of experiments
2.2.1. Onset of fast silicone flow (stage I)
In all experiments, as long as no water is injected, the silicone cap is coupled to the bed and spreads under its own weight at a velocity of 0.008 mm s−1 at the margin (Fig. 2). The silicone cap displays the typical parabolic surface profile of an ice sheet; it increases in diameter and decreases in thickness with time, thus producing a radial pattern of horizontal velocities.
When water injection starts, all experiments behave similarly: injection of water within the bed triggers the formation of a water pocket at the silicone-bed interface and leads to silicone-bed decoupling. After a few minutes, the water pocket migrates outwards and drains suddenly through a distributed water film that feeds an outburst flood at the margin of the silicone cap. In all experiments, the migration of the water pocket is coeval with the formation of a corridor of fast silicone flow velocity (from 0.07 to 0.09 mm s−1) referred to as an experimental ice stream in previous studies (Lelandais and others, Reference Lelandais2016, Reference Lelandais2018; Vérité and others, Reference Vérité, Ravier, Bourgeois, Pochat, Lelandais, Mourgues and Atkinson2021) (stage I; Fig. 2). During the flood, two shear bands characterised by high shear strain rates form on either side of the corridor of water migration (Fig. 2).
Depending on the subsequent evolution of the subsilicone drainage type and efficiency, two different silicone flow velocity regimes appear later in the experiments: (1) surge-like flow regime (n = 17 experiments), characterised by transitory silicone speed-ups and (2) stream-like flow regime (n = 5 experiments), characterised by sustained high silicone flow velocities following one or several transitory silicone speed-up events (i.e. surges) (Fig. S1).
2.2.2. Surge-like flow regime (stages II to IV)
In the first class of experiments (Table 1), the distributed system associated with drainage of the initial water pocket collapses into a channelized system comprised of 1 or 2 drainage elements fed by tributaries at their heads and connected with the silicone margin (Fig. 2). These initiate below the margin of the silicone cap and gradually expand upstream, by retrogressive erosion of the bed (Stage II; Fig. 2). For the experiment shown in Figure 2, the drainage features are respectively 30 and 80 mm long, 12 and 10 mm wide and 0.5 mm deep. For this type of experiments, the drainage features have constant widths along their paths, undulating long profiles, low sinuosity (1.15 sinuosity index) and a radial distribution (Table 1; Fig. 4a).

Fig. 4. Snapshots of drainage features reproduced experimentally during surge-like and stream-like flow experiments. (a) Slightly sinuous tunnel valleys with tributaries connected to a silicone lobe margin typical of the surge-like flow regime scenario. (b) Multiple rectilinear channels of smaller dimensions often disconnected from margin and associated with protruding silicone lobe emerging from silicone stream. Note that the tunnel valley in panel B is becoming quickly inactive while channels keep forming.
After the initial surge in flow velocity above the draining water pocket, the fast silicone corridor slows down (flow velocity drops to a quarter of the surge speed) and narrows in response to drainage channelization (Stage II; Fig. 2). The deceleration of silicone is associated with a decrease in shear strain rates along corridor's lateral margins. A new transient water pocket grows below the silicone cap, migrates and drains next to the existent valley system to form a new outburst flood (Stage III; Fig. 2). This new drainage pathway induces a reacceleration of the silicone flow (15% speedup, sometimes more) and shear bands strengthening. A possible relocation of the corridor of faster flowing silicone is possible if the transient water pocket drains laterally to the existent channelized system. The new outburst flood is generally associated with the initiation of a 2nd generation of drainage features in a hitherto slow-moving region of the silicone cap (Stage III; Fig. 2).
The expansion (by retrogressive erosion and deepening) of existing drainage elements and associated marginal fans continues until the end of the experiment (Stage IV; Fig. 2). After 1800 s, the average drainage cover index (Dci) is 18.5 (3.3–41.8%). Experiments of this kind display 2.6 drainage elements on average (1 to 9) and their final dimensions are 78 mm long, 12 mm wide and 0.9 mm deep on average (Table 1). Following expansion of drainage features, the flow velocity quickly decreases, lateral shear bands vanish and the silicone cap gradually recovers a radial flow pattern similar to the pre-injection phase (Stage IV; Fig. 2). Focused silicone flow along a corridor overlying the water drainage route is associated with the formation of reduced silicone lobes displaying an averaged lobe cover index (L ci) of 10.7% (4.9–15.5%) (Table 1; Fig. 4a). Thick and steep lobe margins predominate throughout surge-like flow regime experiments.
2.2.3. Stream-like flow regime (stages II to IV)
In the second class of experiments, distributed drainage of the initial water pocket is followed by channelization and formation of a drainage element (Fig. 3). For the experiment shown in Figure 3, this element expands upstream from the margin by retrogressive erosion (upstream) to reach its maximal size (12.5 cm long, 11 mm wide and 1.2 mm deep) at about 600 s (stage I). Both the drainage element and its associated marginal fan show no sign of further expansion after 600 s. After 650 s, a new generation of drainage elements appears, composed of several small (10–60 mm long, 2–6 mm wide, 0.2–0.6 mm deep) rectilinear segments often disconnected from the silicone margin, devoid of tributaries and growing mostly by progressive (downstream) erosion (stages I and II; Fig. 3). This generation is followed by others that contribute to form up to 15 distinct and disconnected drainage elements arranged in a radial pattern below the silicone lobe (stages III and IV; Fig. 3). Their dimensions are on average twice to thrice smaller than those of drainage elements observed in the surge-like class of experiments (Table 1; Fig. 4b).
After 30 min, the Dci for stream-like experiments is 6.6% (4.5–8%) and the average number of single drainage elements is 8.5 (3–17). The velocity of the silicone margin gradually decreases during the experiment (from 0.09 to 0.04 mm s−1) but stabilises at about 0.04 mm s−1 from 1700 s to the end (Fig. 3). Once the water pocket has drained, a corridor of fast silicone flow bordered by two lateral bands of high shear strain rates is maintained throughout the experiment. Following the trend of silicone flow velocity, surface shear strain rates slowly decrease before stabilising at the end of experiments. Focused fast silicone flow is associated with the formation of protruding lobes characterised by an average L ci of 27.1% (20.1–34.2%) (Table 1; Fig. 4b). Thinner lobes with smoother margins are observed at the end of stream-like flow regime experiments compared to the surge-like flow regime experiments.
2.3. Response of silicone flow dynamics to changes in drainage efficiency
2.3.1. Surge-like flow regime
After the first six minutes following the channelization of water flow, the maximal discharge capacity (Qmaxsystem) of the drainage network in the first class of experiments (Figs 2 and 5a) has reached a third (0.3 × 10⁻⁶ m3 s−1) of the effective water discharge at the silicone-bed interface (Qint). Qmaxsystem has thus increased after the initial outburst flood, by initiation and expansion of two drainage elements. This increase in discharge capacity contributes to quickly decrease (from 8 to 2 mm s−1 in 200 s) the silicone flow velocity that almost reduces to pre-surge values, although the drainage remains inefficient (Qmaxsystem < Qint). From 800 to 1000 s, the transitory migration and drainage of a secondary water pocket triggers a second and minor surge in silicone flow velocity (Fig. 5a). This second surging event starts receding after 150 s with the growth of a new drainage element further increasing the maximal discharge capacity of the whole drainage network. On both sides of the surging corridor, transient shear margins develop during the two silicone speed-up phases and quickly fade when the silicone decelerates. Considering that all drainage elements are actively draining water, we estimate that Qmaxsystem > Qint after 1100 s (Fig. 5a). From this point, the drainage becomes and remains efficient throughout the rest of the experiment, due to continuous expansion of the drainage network. After 1800 s, the value of Qmaxsystem is almost twice that of Qint. In response to this increasing drainage efficiency, the silicone flow velocity keeps decreasing and the two bands of high shear strain rates vanish almost completely. Efficient drainage and decrease of flow velocity imply that all water drained at the interface is flowing in the channelized drainage system and that friction related to silicone-bed coupling occurs outside the drainage system. A quiescent phase (in between surges) is reached at the end of the experiment when the silicone flow velocity recovers pre-injection flow velocity (Figs 2 and 5a).

Fig. 5. Monitoring of the evolution of margin velocity (in the axis of the faster flowing zone), drainage capacity of the active valley network (Qmaxsystem), silicone lobe cover index (L ci), flow velocity and silicone shear strain rate maps respectively for surge-like (a) and stream-like (b) flow regime experiments.
2.3.2. Stream-like flow regime
After the initial outburst flood, channelization can lead to the development of one single drainage element that increases in size to reach a Qmaxsystem of 0.6 × 10⁻⁷ m3 s−1, approximately half the value of Qint (Figs 3 and 5b). This increase in maximal drainage capacity is coeval with a 10% deceleration of the silicone flow. When the drainage element ceases to grow and the water is re-routed toward smaller drainage elements, Qmaxsystem first falls, then increases gradually as new drainage elements form. After 20 min, Qmaxsystem has tripled (from 0.2 to 0.6 × 10⁻⁷ m3 s−1) but remains lower than Qint, implying that inefficient drainage persists throughout the experiment. This implies that part of water flowing at the interface either accumulates upstream or flows outside the channelized system as a thin and distributed water film that help maintaining high silicone flow velocities through lubrication of the ice-bed interface. During the development of the drainage network, the silicone flow velocity decreases with respect to the peak velocity observed during the outburst, but remains more than three times higher than before the outburst, thus maintaining the shear bands (Fig. 5b).
2.4. Ice surge vs ice stream: controlled by the evolution of drainage efficiency
2.4.1. Transitory fast ice flow and efficient drainage: surge-like flow regime
The surge-like regime observed in most experiments (Figs 2 and 5a; Table 1) is characterised by transient and repeated (1 to 3) episodes of silicone speed-up and rapid reorganisation of the hydrological system induced by focused erosion along water passageways that increase the maximum drainage capacity (Qmaxsystem). This rapid change of drainage capacity, by increasing the amount of water that can flow within drainage passageways, controls the evolution of drainage efficiency and modulates the surging character of the flow.
In the first stages of these experiments, water ponding followed by development of a water film (e.g. distributed drainage) during burst (e.g. outburst flood) and drainage of the water pond demonstrate initial drainage inefficiency. Drainage inefficiency is associated with silicone flow speed-up, incipient lobation of the margin and development of shear margins on both sides of the fast-flowing silicone corridor (Figs 2 and 5a). Formation and migration of subglacial water bodies have been mapped or inferred beneath modern and former ice sheets (Fricker and others, Reference Fricker, Scambos, Bindschadler and Padman2007; Livingstone and others, Reference Livingstone2022) and associated with transitory (days to months) ice flow speed up events (Magnússon and others, Reference Magnússon, Rott, Björnsson and Pálsson2007; Livingstone and others, Reference Livingstone2019). Cascading lake drainage events in Antarctica have led to multiple years of ice flow enhancement with no subsequent slowdown to below the pre-drainage event ice velocity (Bell and others, Reference Bell, Studinger, Shuman, Fahnestock and Joughin2007; Siegfried and others, Reference Siegfried, Fricker, Carter and Tulaczyk2016). In our experiments, once flooding ceases, the hydrological system reorganises, the distributed drainage collapses into large and fast expanding drainage passageways developing through retrogressive erosion we interpret to be the experimental analogues of tunnel valleys considering their morphological similarities (U-shaped cross-sectional profiles, undulating long profiles, constant widths) (Lelandais and others, Reference Lelandais2016). Experimental tunnel valleys are initiated during the outburst but keep developing trough the experiments as they remain continuously fed by water. Lengths, widths and depths of single tunnel valleys are in average two to three times bigger than water passageways observed in streaming experiments. The drainage network is characterised by a smaller number of drainage elements on average (2.6 vs 8.5 for streaming) but a higher D ci (18.5 vs 6.6% for streaming experiments) related to wider and longer drainage elements, suggesting that the degree of channelization controls the evolution of silicone flow velocity. As the drainage efficiency increases, the ice flow quickly decelerates (in 2–3 min) and the shear margins dissipate. Although time is not scaled in the experiments we suggest, by comparison with the stream-like flow experiments, that the flow speed-up period is short enough to be comparable to the dynamic of glacier surges (Dowdeswell and others, Reference Dowdeswell, Hamilton and Hagen1991). The transitory nature of the flood and associated speed-up event is comparable to glacier surges where the increase of flow velocity is limited in time (from weeks to years) and generally bounded by quiescent phases where ice flow velocity is much slower. The basic definition of a surge-type glacier includes that major fluctuations in velocities are quasi-periodical and not restricted to a single speed-up event (Meier and Post, Reference Meier and Post1969; Striberger and others, Reference Striberger2011). In our experiments, other surging episodes (Figs 5a and S1), related to the release of successive water pockets strengthens the surge-like behaviour of the silicone experiments by showing multiple speed-up events of different magnitudes interspersed with quiescent phases characterised by much slower silicone flow. Using Dye tracing, Cowton and others (Reference Cowton2013) have observed similar episodic speed-up events in Greenland when channels are regularly overwhelmed by the transient release of meltwater (from either supraglacial or subglacial sources) although the timescale (days to weeks) and drainage elements (R-channels) differ from our experimental findings.
The speed-up events of natural glaciers are generally compensated by a subsequent slowdown observed at daily (Shepherd and others, Reference Shepherd2009), seasonal (Sole and others, Reference Sole2011) to multi-seasonal (Sund and others, Reference Sund, Lauknes and Eiken2014; Sevestre and others, Reference Sevestre2018) timescales. Slowdown might even be abrupt for surging events (weeks to months) due to step changes in drainage efficiency, either via a high-storage distributed system or a switch to an efficient channelized system (Kamb and others, Reference Kamb1985; Kamb, Reference Kamb1987; Benn and others, Reference Benn, Fowler, Hewitt and Sevestre2019). However, we observe that the end of the experimental surge event in our experiments is often not so abrupt but rather gradual as Qmaxsystem gradually increases while the tunnel valley system keeps expanding (Figs 2 and 5a). Some natural surges have indeed shown gradual slowdowns (typical of polythermal glaciers in Svalbard) spreading over multiple seasons (e.g. Murray and others, Reference Murray, Strozzi, Luckman, Jiskoot and Christakos2003; Sund and others, Reference Sund, Lauknes and Eiken2014; Benn and others, Reference Benn, Fowler, Hewitt and Sevestre2019) although not necessarily related to hydraulic switching between inefficient and efficient drainage.
The increase of Qmaxsystem through experiments might be overestimated as we measure the volume of drainage conduits considering they are filled by water at a bankfull stage. We alternatively hypothesise that the ongoing vertical erosion in tunnel valleys is balanced by the silicone creeping inside the valleys once efficiency is reached and water pressure balanced, leading to stable maximum drainage capacity. The achievement of drainage efficiency is however responsible for a gradual decrease of basal water pressure and flow velocity until stagnation of the overlying silicone cap and recovering of a radial flow pattern. Between 1985 and 1994 and 2007 and 2014, Tedstone and others (Reference Tedstone2013, Reference Tedstone2015) observed a 12% decrease in mean annual ice velocity across a land-terminating area of the Greenland ice sheet at the same time as melt rates increased by ~50%. They argued that the decrease in velocity is likely the result of the seasonal formation of a more extensive channelized system (conceptualised as R-channels) extending further into the ice sheet and acting as low pressure arteries for meltwater drainage. A Relatively stable channelized system carved into the sedimentary bed (N-channels) was suggested to promote sustained efficiency of subglacial drainage from beneath the British Ice Sheet, potentially slowing or even arresting the advance of the ice sheet in eastern England during the Middle Pleistocene (Phillips and others, Reference Phillips and Lee2013).
2.4.2. Sustained fast ice flow and drainage inefficiency: the stream-like flow regime
The stream-like regime observed in some experiments (Figs 3 and 5b; Table 1) is characterised by sustained high-silicone flow velocity along corridors. The water delivered to the bed is not counterbalanced by sufficient maximal drainage capacity (Qmaxsystem) leading to an increase of basal water pressure, distributed drainage and higher sliding rates.
Following initial outburst floods, one to three silicone surges are recorded in the experiments because the drainage system is repeatedly unable to evacuate the pulsed water input from upstream water bodies (Figs 5b and S1). The drainage system is inefficient, the water drainage is distributed, basal lubrication enhances the silicone flow velocity and shear bands emerge. Channelization occurs after floods dissipation with the development of tunnel valleys (Fig. 3). The fast expansion of tunnel valleys suddenly stops due to water re-routing and tunnel valleys abandonment while multiple rectilinear and smaller channelized drainage elements disconnected from the margin start emerging. Based on the morphometric differences, we cannot consider this second type of drainage elements as experimental tunnel valleys and we therefore name them channels. We mainly distinguish tunnel valleys from channels from their dimensions, the occurrence of tributaries and their connectivity to the silicone margin. Another difference is the fact that tunnel valleys are created by the activity of narrow channels which occupy part of them, as river channels occupy parts of valleys. As suggested for some of their natural counterparts (Greenwood and others, Reference Greenwood, Clark and Hughes2007; Kehew and others, Reference Kehew, Piotrowski and Jørgensen2012; Livingstone and others, Reference Livingstone2016) channel dimensions are at least half those of tunnel valleys (Table 1). Their smaller dimensions and their inner positions (i.e. disconnected from the margins) confer a lower drainage efficiency to the hydrological network despite the development of new channels. Due to their overall drainage inefficiency, these channels could be compared to sedimentary canals which are described as shallow subglacial channels of intermediate efficiency incised into the sedimentary bed (Walder and Fowler, Reference Walder and Fowler1994; Ng, Reference Ng2000). However, canal-type drainage is often conceptualised as a braided distributed network composed of shallow but wide drainage features, thus limiting the comparison with the rectilinear, disconnected and narrow channels reproduced experimentally. The inefficiency persists throughout the experiment although Qmaxsystem increases to reach half Qint. This initiates a small and very gradual decrease in silicone flow velocity because the drainage inefficiency helps maintaining high sliding rates for a longer timespan (Fig. 5b). Compared to the surge-like experimental scenario and referring to previous studies using a similar experimental set up (Lelandais and others, Reference Lelandais2018; Vérité and others, Reference Vérité, Ravier, Bourgeois, Pochat, Lelandais, Mourgues and Atkinson2021), we interpret the silicone flow regime as the experimental counterpart of an ice stream. Generally, ice streaming is used to describe a sustained period of fast-flow (decades to millennia), whereas surge-type glaciers exhibit a cycle of fast-flow (typically years), followed by a quiescent phase that is of much longer duration (typically decades; Raymond, Reference Raymond1987). The stream-like regime, characterised by stabilised high silicone flow velocities, arises from one to several phases of surge-like flow regime at the beginning of our experiments. This switch in the type of fast-flow regime correlates with the inability of the drainage landsystem to achieve drainage efficiency. Zheng and others (Reference Zheng, Pritchard, Willis and Stearns2019) have for the first time observed the birth of an ice stream on Vavilov Ice Cap after recording a surge-like behaviour for several years (Zheng and others, Reference Zheng, Pritchard, Willis and Stearns2019). Indeed, after the initial surge in 2013, the outlet glacier of Vavilov ice cap maintained fast-flow at ~1800 m year−1 for 6 years, an unusually long-lasting speed-up for a glacier, suggesting the outlet entered a phase of stream-like flow regime, thus recording a switch in fast-flow regime. Unlike our findings, Zheng and others (Reference Zheng, Pritchard, Willis and Stearns2019) suggested that the switch from surge- to stream-like regime could be related to reduction of basal drag when glacier advanced on to weak marine sediments and/or triggered by multiple summer speed-ups correlating with warmer summers and subsequent increase of meltwater supply. Incipient ice streams are associated with the propagation of shear margins representing one of their most distinctive properties. Indeed, ice streams are conditioned by the development of sharply delineated shear margins bounding the transition between slow- and fast-moving ice (Raymond, Reference Raymond1996; Raymond and others, Reference Raymond, Echelmeyer, Whillans and Doake2001; Schoof, Reference Schoof2004). We show that the sustained silicone flow velocity in our experiments is associated with persistent shear margins through calculation of shear strain rates at the silicone surface (Fig. 3). We assume that the sustained and focused silicone flow velocity, combined with the development of shear margins strengthen the comparison with natural ice streams (Bennett, Reference Bennett2003). The sustained delivery of fast-flowing silicone to the margin leads to the formation of an extensive lobe stretching far beyond the silicone cap margin (L ci > 20%), analogous to the parallel with the well-developed southern Laurentide ice lobes argued to be the outlets of Pleistocene terrestrial ice streams (Patterson, Reference Patterson1997).
Although the streaming mechanism is initiated by outburst flooding, the sustained high sliding velocities regime is later controlled only by the inefficiency of the drainage system to accommodate constant water input. Hogan and others (Reference Hogan2022) suggest that periodical water release from subglacial lakes beneath ice streams, every few tens to hundreds years, might only temporarily affect ice flow velocities for periods of weeks to months and cannot be considered as a mechanism responsible for long-term streaming. Our modelling results rather suggest that long-lived ice streaming is possibly related to the inability of the drainage landsystem to accommodate a long-term and sustained meltwater production.
2.5. Controls on fast-flow regimes
Thermo-mechanical instabilities resulting from feedbacks between ice flow, water flow and bed deformation have been suggested to control glacial streaming and surging (Fowler and Johnson, Reference Fowler and Johnson1996; Payne and Dongelmans, Reference Payne and Dongelmans1997; Hindmarsh, Reference Hindmarsh2009; Kyrke-Smith and others, Reference Kyrke-Smith, Katz and Fowler2014; Lelandais and others, Reference Lelandais2018; Benn and others, Reference Benn, Fowler, Hewitt and Sevestre2019). By analogy, although thermal processes are not simulated in our experiments, the observed stream-like and surge-like regimes may be understood as physical instabilities resulting from mechanical feedbacks between silicone flow, water flow, bed deformation and development of drainage landforms at the silicone-bed interface. The instability tends to disappear and reappear spontaneously, cyclically and rapidly in the surge-like regime, while it persists over longer timescales in the stream-like regime. This difference is controlled by differences in the development of the subglacial water drainage landsystem. Parameters that may control the development of the drainage landsystem include the water injection scenario, the geometrical and rheological characteristics of the silicone cap and the geometrical, rheological and hydrological characteristics of the bed.
We performed our 22 experiments with constant parameters (Table S1 and Fig. S1): we thus hypothesise that the kind of instability that controls the formation of drainage system and the silicone flow regime in the experiments is mostly sensitive to small unmeasurable parameters: these may include lateral variations in bed slope, roughness, topography, compacity or permeability or variations in the initial geometry (thickness, margin shape, location of water injector) of the silicone cap. If these conclusions may be extrapolated to natural glaciers, this suggests that the subglacial hydrology and flow regime of terrestrial ice lobes resting on flat beds might be so sensitive to small perturbations, that it may be unpredictable and might even switch erratically.
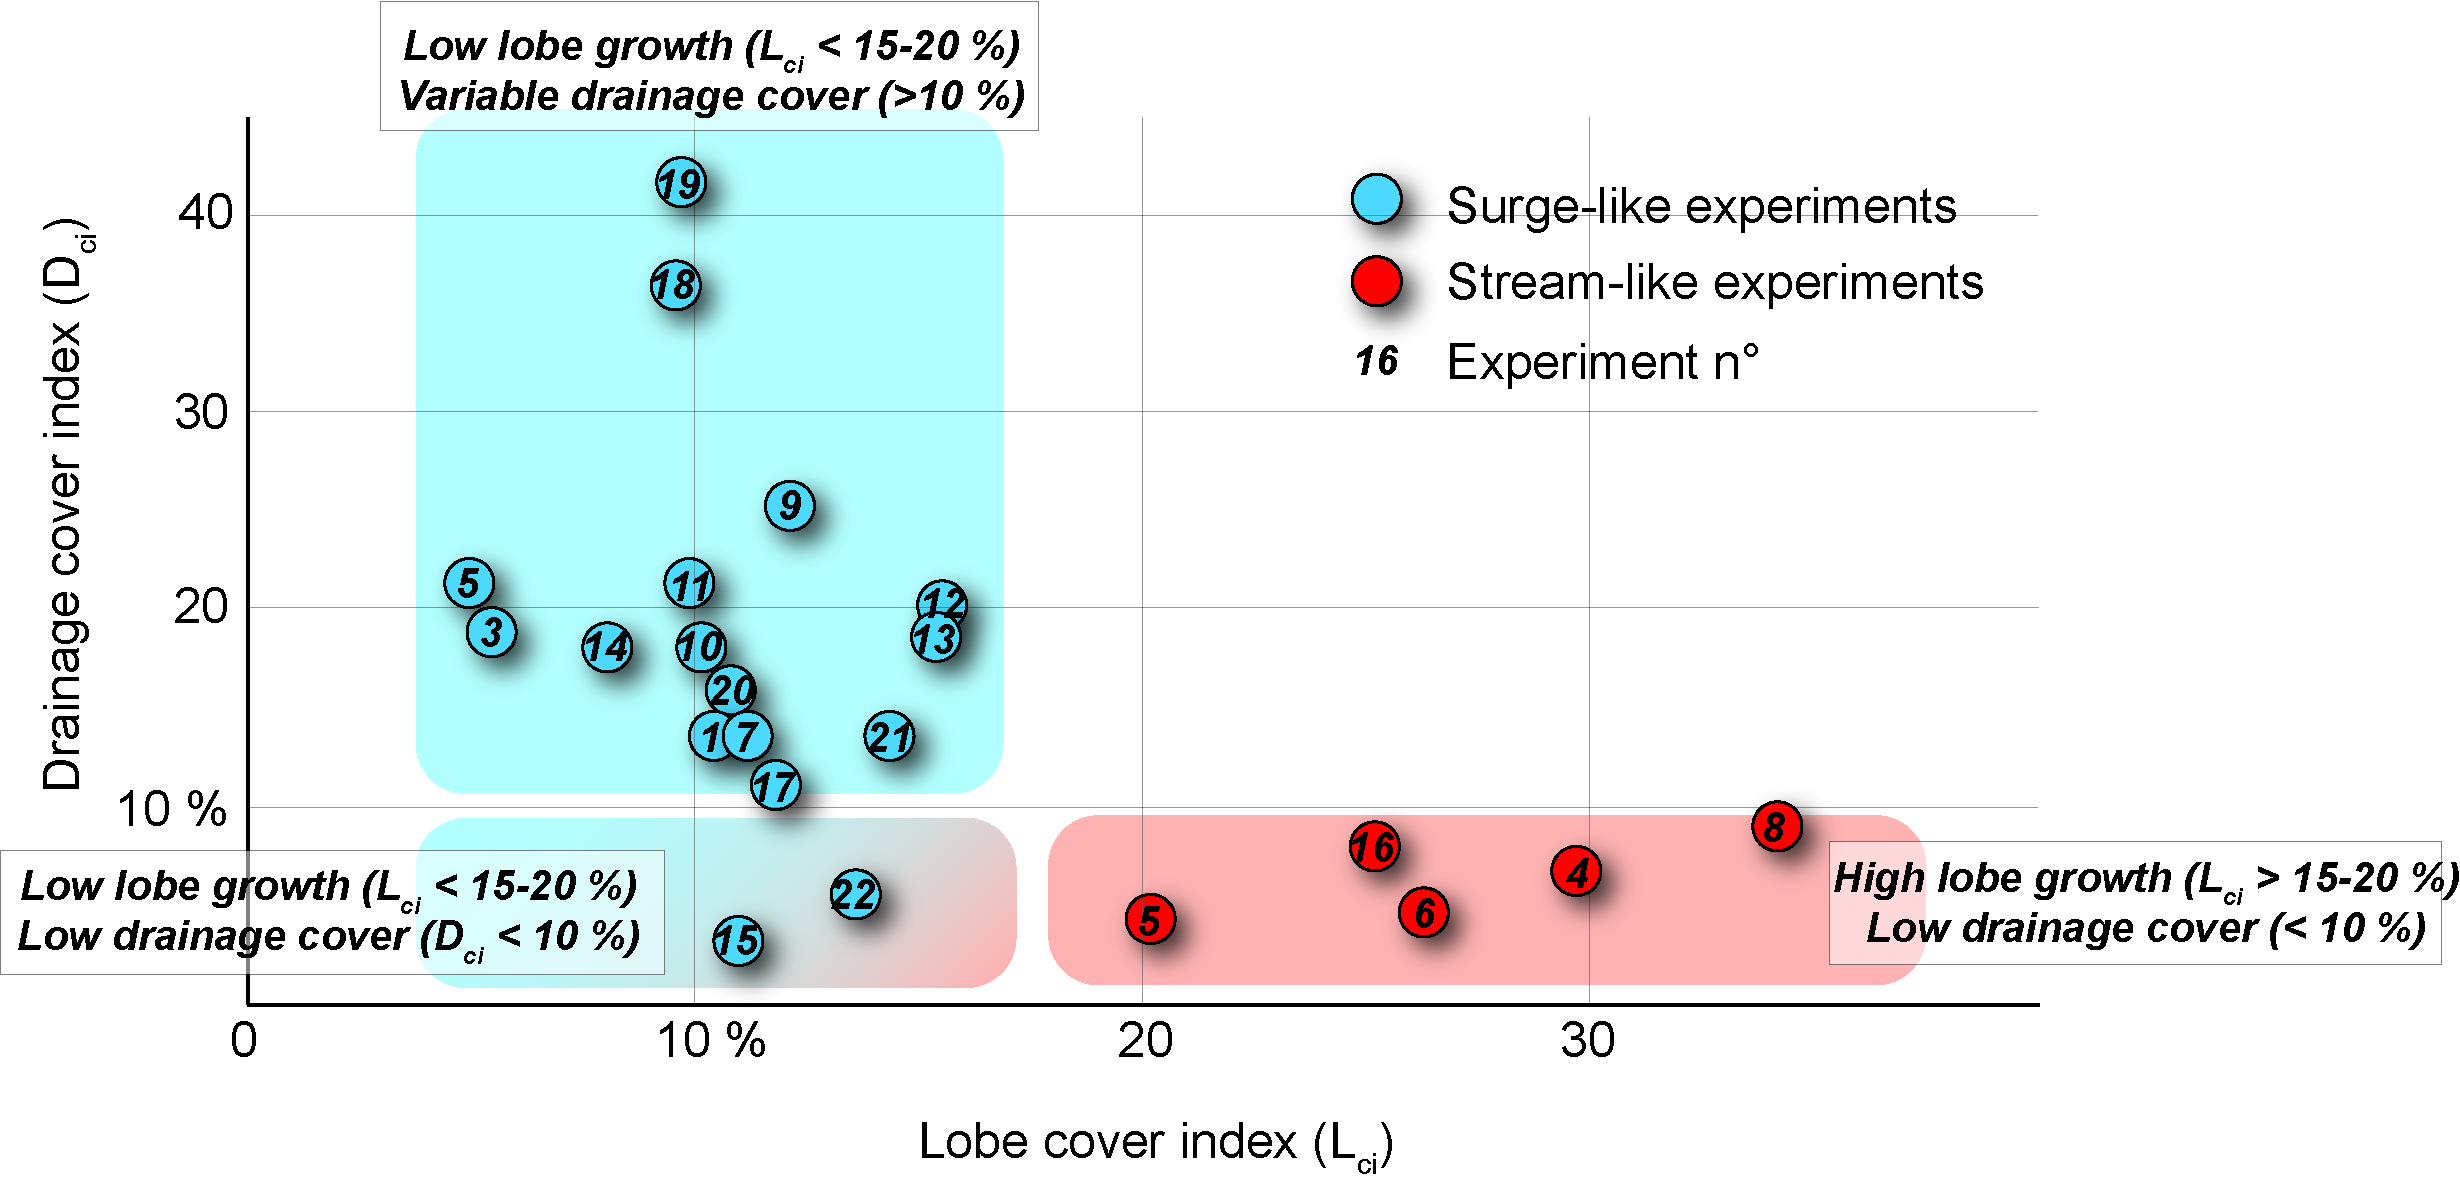
When plotting the drainage and silicone cover for all experiments in a single diagram (Fig. S2), we can distinguish three groups of experiments based on the definition of visible L ci and D ci thresholds. The first group, characterised by low L ci (<15–20%) and a wide range of D ci values (from 10% to over 40%) encompasses most of the surge-like experiments (15 out of 17). This group suggests that the transitory nature of silicone flow speed-up, although characterised by high-amplitude velocity peaks, leads to an overall lower silicone lobe cover. It also suggests that surging-flow regime might occur over a wide range of drainage cover indices, implying that other parameters might control the surging behaviour of the silicone flow. Among these parameters, we notice variable amount (1 to 3) and duration of outburst floods and surging episodes (Fig. S1) and the number (1 to 9) and dimensions of tunnel valleys formed during the experiments. A second group, displaying a lower D ci (<10%) and a higher L ci (>15–20%), gathers all stream-like experiments. They exhibit a clear drainage control on silicone flow and suggest that drainage cover is the primary driver for experimental stream-like flow regime. An intermediate group, composed of two experiments with low D ci (<10%) and L ci (<15–20%), lies in between the typical stream- and surge-like flow regime groups. Both experiments share characteristics of either surging-and streaming experiments. Indeed, a pronounced asymmetry of the velocity peak attributed to surging indicates a slower return to pre-surge velocities once flooding has ceased (Fig. S1; experiments 15 and 22). This longer return to flow quiescence, probably related to the transitory inefficiency of the drainage system (D ci < 10%), could be conceptualised as an aborted ice stream; i.e. an incipient ice stream that could not maintain high and constant flow velocities over prolonged periods of time.
The variability of drainage characteristics in surge-like experiments and the existence of an intermediate group of experiments bridging the gap between surge- and stream-like flow regime suggest that surging and streaming may be understood as endmembers in a variety of possible fast-flow behaviours. A spectrum in the duration of ice flow speed-up events, arising from variable interactions between the subglacial drainage system and the ice flow dynamics is consistent with the diversity of experimental results.
3. Palaeoglaciology
We selected two neighbouring palaeo-ice lobe landsystems beneath the Laurentide Ice Sheet for their differences in dimensions, drainage network and overall landform signature to compare with our experimental results. This palaeoglaciological approach will contribute to conceptualise relations between subglacial hydrology, ice flow regimes and landform signature based on their visible similarities with experimental results.
3.1. Study area
During the Late Wisconsinan glaciation, the Laurentide Ice Sheet (LIS) covered Canada entirely and reached its maximum extent ~21 cal. ka BP (Dyke and others, Reference Dyke, Moore and Robertson2003; Margold and others, Reference Margold, Stokes and Clark2015) (Fig. 6a). Palaeoglaciological reconstructions revealed a relatively stable ice margin of the LIS in north-west mainland Canada until ~16.2 cal. ka BP (Margold and others, Reference Margold, Stokes and Clark2018). Following this stagnation phase, an ice-free corridor progressively formed along the eastern foot of the Cordilleran Ice Sheet ~14.25 cal. ka BP, after which LIS rapidly retreated eastward until western Canada became ice free ~11.5 cal. ka BP (Dyke and others, Reference Dyke, Moore and Robertson2003). Numerous climate-sensitive ice stream and lobe systems spreading westward thus developed over the Interior Plains, associated with major proglacial lakes (Lemmen and others, Reference Lemmen, Duk-Rodkin and Bednarski1994; Dyke, Reference Dyke2004).

Fig. 6. Geographical and palaeoglaciological context of the study area. (a) Location of the study area in the frame of the Laurentide ice sheet extent during the Last Glacial Maximum and palaeo-ice stream tracks and main flow directions (modified from Margold and others, Reference Margold, Stokes and Clark2018). (b) DEM of the former Great Slave Lake Ice Stream (Arctic DEM, Porter and others, Reference Porter2018) with black rectangles referring to the two palaeo-ice lobes that have been analysed in detail. Dashed curved lines correspond to former lobe position reconstructed from large end moraine complexes.
The study area is located along the palaeo-Great Slave Lake Ice Stream (GSLIS) between the Horn Plateau and Cameron hills (Fig. 6b), where several flow sets of lineations illustrate multiple ice flow directions, probably contemporaneous to the ice-streaming phase of the GSLIS. The timing of operation of this ice stream has been calibrated by 14C dating and is thought to span between 13.5 and 10.8 cal. ka BP although the exact timing of operation is very uncertain because the whole region has extremely bad data coverage (Dyke and others, Reference Dyke, Moore and Robertson2003; Margold and others, Reference Margold, Stokes and Clark2018). Moraine complexes associated with drainage features (meltwater channels and tunnel valleys) reveal former lobe positions (Brown and others, Reference Brown, Stokes and O'Cofaigh2011), possibly representing the position of GSLIS outlets during deglaciation. We focus on two ice lobes we refer to as the Liard Moraine Ice lobe (13–12.7 cal. ka BP) and the Trout Lake Ice lobe (13 cal. ka BP) (Lemmen and others, Reference Lemmen, Duk-Rodkin and Bednarski1994; Smith, Reference Smith1994; Dyke, Reference Dyke2004) (Fig. 6b). The LIS entirely retreated from the study area depicted in Figure 6b after 12.7 cal. ka BP, to make way for the McConnell Glacial Lake (Smith, Reference Smith1994).
3.2. Methods
To identify, map and characterise the drainage network relative to these lobes, we mapped meltwater channels, tunnel valleys and major moraine complexes using the 10-m digital elevation model (DEM) Arctic DEM computed by optical stereo imagery (Porter and others, Reference Porter2018). Using hillshaded DEMs, we digitised drainage networks, marginal and subglacial landforms in a Geographic Information System (QGIS). The width and depth of drainage features were extracted using regularly spaced transverse cross sections. The sinuosity index of drainage features was calculated using their channel-parallel length and their straight line length using a ‘Minimum Bounding Geometry’ tool. The maximum lobe extension area at a given time is roughly approached from the inflection points related to the protruding lobe delimited by major arcuate moraine complexes and the drainage cover index is measured using Eqn (2).
3.3. Palaeoglaciological mapping
3.3.1. Landform signature of palaeo-ice lobe positions
3.3.1.1. Trout Lake area
In the Trout Lake area (Fig. 7a), a set of 30 patches of moraine ridges, typically 500 m wide, few tens of kilometres long and up to 20 m high, form a nearly continuous and curvilinear morainic complex that draws the position of a palaeo-ice lobe margin. A maximum extension area of 170 km2 is estimated for the Trout Lake Lobe.
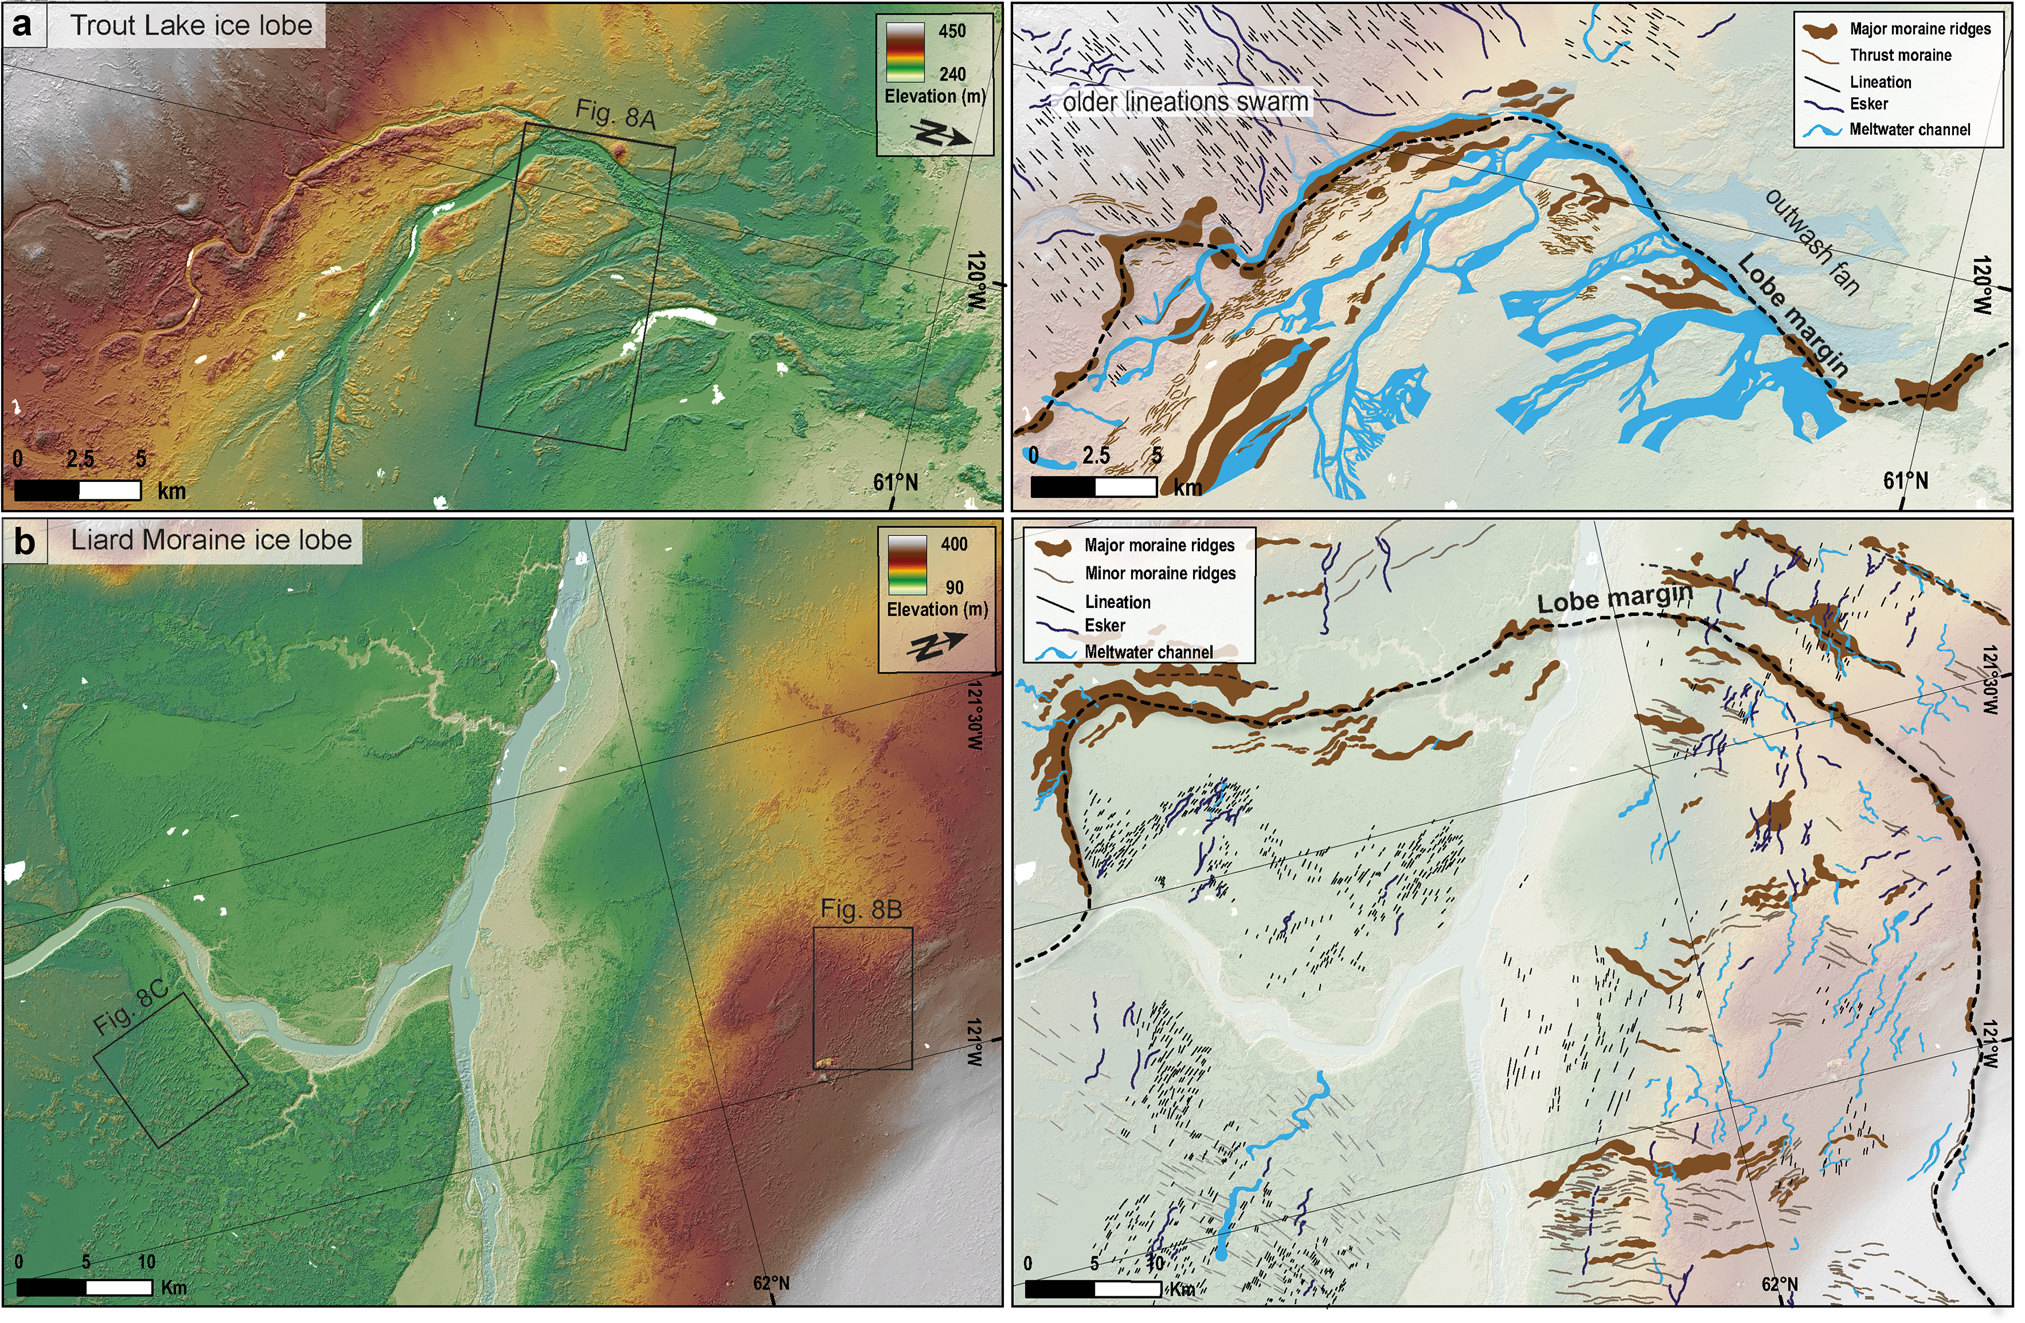
Fig. 7. Arctic DEM (Porter and others, Reference Porter2018) and interpreted maps with digitised landforms of the palaeo-Trout Lake (a) and Liard moraine (b) ice lobes.
3.3.1.2. Liard moraine area
Ice-marginal landforms are common in the Liard Moraine area (Fig. 7b). Multiple discontinuous curvilinear and arcuate ridges are observed, indicating former lobe positions. Building upon the work of Brown and others (Reference Brown, Stokes and O'Cofaigh2011), we have mapped 104 fragments of moraine ridges in the area: they are typically 0.5–1 km wide, up to few tens of kilometres long and 10–20 m high with frequently eroded crestlines. The approximate maximal extent of the ice lobe in the study area can be reconstructed from interpolated junctions between discontinuous major ridges: these form an arcuate moraine complex one hundred kilometres long. A maximum lobe extension area of roughly 1800 km2 can be estimated.
3.3.2. Palaeo-drainage characteristics
3.3.2.1. Trout Lake area
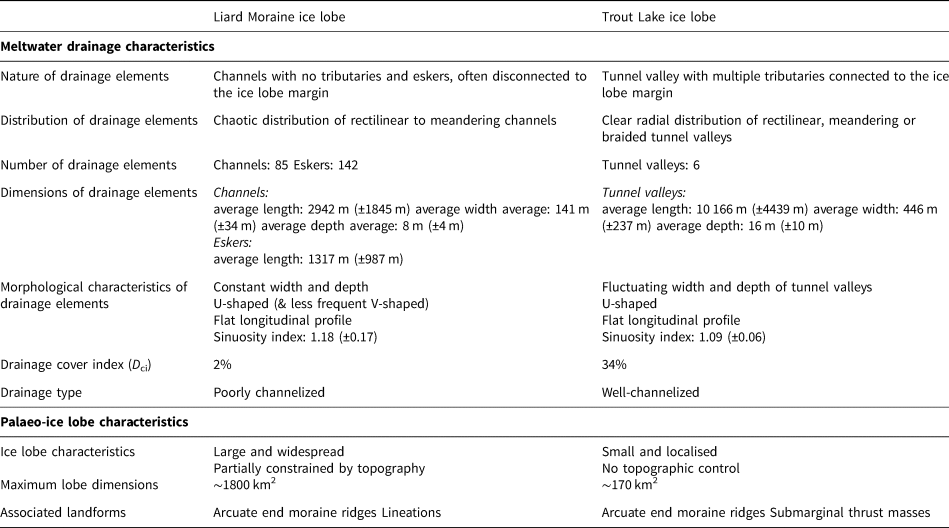
In the Trout Lake lobe area, mapped drainage features are erosional only (no eskers). A network of 6 major erosive drainage elements (6–15 km long, 200–700 m wide and 5–25 m deep) characterised by numerous tributaries (1–3 km long, 100–200 m wide and 3–13 m deep) forms a well-developed system of slightly sinuous to braided (mean sinuosity index: 1.09) water passageways (Figs 7a and 8a; Table 2). This network exhibits a clear radial pattern relative to the belt of end moraine ridges indicating the palaeo-lobe margin. Drainage element terminations delineating the palaeo-lobe margin suggest they were active during the ice lobe formation. Drainage elements display variations in widths and depths along their long profiles, U-shaped cross profiles and clear connections with the palaeo-lobe margin. The drainage cover index (D ci) measured for this drainage network is 34% (Table 2).

Fig. 8. Shaded relief derived from the Arctic DEM (Porter and others, Reference Porter2018) illustrating the drainage features and landform assemblages characterising the bed of each palaeo-ice lobe mapped in Figure 7. (a) Large tunnel valleys with tributaries observed beneath the Trout Lake lobe. Note the occurrence of closely spaced ridges interpreted as subglacial thrust ridges in between tunnel valleys. (b) Slightly sinuous and minor channels typically covering the bed of the Liard moraine ice lobe. (c) Lineations swarm taken from the Liard moraine ice lobe.
Table 2. Comparison of subglacial meltwater drainage and palaeo-ice lobe characteristics, respectively for the Liard Moraine and Trout Lake ice lobes
3.3.2.2. Liard moraine area
Small-scale erosional and depositional features related to meltwater drainage occur in the Liard Moraine Lobe area. We identified 85 single drainage elements: they are 1–5 km long and 4–12 m deep on average, with constant widths along their paths (110–175 m wide). They are rectilinear to slightly sinuous (mean sinuosity index: 1.18) with nearly flat long profiles and are devoid of tributaries (Figs 7b and 8b). A U-shaped cross profile is commonly observed for these water passageways. We also mapped 142 eskers: they display lengths (0.5–2.5 km) similar or slightly lower than channels (Table 2). Both erosional and depositional drainage features are concentrated in the area delimited by the belt of major moraine ridges (Fig. 7b). They are transverse to the main moraine belt and radially distributed. These drainage features are poorly connected to each other and commonly disconnected from the inferred maximum lobe margin. Considering the estimation of maximum lobe extension and the hypothesis that the mapped drainage features are contemporaneous to the lobe activity, we compute a drainage cover index (D ci) of 2% for the Liard Moraine Lobe.
3.3.3. Landform assemblages
3.3.3.1. Trout Lake area
Upstream from the end moraine delineating the Trout Lake lobe margin, a series of closely and regularly spaced, parallel or sub-parallel ridges are observed (Figs 7a and 8a). These ridges are often sinuous. They are much smaller in dimensions than end moraines ridges in the area (30–50 m wide, 250–700 m long and 3–5 m high). They gather in arcuate belts, 1–2 km in width, that occur parallel to and up-ice from the major end moraine ridges. Considering their pattern and dimension, we interpret these ridges as thrust moraines representing the surface expressions of folds and/or thrust slices formed by subglacial glacitectonism.
3.3.3.2. Liard moraine area
Several patches of small-scale lineations, typically 250–600 m long, 50–100 m wide and less than 5 m high, are visible upstream from the lobe margin. They are predominantly transverse to the end moraine belts and do not exhibit overprinting or cross-cutting relationships with other landforms (Figs 7b and 8c), which suggests a synchronous formation with the Liard Moraine Lobe activity. In the periphery of major end moraine ridges, we mapped 208 minor moraines, which form curved belts: they are typically 50 m wide, 0.5–2 km long and less than 5 m high. Following Smith (Reference Smith1994), we interpret them as recessional moraines, formed during the overall lobe retreat, when processes of bulldozing were limited but sediments trapped within ice were yearly deposited by ablation into fine ridges at lobe margin (Chandler and others, Reference Chandler, Evans, Roberts, Ewertowski and Clayton2016).
3.4. A landsystem model of drainage efficiency
The efficiency of subglacial drainage is known to control subglacial bed deformation, erosion and glacier dynamics (Benediktsson and others, Reference Benediktsson, Ingolfsson, Schomacker and Kjaer2009; Phillips and others, Reference Phillips and Lee2013; Lewington and others, Reference Lewington, Livingstone, Clark, Sole and Storrar2020) and thus also the shaping of subglacial landscapes and their constitutive subglacial landform and bedform assemblages (Mäkinen and others, Reference Mäkinen, Kajuutti, Palmu, Ojala and Ahokangas2017; Vérité and others, Reference Vérité, Ravier, Bourgeois, Pochat, Lelandais, Mourgues and Atkinson2021, Reference Vérité2022; Dewald and others, Reference Dewald, Livingstone and Clark2022). In the light of our experimental and mapping results, we intend to establish a relation between the morphological expression of drainage efficiency and ice flow dynamics to refine landsystem models of either surging or streaming ice lobes (Fig. 9).

Fig. 9. Idealised landsystem of channelized efficient drainage (a) and distributed inefficient drainage (b) conceptualised from experimental modelling and palaeoglaciological mapping of two ice lobes of the Great Slave Lake ice stream. The landform signature of each drainage type and ice flow regime is associated with the theoretical evolution trend of ice flow velocity, drainage efficiency and lobe spreading extrapolated from modelling results.
3.4.1. Efficient drainage signature
The small Trout Lake Ice lobe (~170 km2) is associated with a well-developed channelized drainage system (D ci > 30%) composed of radially distributed drainage passageways that are connected to the palaeo-lobe margin. Their dimensions (2 to 3 times bigger in length, width and depth than channels), connections to the margin, their tributaries and their shapes allow these drainage elements to be considered as tunnel valleys (Kehew and others, Reference Kehew, Piotrowski and Jørgensen2012; Atkinson and others, Reference Atkinson, Andriashek and Slattery2013).
Tunnel valleys are believed to have been efficient meltwater passageways, lowering the subglacial water-pressure and triggering ice-bed coupling in between tunnel valleys. This is recorded through the development of a submarginal belt of thrust-block moraines paralleling the lobe margin, only locally interrupted by the course of tunnel valleys (Figs 7a and 9a). This is consistent with interpretations, derived from the identification of a subglacial drainage network beneath Humboldt glacier (northern Greenland), that focused water drainage causes sticky inter-channel ridges with higher basal friction (Livingstone and others, Reference Livingstone, Chu, Ely and Kingslake2017). We therefore suggest that the submarginal belt of thrust moraines could be a landform signature of efficient drainage, widespread ice-bed coupling and compressive stress transmitted to the bed during the post-surge slowdown of ice flow (Fig. 9a). Vérité and others (Reference Vérité, Ravier, Bourgeois, Pochat, Lelandais, Mourgues and Atkinson2021) have interpreted some submarginal bedforms distributed in between channelized systems in response to ice-bed coupling and high basal shear stress induced by strong down-ice velocity gradients. Due to their regular wavelengths (i.e spacing between bedforms), Vérité and others (Reference Vérité, Ravier, Bourgeois, Pochat, Lelandais, Mourgues and Atkinson2021) have interpreted these structures as ribbed bedforms and invoke a process of formation governed by subglacial deformation and development of thrust-like planes in the sedimentary bed. Similarly, Benediktsson and others (Reference Benediktsson, Ingolfsson, Schomacker and Kjaer2009) proposed that submarginal end moraines can form by thrusting and shearing of glacial deposits at the end of the surging phase of Brúarjökull (Iceland), especially in zones of efficient subglacial drainage. The submarginal increase in basal friction limits the growth and spreading of the lobate margin of the Trout Lake ice lobe (maximum lobe dimensions ten times smaller than the Liard Moraine ice lobe), emphasised by a rather short and slightly arcuate end moraine ridge.
The absence of lineations beneath the lobe suggests a probable lower rate of subglacial bed deformation, either related to lower ice flow velocity or short-lived episodes of high flow velocities (e.g. surges). Seasonal or multi-seasonal increases of subglacial meltwater flow are possible and could temporarily overwhelm the existing drainage network (e.g. spring events), but modelling results and the absence of landforms related to sustained high flow velocity suggest that the drainage network might quickly accommodate transient changes in meltwater discharge. Based on lobe dimensions and characteristics of landform assemblages, and by comparison with experimental results (section 2), we interpret the bed of the palaeo-Trout lake lobe as a landscape relict recording efficient drainage, possibly associated with surging episodes (Fig. 9a).
3.4.2. Inefficient drainage signature
The Liard Moraine ice lobe is extensive (~1800 km2) and characterised by a poorly developed drainage system (D ci < 2%), mainly composed of rectilinear drainage elements devoid of tributaries. They are two to three times smaller than the tunnel valleys depicted beneath the Trout Lake ice lobe. Many drainage elements are totally disconnected from the palaeo-ice lobe margin, although some of them are probably not contemporaneous with the maximum lobe extent (Fig. 7b). Based on the differences in dimensions, spatial distribution and morphology, we consider that the subglacial drainage system of the Liard Moraine ice lobe was dominated by meltwater channels rather than tunnel valleys (Kehew and others, Reference Kehew, Piotrowski and Jørgensen2012; Atkinson and others, Reference Atkinson, Andriashek and Slattery2013).
The Liard moraine ice lobe is ten times more widespread than the southern Trout Lake lobe, probably in response to a more sustained input of ice and/or higher ice flow velocities. Multiple swarms of glacial lineations are visible beneath the lobe, indicating either subglacial deformation by fast-flowing ice (Stokes and others, Reference Stokes2013) or subglacial bed deformation over prolonged periods of time (Boyce and Eyles, Reference Boyce and Eyles1991) (Fig. 8c). Sustained ice flow at the outlet of land-terminating ice streams is suspected to form pronounced and protruding lobate margins when the ice flux is not constrained by topography, evidenced by a long moraine belt (Fig. 9b). Patterson (Reference Patterson1997) argued that well-developed lobes at the margin of the southeastern Laurentide Ice Sheet represent outlets of terrestrial ice streams analogous in size to those in West Antarctica, suggesting that an ice flux similar to that from Ice Stream B (30 km3 a−1: Bindschadler and others, Reference Bindschadler, Stephenson, MacAyeal and Shabtaie1987) could have created the Des Moines lobe in ~1000 years. Our modelling and the mapping of landforms conducted by Jennings (Reference Jennings2006) in Minnesota led to similar conclusions on the conceptualisation of connections between ice stream and ice lobe dynamics. To advance beyond the ice sheet, an ice lobe must receive a continuous flow of ice from the ice stream and must sustain high basal water pressure to lubricate the ice-bed interface. This is made possible by small and rectilinear channels devoid of tributaries enhancing sustained high basal water pressure and sliding rates in response to drainage inefficiency maintained over prolonged periods of time. Based on lobe dimensions, morphology, drainage characteristics and by comparison with experimental results we interpret the bed of the palaeo-Liard moraine ice lobe as a landform relict of an ancient inefficient drainage beneath an outlet glacier fed by an active ice stream (Great Slave Lake Ice Stream) (Fig. 9b).
3.4.3. Comparison with existing landsystem models
We suggest that changes in drainage efficiency control fast ice flow regimes (surging vs streaming) and produce distinct landsystems (Fig. 9). We aim to compare our findings to existing landsystem models proposed for ice streams and ice surges. Surge-type and stream-type glacial landsystems share many characteristics that lead some authors to suggest to use modern surge-type glaciers as analogues for ice streams (Ingólfsson and others, Reference Ingólfsson2016), although it is still challenging to figure out if present-day surging processes and landsystem models can be scaled-up and applied to Pleistocene ice streams.
3.4.3.1. Surging glacier landsystem
Based upon a combination of observations from contemporary and ancient surging-glacier margins (Evans and Rea, Reference Evans and Rea1999; Benediktsson and others, Reference Benediktsson2015; Ingólfsson and others, Reference Ingólfsson2016; Evans and others, Reference Evans, Atkinson and Phillips2020), classical landsystem models of surging glaciers are typically composed of: thrust-block moraines in marginal to submarginal environments, hummocky moraines related to supraglacial melt-out and flowage of debris from stagnant ice, flutes, widespread geometric and sinuous ridge networks (i.e. crevasse and hydrofracture infills) and concertina eskers related to subglacial deformation during the active phase of the surge (Evans and Rea, Reference Evans and Rea1999; Evans and others, Reference Evans, Storrar and Rea2016, Reference Evans, Ewertowski, Roberts and Tomczyk2022). Most of these typical landforms are neither reproduced experimentally nor observed beneath the Trout lake lobe. The short duration of fast-flow events might explain the absence of flutes beneath the Trout Lake ice lobe. Based on our experiments and observations, we suggest that surging is also possibly evidenced by well-developed and channelized tunnel valley systems, characterised by multiple tributaries. Submarginal belts of thrust block moraines in between tunnel valleys indicate an increase of subglacial bed deformation during surging episodes (Fig. 9a).
3.4.3.2. Ice stream landsystem
Most classical ice stream landsystem models are characterised by a corridor of highly elongated glacial lineations (MSGLs), which were postulated to reflect rapid ice velocities (Clark, Reference Clark1993) bounded by lateral shear margin moraines (Dyke and Morris, Reference Dyke and Morris1988; Stokes and Clark, Reference Stokes and Clark2002) or ribbed moraine corridors (Vérité and others, Reference Vérité, Ravier, Bourgeois, Pochat, Lelandais, Mourgues and Atkinson2021). Taken together, these were argued to represent key ‘geomorphological criteria’ for identifying palaeo-ice streams (Evans and others, Reference Evans, Young and Cofaigh2014; Stokes and others, Reference Stokes2018). The signature of terrestrial-terminating ice streams also encompasses major end moraines ridges, hummocky moraine arcs and possible corridors of geometric and sinuous ridges (crevasse and hydrofracture infills) during the late-stage ice stream activity (Evans and Rea, Reference Evans and Rea1999; Evans and others, Reference Evans, Storrar and Rea2016; Reference Evans, Ewertowski, Roberts and Tomczyk2022). Lineation swarms, related to sustained fast ice flow, are observed beneath the Liard Moraine ice lobe and are therefore consistent with the classical ice stream landsystem. However, classical ice stream landsystems do not refer to the morphological characteristics of the subglacial drainage network. We demonstrate a potential morphological signature of an overall trend of prolonged inefficient drainage (that does not exclude transitory periods of drainage efficiency) which is in turn responsible for sustained high ice flow velocity and ice streaming. We suggest that poorly connected drainage with many small and rectilinear meltwater channels, devoid of tributaries, and often disconnected from lobe margins, could be implemented to existing model, especially for deciphering the contribution of subglacial hydrology to ice stream mechanics (Fig. 9b).
4. Conclusions
Experimental modelling and palaeoglaciology contributed to quantify and conceptualise the relations between evolution in efficiency of subglacial drainage landystems and fast ice flow regimes for timescales stretching beyond the available observational record. These approaches especially gave new insights into landsystem models associated with evolution of drainage efficiency and their relations with the duration of fast ice flow events. Rapid increase of drainage efficiency through tunnel valleys development that are connected to ice lobe margins reduces the duration of ice flow speed-up events (e.g. ice surges), by decreasing water pressure and promoting widespread ice-bed coupling. Tunnel valleys, with multiple tributaries, subglacial to submarginal thrust moraines and reduced ice lobe extensions are the most distinctive characteristics of efficient drainage for terrestrial outlets. When tunnel valleys are replaced by rectilinear meltwater channels of much smaller dimensions, the inability of the drainage system to accommodate meltwater input leads to sustained high ice flow velocity (e.g. ice streams). Smaller, disconnected and rectilinear channels, lineations swarms and extensive ice lobes are thought to indicate sustained drainage inefficiency.
Supplementary material
The supplementary material for this article can be found at https://doi.org/10.1017/jog.2022.107.
Acknowledgements
This study is part of the Ice-Collapse project (The dynamics of ice sheet collapse in deglaciation periods) funded by the French Agence Nationale de la Recherche through grant ANR-18-CEO1-0009. It has benefited from the DEFORm projet (Deformation and Erosion by Fluid Overpressure) funded by ‘Région Pays de la Loire’. We are very grateful to the two anonymous reviewers who contributed to improve significantly the paper relevance.


 Open access