
Studies generally show that higher levels of macro-level economic development and performance produce greater satisfaction with democracy among citizens (Bernauer and Vatter Reference Bernauer and Vatter2012; Clarke et al. Reference Clarke, Dutt and Kornberg1993; Ezrow and Xezonakis Reference Ezrow and Xezonakis2011; Farrell and McAllister Reference Farrell and McAllister2006; Henderson Reference Henderson2008; Schäfer Reference Schäfer2013; Wagner et al. Reference Wagner, Schneider and Halla2009). Positive evaluations of the economy at the individual level also strongly predict higher levels of satisfaction with democracy (Anderson and Guillory Reference Anderson and Guillory1997; Blais and Gélineau Reference Blais and Gélineau2007; Kim Reference Kim2009; Waldron-Moore Reference Waldron-Moore1999). Furthermore, an institutional view asserts that satisfaction with democracy should be higher in power-sharing (consensual) democracies than in power-concentrating (majoritarian) ones by expanding the number of electoral winners and giving multiple segments in society a stake in the decision-making process (Norris Reference Norris2011: 209–11). Yet many studies have failed to demonstrate that satisfaction with democracy differs in such different types of electoral systems and competing types of democracy (Aarts and Thomassen Reference Aarts and Thomassen2008; Bernauer and Vatter Reference Bernauer and Vatter2012; Ezrow and Xezonakis Reference Ezrow and Xezonakis2011; Henderson Reference Henderson2008; Kim Reference Kim2009; Norris Reference Norris2011; Wagner et al. Reference Wagner, Schneider and Halla2009).
Thus, theories suggest, first, that political support derives from satisfaction with institutional performance, in particular the way government handles the economy. Second, they imply that power-sharing systems generate greater satisfaction by being more inclusive and narrowing the gap between electoral winners and losers, although the type of power-sharing regime does not necessarily determine overall levels of democratic satisfaction, judging from previous empirical findings. We argue, however, that this has been mainly due to a lack of studies that take both the economic and politico-institutional contexts into account simultaneously in the analysis. The effects of economic performance and governing structures have often been examined separately, and how economic performance and power-sharing interact to co-produce satisfaction with democracy has been neglected.
We posit that there is a macro-level-conditional effect at play. Our interactive theoretical model first and foremost depicts how governmental power-sharing affects the impact of economic conditions on support for the democratic system. This logical interaction is in line with that of Powell and Whitten (Reference Powell and Whitten1993: 399), who in their study of economic voting expected that ‘both positive and negative effects of economic performance will be diminished in countries where responsibility is widely diffused’. Economic upswings should result in greater satisfaction with democracy, but this relationship is conditional upon the type of government present in a country. And vice versa, the effect of power-sharing in government on satisfaction with democracy is conditional upon economic performance. Power-sharing is here narrowly defined as fractionalization within government. The advantage of such an operationalization is that it is a more dynamic measure rather than long-term institutional arrangements that encourage power-sharing. We thus combine short-term economic performance and the changeable characteristics of governments. Broad coalition government reduces both the negative effect of economic downturns and the positive effect of economic upswings on satisfaction with democracy. Satisfaction with democracy, we show, remains relatively high in systems with fractionalized coalition governments when the economy is performing poorly, while in economically good times satisfaction with democracy does not radically increase where multiparty governments are in place. If there is one dominant party in the government, satisfaction with democracy is particularly low when the economy deteriorates, and possibly higher in economically good times.
The structure of the article is as follows. First, the theoretical discussion revolves around the fact that satisfaction with democracy is, first of all, a complex concept and, second, the product of a host of factors. Next, we focus on the predictors in our model and particularly on the previous findings on the role of economic performance and political-institutional context in explaining democracy satisfaction. The third part presents our data and the variables, and the fourth part puts forward the study’s main findings. This study takes a dynamic multilevel approach by analysing comparative longitudinal survey data. Multiple waves of data from the European Social Survey (ESS) between 2002 and 2013 are analysed to understand the dynamics of satisfaction of democracy as an interactive function of economic performance and government fractionalization. The fifth and final part provides concluding remarks.
Measuring Satisfaction with Democracy
In the European Social Survey (as in many other data sets) the standard question on satisfaction with democracy (SWD) is asked as follows: ‘On the whole, how satisfied are you with the way democracy works in [country]?’. Several scholars have found this survey item very troublesome. First, the measure may cover multiple dimensions of political support which vary across individuals, time and space. It may also measure support for incumbent authorities, the political system, the political process and democracy as a general form of government (Clarke et al. Reference Clarke, Dutt and Kornberg1993; Grönlund and Setälä Reference Grönlund and Setälä2007). Second, the respondents are requested to evaluate the present state of democracy against some standard performance (Canache et al. Reference Canache, Mondak and Seligson2001) or even some democratic ideal, which are evidently difficult concepts to define. Third, and perhaps most importantly, there is disagreement whether the indicator refers to the generalized attitude towards the political system (Fuchs et al. Reference Fuchs, Guidorossi and Svensson1995).
There is no clear understanding in the literature of how the performance of the democratic regime, the functioning of the democratic process and support for the democratic principles are related. This debate derives from David Easton’s (Reference Easton1965, Reference Easton1975) classic differentiation between specific and diffuse support for the political system. Specific support describes the citizens’ object-specific evaluations of the performance of particular political authorities, institutions or the implementation of policy outputs (Miller Reference Miller1974; cf. Citrin Reference Citrin1974). In contrast, diffuse support of the political system refers to the evaluations of what a political object represents, not of what it does in practice, thus encompassing the effect it has on the entire political system and its fundamental arrangements (Easton Reference Easton1975: 444–5; see also Dalton Reference Dalton2006).
Since Easton’s definition does not directly categorize political institutions and actors according to the type of support they enjoy, and since they may be objects of both specific and diffuse support, varying interpretations have been unavoidable (e.g. Bellucci and Memoli Reference Bellucci and Memoli2012; Torcal and Montero Reference Torcal and Montero2006). Norris’s (Reference Norris1999) definition of five levels of support that exist in a continuum ranging from diffuse support to specific support offers at least partial clarification for this conceptual confusion. By distinguishing support for political community, regime principles, regime performance, regime institutions and political actors, the categorization makes it possible to separate citizens’ support for the democratic ideal (regime principles) and satisfaction with the political system’s capacity to deliver goods and deal with important issues (regime performance) (Linde and Ekman Reference Linde and Ekman2003).
Empirically, then, even if we were to accept that the survey item measuring satisfaction with democracy captures regime performance (Dalton Reference Dalton2004; Norris Reference Norris1999), not support for the democratic ideal, Easton’s (Reference Easton1965) thought that citizens’ dissatisfaction with policy outputs may erode diffuse support in the long run is problematic. While some scholars argue that in mature democracies the attitudes supporting democratic institutions tend to be quite stable (Duch and Palmer Reference Duch and Palmer2006; Weatherford Reference Weatherford1984), others claim that they fluctuate depending on political system, its outputs and those in power (Anderson and Guillory Reference Anderson and Guillory1997; Waldron-Moore Reference Waldron-Moore1999). This is often the point where economic voting theory comes in from the cold in the literature: anti-incumbent voting is expanded to cover the general attitude on the functioning of democracy. For economic voting theorists, satisfaction with democracy is in constant fluctuation and depends on the performance of incumbents. Consequently, (dis)satisfaction with the performance of democracy is seen as a byproduct of (dis)satisfaction with government. Empirically, the classical measure of satisfaction with democracy seems indeed to correlate with both satisfaction with economy and satisfaction with government. Furthermore, since political decision-making consists of several governmental agents and complex and long processes, citizens may find it easier to evaluate the functioning of the whole (democratic) system rather than specific political actors (Weatherford Reference Weatherford1987).
Anti-incumbent voting should, however, be kept theoretically separate from citizens’ evaluations of their satisfaction with democracy. The concentration on democratic performance oversimplifies the debate on the validity of the measurement since it ignores the third dimension of democratic satisfaction – that is, the process. First, as in many other studies, our starting point is the standard survey question in which respondents are asked how satisfied they are with the way democracy works. The question is not whether the respondent supports the democratic principles, or whether she is content with the short-term outputs democracy produces. Therefore, the satisfaction-with-democracy question refers first and foremost to the democratic process – that is, ‘constitutional reality’ (Fuchs et al. Reference Fuchs, Guidorossi and Svensson1995: 332) or ‘a felt discrepancy between democratic norms and the actual democratic process’ (Thomassen Reference Thomassen1995: 383). Admittedly, a citizen’s evaluation of the democratic process may implicitly include her evaluations of regime performance and regime principles (reflecting the rules of the process and its outputs). However, the political system has contextual features that either organize or constrain citizens’ attitudes about the workings of the political system and which together mediate preferences, define the choices available and provide citizens with opportunities to be heard in the system (Anderson and Guillory Reference Anderson and Guillory1997; Powell Reference Powell1982, Reference Powell1989). Although these contextual features, such as power-sharing arrangements, are rather stable across time, they interact with short-term factors such as citizens’ general economic perceptions and the societal context in a given country at a given time.
In other words, we argue that citizens’ perceptions of the fluctuations in the short-term outputs of the political system and how these outputs affect their views of the democratic process depend largely on the extent to which institutional arrangements guarantee the responsiveness in the system. System responsiveness may in the simplest form be defined in terms of congruence between the attitudes of constituents and of representatives on policy questions (Eulau and Karps Reference Eulau and Karps1977; cf. Miller and Stokes Reference Miller and Stokes1963). This congruence is hierarchical in character: the lower level of congruence relates to everyday political processes in a country, which are controlled by the structures of government at the higher level (Fuchs and Klingemann Reference Fuchs and Klingemann1995). In practice, attitudinal congruence tells us about the level of external efficacy of the citizens; that is, ‘the judgment that an individual and the public can have an impact on political processes, because government institutions will respond to their needs’ (Miller and Listhaug Reference Miller and Listhaug1990: 358). Favourable positive attitudes to the functioning of the political process (higher external efficacy) should lead, thus, to higher political support, including satisfaction with democracy. Evidently, in the long run, more long-term performance deficits in different policy fields may also have long-term consequences for the support of the democratic regime where a citizen feels that she has no say in the democratic process. Fuchs et al. (Reference Fuchs, Guidorossi and Svensson1995) argue, however, that citizens’ malcontent with the informal structure of democracy, ‘a constitution in operation’ (Lane and Ersson Reference Lane and Ersson1991: 194), does not necessarily extend to the formal structure since this would require the existence of a credible alternative system. On the other hand, as Waldron-Moore (Reference Waldron-Moore1999) points out, citizens’ support for democratic principles does not as such make them satisfied with the democratic process.
Empirically, the satisfaction-with-democracy measure presented in its most general form tends to correlate highly with various measures of political trust. They share, in addition, much common theoretical ground. Both are naturally bound to the specific political context (e.g. Levi and Stoker Reference Levi and Stoker2000) but may also refer to more fundamental arrangements of the political system. While in the short run the lack of political trust (or dissatisfaction with democracy) can be a sign of lack of specific support and have no permanent consequences to the political system or put into question its principles (e.g. Citrin Reference Citrin1974), in the long run the loss of confidence (or democratic dissatisfaction) may also erode diffuse support for the system and challenge its legitimacy (Grönlund and Setälä Reference Grönlund and Setälä2007; Miller Reference Miller1974; Miller and Listhaug Reference Miller and Listhaug1990).
Political trust may also refer to trust in the democratic process, in particular to the responsiveness of the political system. As Hardin (Reference Hardin1999: 26) puts it: ‘to say that I trust you means I have reason to expect you to act, for your own reasons, as my agent with respect to the relevant matter’. However, more often scholars have defined political trust as a basic evaluative orientation of how governmental institutions, political parties and actors operate against the backdrop of normative expectations of a citizen (Hetherington Reference Hetherington1998; Miller Reference Miller1974; Stokes Reference Stokes1962). While acknowledging that our focus on democratic process does not contain a normative component, due to the ambiguity of the standard survey item we feel it is necessary to test the validity of our outcome variable and robustness of our models with the best proxy available. Thus, all the empirical analyses are rerun using trust in parliament, politicians and political parties as outcome variables (see Appendix 2 and 3), and the results are then compared with the results of our main analyses.
Predicting Satisfaction with Democracy: Government Fractionalization and Economy
This study advances the argument that economic performance (X) and government fractionalization (Z) interact to shape citizens’ satisfaction with the way democracy works (Y). Fractionalization refers to the number and size of parties in government. These effects have been examined separately, which neglects the possibility that the effect of each variable is conditional on the values of the other. Before presenting the hypotheses about how the effect of each variable varies with the value of the other, we summarize why economic performance and type of power-sharing arrangement matter in the light of previous research.
A wealth of studies have shown that satisfaction with the performance of the democratic system depends on the perceived quality of policy outputs, political actors and government performance. Economic performance is one of the most evident system outputs. Advocates of the political economy perspective of political support argue that reactions to the performance of national economies and the governments’ effectiveness in managing economic affairs are central for citizens’ evaluations of the political system.Footnote 1 This support is dynamic in nature and strongly influenced by the periodic fluctuations typical for Western capitalist economies (Clarke et al. Reference Clarke, Dutt and Kornberg1993; Weatherford Reference Weatherford1984). There is reason, however, to differentiate between long- and short-term effects on satisfaction with democracy. In the long term, accumulating attitudes of discontent may lead to an erosion of support for the whole political system (Bowler and Karp Reference Bowler and Karp2004). Differences in satisfaction with democracy between countries arise if the economic development is relatively low in the long term in certain countries. In more successful countries, short-term changes in economic performance may have minor consequences for political support. Hence, successful political and economic development creates a reservoir for system support that may soften the effect of temporary setbacks of poor policy outputs at bad times, and the regime is still able to manage its basic duties (Linde and Ekman Reference Linde and Ekman2003).
To some extent, whether people are more satisfied with democracy in consensual systems than in majoritarian ones has also been scrutinized. Lijphart (Reference Lijphart1999: 301–2) concluded that ‘the overall performance record of the consensus democracies is clearly superior to that of the majoritarian democracies’. Consensus democracies are characterized by ‘inclusiveness, bargaining, and compromise’ in contrast to majoritarian political systems, which tend to be ‘exclusive, competitive, and adversarial’. Previous research shows that citizens who voted for a party that entered government after the election (electoral winners) tend to express greater satisfaction with democracy than those who voted for a future opposition party (electoral losers) (Anderson et al. Reference Anderson, Blais, Bowler, Todd and Listhaug2005; Norris Reference Norris2011), even when controlling for their satisfaction level before the elections (Blais and Gélineau Reference Blais and Gélineau2007). An institutional view assumes that power-sharing regimes expand the number of electoral winners and thus increase macro-level satisfaction with democracy (Norris Reference Norris2011: 209–11). One explanation for this is the regime’s way of handling the contestants when the election is over – that is, whether they have to stay in opposition empty-handed or whether the system guarantees their decision-making power despite their loss, and whether the party system guarantees a sufficient citizen–party congruence in opinion formation (Huber and Powell Reference Huber and Powell1994).
This issue is far from settled, however. Wagner et al. (Reference Wagner, Schneider and Halla2009) expected that higher-quality institutions increase satisfaction with democracy, but variables such as proportional representation, plurality, party system fractionalization and government fractionalization did not have a significant impact on satisfaction with democracy. Kim (Reference Kim2009) did not find a significant relationship between proportional representation systems and satisfaction with democracy in eight consolidated democracies in the late 1990s, nor an interaction effect of proportional representation systems and electoral winner. Ezrow and Xezonakis (Reference Ezrow and Xezonakis2011) included disproportionality and number of parties as system-level variables, but they could not find any evidence that they result in short-term changes in satisfaction with democracy based on Eurobarometer surveys between 1973 and 2003. Bernauer and Vatter (Reference Bernauer and Vatter2012) found that their cabinets–direct democracy dimension was positively related to satisfaction with democracy, but they were unable to find direct effects of consensual traits on the parties–interest groups and federal–unitary dimensions on satisfaction with democracy in 24 advanced democracies. On the other hand, they found that ‘consensus democracy on the parties–interest groups dimension … diminishes the satisfaction with democracy of winners, but without increasing the satisfaction of losers, while the federal–unitary dimensions appears to slightly accentuate the gap’ (Bernauer and Vatter 2012: 456). Aarts and Thomassen (Reference Aarts and Thomassen2008) found that a proportional electoral system was negatively related to satisfaction with democracy.
We argue that these discouraging results may be due to the fact that the economic context varies from time to time and power-sharing regimes vary from place to place. The interaction between economic conditions, power-sharing arrangement and satisfaction with democracy has not been examined systematically despite the theoretical possibility of inclusive consensual systems to act as a shield against changes in economy. The large coalition governments provide an opportunity for more people to have their voices heard in the decision-making process, including decisions on economy. In inclusive consensual systems, the citizens should be less affected by changes in the state of the economy.
Thus, combining the two theoretical perspectives gives us a more complex picture where satisfaction with democracy is a function of both economic performance and type of power-sharing regime. The point of examining the interaction is, first, to assess properly how power-sharing arrangements influence satisfaction with democracy. Hence, the effect of power-sharing arrangements may seem insignificant if satisfaction with democracy is higher for inclusive government when the economy is performing poorly, while satisfaction with democracy is lower in the same setting when the economy performs well. Second, and in relation to what is said above, the effect of macroeconomic performance may depend on the type of power-sharing arrangement. This means that the strength of the macroeconomic performance may vary from country to country depending on the political institutional context. This reasoning can be compared with how the economic performance affects voting behaviour, depending on clarity of responsibility (see Nadeau et al. Reference Nadeau, Niemi and Yoshinaka2002; Whitten and Palmer Reference Whitten and Palmer1999).
First, the magnitude of the positive effect of economic growth on satisfaction with democracy is expected to decrease with higher government fractionalization. Thus better economic performance predicts higher satisfaction with democracy overall. But satisfaction with democracy is particularly low when the economy performs poorly and a dominant party controls executive power. This would imply that it is more evident who is in charge and responsible. Broad and inclusive government, on the other hand, dampens the effect of bad economic performance on political support for the system. Second, and vice versa, the magnitude of the positive effect of government fractionalization on satisfaction with democracy should decrease with better economic performance. The gap in satisfaction with democracy is particularly large between systems with non-fractionalized and fractionalized government in economically bad times. Satisfaction with democracy is relatively high in countries with broad governments in both economically bad and good times, but when the economy performs extraordinarily well, satisfaction with democracy can be even higher in countries with a dominant party in charge of government power.
Hypotheses
To sum up, the reasoning above implies that the relationship between economic performance and satisfaction with democracy is conditional upon type of government. When economic performance is at its lowest value, satisfaction with democracy increases with higher government fractionalization (that is, many equally strong coalition parties), but when economic performance is at its highest value, satisfaction with democracy increases with lower government fractionalization (that is, one dominant party). But one should avoid stating that one variable is the moderating (type of government) variable and the other the one moderated (economic performance). As Kam and Franzese (Reference Kam and Franzese2007: 16) point out, ‘logically, all interactions are symmetric’, meaning that ‘x and z must necessarily both intervene in the other’s relationship to y’. This means that the relationship between type of government and satisfaction with democracy is conditional upon economic performance as well. Berry et al. (Reference Berry, Golder and Milton2012: 658–9) state that conditional theories may ‘generate five basic predictions about the marginal effects of X and Z on Y’, but they ‘can be subsumed in a single hypothesis about how the marginal effect of X varies with Z and a single hypothesis about how the marginal effect of Z varies with X’. Incidentally, our hypotheses mimic the logical structure of the conditional hypotheses presented by Berry et al. (Reference Berry, Golder and Milton2012):
Hypothesis 1: The marginal effect of economic growth on satisfaction with democracy is positive at all values for government fractionalization. This effect is strongest in countries with strong single-party governments and weakest in countries with broad coalition governments.
Hypothesis 2: The marginal effect of coalition government on satisfaction with democracy is positive when economic growth is low. This effect declines in magnitude with greater economic growth; at some value of economic growth, coalition government has no effect on satisfaction with democracy. As economic growth rises further, the effect of coalition government becomes negative and the effect of single-party government becomes positive.
Data, Variables and Method
European Social Survey
This study uses comparative survey data from six rounds of the European Social Survey. This centrally coordinated cross-national survey of social and political attitudes in Europe involves face-to-face interviews with representative samples of persons aged 15 and over, selected by random probability sampling methods. The data consist of repeated cross-sectional surveys from 31 countries fielded multiple times between 2002 and 2013. A repeated cross-sectional design means that a survey is administered to a new sample of respondents in each country and for each survey round. The different survey rounds represent the repeated measurements of countries. Countries that have participated in two or more rounds are included. The data are unbalanced since all countries did not participate in every survey.Footnote 2 A total of 139 country samples and 233,769 observations were analysed in the final models.
Dependent Variable
Satisfaction with the way democracy works is the outcome variable. It is based on individual responses to the following survey question: ‘And on the whole, how satisfied are you with the way democracy works in [country]?’ Responses were given on an 11-point scale ranging from 0 (extremely dissatisfied) to 10 (extremely satisfied). The number of missing values is 11,006 (4.1 per cent). The number of missing values varies between 1.0 per cent (France) and 9.2 per cent (Luxembourg).
Individual-level Variables
Gender, age, age squared and years of education are included to account for the impact of sociodemographic background. Age and years of education are divided by 10 to ease interpretation of coefficients.Footnote
3
Subjective measures of performance are based on responses to questions on how satisfied the respondents are with the present state of the national economy, national government, state of education, health services and income differences. These are on an 11-point scale going from 0 (extremely dissatisfied) to 10 (extremely satisfied). They are all group-mean centred to remove between-cluster variation. The reason for this is to be able to focus on objective macro-level measures of economic performance instead of subjective measures which may be ‘associated with the dependent variable by virtue of having been derived from the same survey or interview’ (van der Eijk Reference van der Eijk2002: 41) and thus susceptible to endogeneity bias. Thus the group-centred scores indicate how satisfied a respondent is compared with the average in a particular country and survey round. 0 represents the mean for each country and European Social Survey round. High positive scores indicate that the respondents are, compared with their fellow countrymen, more satisfied with the national government and policy outputs. In the first step, the mean of the individual responses was calculated for each country (j) and survey round (r). In the second step, group-centred values were attained by subtracting the respective mean score from the individual response
 $$(x_{i} {\minus} \bar{x}_{{jr}} )$$
.
$$(x_{i} {\minus} \bar{x}_{{jr}} )$$
.
Macro-level Variables
The level of development and the state of the economy are measured by the GDP per capita and unemployment (World Development Indicators, World Bank 2014). Both cross-sectional (between-country) and temporal (within-country) economic effects on satisfaction with democracy are assessed (see Fairbrother Reference Fairbrother2014). First, the cross-sectional components of economic performance were attained by calculating the means from 2002 to 2012 for each country
 $$(\bar{X}_{j} )$$
, resulting in GDP/cap (mean) and unemployment (mean). GDP/cap was transformed to its natural logarithm (ln) to reduce skewness in the distribution. Second, the temporal components are GDP/cap growth and unemployment (differenced). GDP/cap growth reflects the annual percentage change: negative for decreases and positive for increases.Footnote
4
Unemployment (differenced) captures fluctuations around each country’s long-term mean. The predictor was computed by first creating clusters of respondents grouped by country (j) and year (y). After that, each mean score was subtracted from the annual employment rate
$$(\bar{X}_{j} )$$
, resulting in GDP/cap (mean) and unemployment (mean). GDP/cap was transformed to its natural logarithm (ln) to reduce skewness in the distribution. Second, the temporal components are GDP/cap growth and unemployment (differenced). GDP/cap growth reflects the annual percentage change: negative for decreases and positive for increases.Footnote
4
Unemployment (differenced) captures fluctuations around each country’s long-term mean. The predictor was computed by first creating clusters of respondents grouped by country (j) and year (y). After that, each mean score was subtracted from the annual employment rate
 $$(X_{{jy}} {\minus}\bar{X}_{j} )$$
. Negative values indicate lower unemployment and positive values higher unemployment in relation to a country’s long-term mean.Footnote
5
$$(X_{{jy}} {\minus}\bar{X}_{j} )$$
. Negative values indicate lower unemployment and positive values higher unemployment in relation to a country’s long-term mean.Footnote
5
The main proxy for power-sharing in government is government fractionalization taken from the Database of Political Institutions 2012 (Beck et al. Reference Beck, Clarke, Groff, Keefer and Walsh2001). It measures the probability that two cabinet members picked at random from among the government parties will be of different parties. The variable may range between 0 and 1, where 0 denotes a single-party government and higher values indicate a larger number of equal-sized parties within the government. Government fractionalization is in line with one of the factors in Lijphart’s (Reference Lijphart1999) executive–parties dimension: concentration of executive power in single-party majority cabinets versus executive power-sharing in broad multiparty coalitions. We control for government’s support base, which is operationalized as the fraction of parliamentary seats held by the government parties (Beck et al. Reference Beck, Clarke, Groff, Keefer and Walsh2001). Old democracy is a dummy variable indicating countries which have consistently scored between 6 and 10 on Polity IV’s democracy scale since the end of the 1970s (Marshall et al. Reference Marshall, Gurr and Jaggers2014). These include all countries in Western Europe and Israel (coded as 1), while the other cluster of states includes countries in Eastern Europe and Turkey (coded as 0). The dynamics behind democratic support may be different in old and new democracies, depending on which criteria regimes are evaluated (Waldron-Moore Reference Waldron-Moore1999). Differences in satisfaction with democracy between countries in Western and Eastern Europe may also be linked to the level of economic development (Schäfer Reference Schäfer2013).
Interaction Variables
Two interaction terms are created to test the hypothesized conditional effects of government fractionalization and short-term economic performance. Only the temporal economic variables are included in the interaction terms: Government fractionalizaton×GDP/cap growth and Government fractionalization×Unemployment (differenced). They are entered in separate models to avoid high intercorrelation among the macro-level predictors.
Method
Multilevel modelling is applied to examine the variability in satisfaction with democracy. This is an appropriate method for examining repeated cross-sectional data which are hierarchically structured in three levels such that individuals (level 1) are nested in surveys (level 2), which, in turn, are nested in countries (level 3) (see Duncan et al. Reference Duncan, Jones and Moon1998: 105). Multilevel mixed-effects linear regression analyses are performed using maximum likelihood estimation. In the random part, the intercept is allowed to vary at both level 3 (between countries) and level 2 (between rounds within countries). The multilevel model-building process involves a series of models with complexity increased in every successive model. All the independent variables (except GDP/cap growth) are either grand-mean centred or group-mean centred to provide interpretable parameter estimates and establish meaningful zero points (see Appendix, Table A1, for descriptive statistics).
Empirical Results
Tables 1 and 2 present the estimates for multilevel linear regression models. The dependent variable is satisfaction with how democracy works on a scale between 0 and 10. Model 0 is the empty model without any of the predictor variables (Table 1). It shows that the overall mean for satisfaction with democracy is 5.11 across all observations. The intraclass correlation coefficients represent the proportion of the variance in satisfaction with democracy between countries and over time: 17 per cent of the variance is explained by differences between countries, 4 per cent between European Social Survey rounds and the remaining 79 per cent attributable to individual differences. Model 1 adds the individual-level predictors. The effects of gender, age and education are generally small, yet statistically significant (which would be expected with such a large data set). Subjective satisfaction with the national government’s performance has a substantially larger impact where every one-point increase on the 11-point scale results in 0.40 point of higher satisfaction with democracy. The effect of satisfaction with the national economy is about half as large. Satisfaction with government performance and the national economy are, however, strongly connected. The individual-level predictors do not explain between-country differences in satisfaction with democracy judging from the marginal decrease in the variance component associated with variability on outcome over level-3 units (countries). Note, however, that the variables for subjective evaluations of performance are group-mean centred and do not capture between-country differences.
Table 1 Explaining Satisfaction with Democracy: Individual-level Predictors
Notes. Estimates and standard errors are based on multilevel mixed-effects linear regression. R-squared=proportional reduction of prediction error at level 1 by comparing the total residual variances of the fitted model and the empty model. N=233,769 (level 1); 139 (level 2); 31 (level 3).
**p<0.01; *p<0.05.
Table 2 Explaining Satisfaction with Democracy: Macro-level Predictors
Notes. Estimates and standard errors are based on multilevel mixed-effects linear regression. Coefficients for the individual-level predictors are not reported since they are unaffected compared with Model 1. R-squared=proportion reductions in variances at levels 2 and 3 (compared with Model 1). N=233,769 (level 1); 139 (level 2); 31 (level 3).
**p<0.01; *p<0.05.
The country-level predictors, without any interaction terms, are added in Models 2 and 4 in Table 2 (the coefficients for the individual-level variables are unaffected and therefore not reported). Overall, the macro-level variables have much more explanatory power: the between-country variance components and the intraclass correlation coefficients decrease substantially. As expected, the macro-level economic performance variables are significantly related to satisfaction with democracy. Greater levels of GDP per capita (both long-term mean and short-term change) are positively related to satisfaction with democracy (Model 2), while greater rates of unemployment are negatively related (Model 4). Government fractionalization has also a significant direct effect, implying that satisfaction with democracy is higher in countries with a higher number of parties in government. The effect of the government’s support base is negative, but it is statistically insignificant in most models. Satisfaction with democracy is generally higher in more economically advanced ‘old’ democracies. The reason why the dummy variable for ‘old’ democracies in Europe is not significant in Model 2 is that it covaries with the long-term mean for GDP per capita, which is a stronger predictor, while the dummy is significant when unemployment is included as an independent variable.
Our main focus is on the interaction between government fractionalization and short-term economic performance. The two product terms – GDP/cap growth and unemployment variability around the mean – were included in the final models and provide support for the hypothesized conditional effects. If the coefficient of the product term for government fractionalization and GDP/cap growth is negative, the hypothesized conditional effects can be confirmed. Since unemployment is negatively related to economic growth, the product term for government fractionalization and unemployment variance should be positive to support the two conditional hypotheses. The coefficient for the product term is significant and negative (β=−0.23, p<0.01) in Model 3 (p<0.01) and significant and positive (β=0.14, p<0.05) in Model 5. This implies that differences in satisfaction with democracy are smaller between countries with non-fractionalized and fractionalized governments the better the national economy performs.
To effectively present and interpret the interaction effects, we relied on practical advice proposed by Kam and Franzese (Reference Kam and Franzese2007) and Berry et al. (Reference Berry, Golder and Milton2012). The marginal effects of each independent variable, while taking into account the value of the second independent variable in the multiplicative term, are presented in Figures 1 to 4. The other explanatory variables are set at their means. The estimated marginal effects are plotted across the entire observed range for government fractionalization and both economic performance variables. The graphs partly support the first hypothesis that the marginal effect of economic growth on satisfaction with democracy is positive at all values for government fractionalization. The 95 per cent confidence intervals (dashed curves) around the marginal effect lines show that the effect of economic performance is not significant when government fractionalization reaches higher values. It is clear, however, that the effect of economic performance is strongest in countries with strong single-party governments and weakest in countries with broad coalition governments. The effect of economic performance on satisfaction with democracy is largest in countries with single-party governments, and the effect decreases with increasing government fractionalization. This is demonstrated in Figure 1, where the marginal effect of GDP per capita growth is 0.15 when government fractionalization is at its lowest value. The marginal effect of GDP per capita growth declines in magnitude as government fractionalization increases, being statistically significant when the value of government fractionalization is between 0 and 0.55. Since economic growth and unemployment are inversely related, we see a marginal effect line sloped upwards in Figure 2. The marginal effect of variance in unemployment is negative and significant when government fractionalization varies between 0 and 0.55 as well.
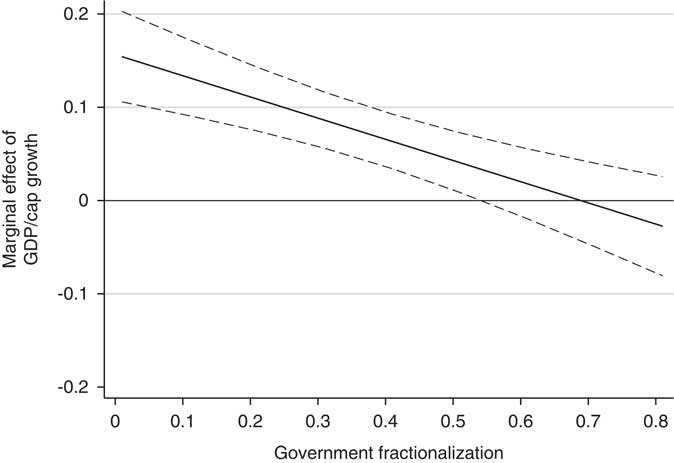
Figure 1 Marginal Effect of GDP/Cap Growth on Satisfaction with Democracy for Different Values of Government Fractionalization
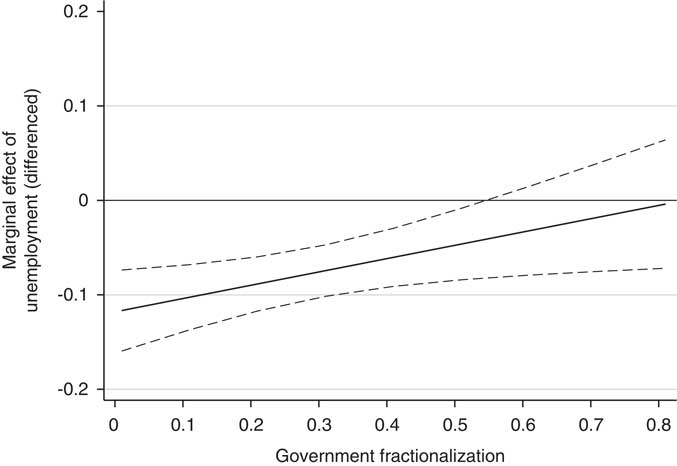
Figure 2 Marginal Effect of Unemployment (Differenced) on Satisfaction with Democracy for Different Values of Government Fractionalization
The second hypothesis was more complex. The plots affirm, first, that the marginal effect of coalition government on satisfaction with democracy is positive when economic growth is low and that this effect declines in magnitude with greater economic growth. In Figure 3, the marginal effect of government fractionalization is positive and significant when GDP/cap growth varies between −6 and +2 per cent and negative and significant when GDP/cap growth is above 7 per cent. The assumption that, as economic growth rises further, the effect of coalition government becomes negative and the effect of single-party government becomes positive is only empirically true when GDP/cap growth is included in the interaction term. In Figure 4, the marginal effect of government fractionalization is not statistically significant when unemployment (differenced) is at its lowest value. Otherwise we observe an expected upward slope. The marginal effect line crosses 0 when unemployment is about 4 percentage points below a country’s long-term mean and becomes statistically significant when the unemployment measure is just below (−1 percentage point) and higher than 0.
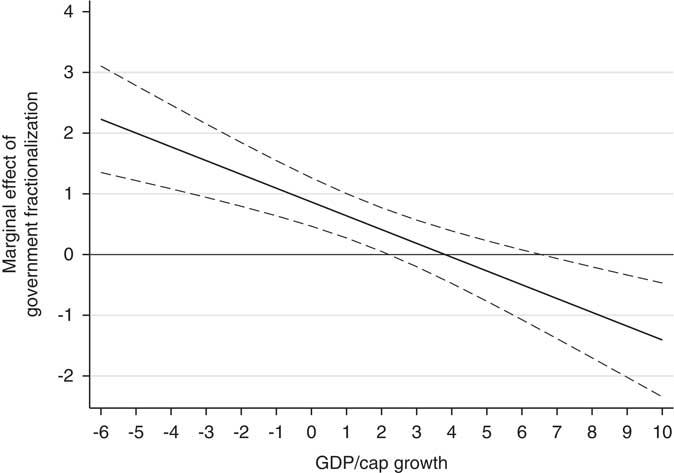
Figure 3 Marginal Effect of Government Fractionalization on Satisfaction with Democracy for Different Values of GDP/Cap Growth
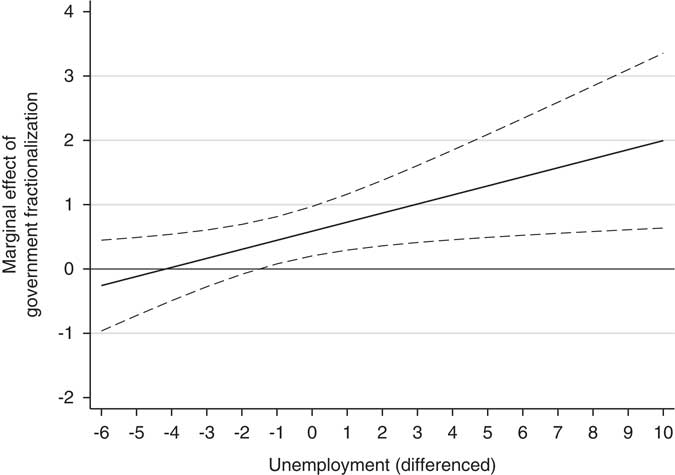
Figure 4 Marginal Effect of Government Fractionalization on Satisfaction with Democracy for Different Values of Unemployment (Differenced)
The predicted probabilities presented in Figures 5 and 6 are more intuitive for the interpretation of the interaction effects. The first (solid) line represents a country with a single-party government when government fractionalization has the value 0. The second (long dashed) line denotes a country with a highly fractionalized government with the value 0.75 (1 is the maximum value). This value is representative of governments with four to six parties in Finland, Switzerland and Slovakia in the 2000s. Using GDP/cap growth provides more reliable estimates (narrower confidence interval) than including unemployment variance in the interaction together with government fractionalization. When economic performance is poor, satisfaction with democracy is higher in countries with fractionalized governments and lower in countries with less fractionalized governments. The lines cross when GDP/cap growth is about 4 per cent. When economic performance is very good, it is the other way around, with greater satisfaction with democracy in countries with less fractionalized governments.
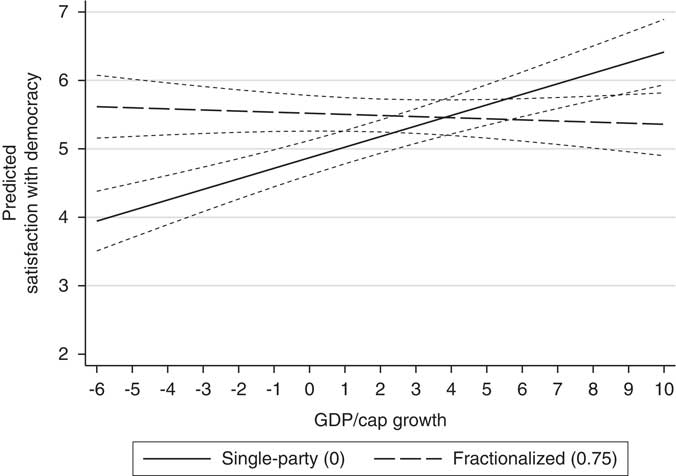
Figure 5 Satisfaction with Democracy Predicted by the Two-way Interaction between GDP/Cap Growth and Government Fractionalization
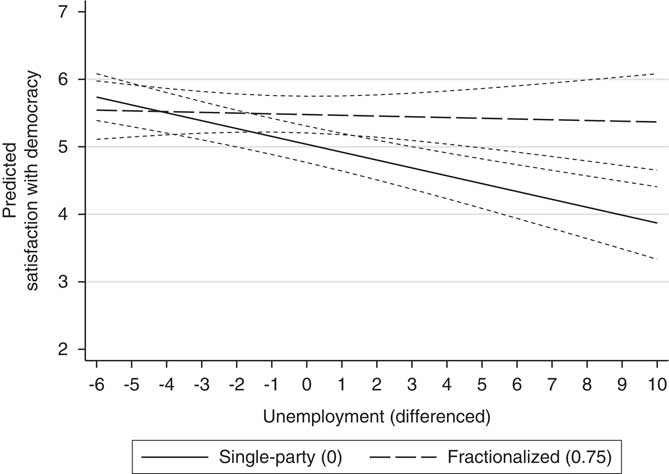
Figure 6 Satisfaction with Democracy Predicted by the Two-way Interaction between Unemployment (Differenced) and Government Fractionalization
Robustness Checks
Tests of the robustness of the findings were conducted by using alternative dependent and independent variables. First, trust in the country’s parliament, trust in politicians and trust in parties were included as alternative dependent variables. Individuals’ confidence in political institutions have been shown to be positively related to satisfaction with the way democracy work (Schäfer Reference Schäfer2013; Zmerli et al. Reference Zmerli, Newton and Montero2007). The re-estimations of the final models with GDP/cap growth as the indicator for short-term economic performance yielded similar findings, with the reservation that the coefficient sizes dropped slightly (see Appendix, Table A2). The models including unemployment did not produce significant product terms, although the signs of the coefficients were positive (see Appendix, Table A3).
Second, different models including and excluding government fractionalization and the government’s support base were fitted. Interacting the government’s support base with economic performance did not produce statistically significant estimates. Thus government fractionalization is the variable that makes a difference, not the size of the government in terms of its support in the parliament. A three-way interaction between government fractionalization, economic performance and the government’s support base was also tested. As expected, the strength of the interaction between government fractionalization and economic performance increased with a larger government support base. This more complex model specification did not, however, alter our main findings.
Third, we controlled for alternative independent variables that characterize the difference between majoritarian and consensual systems. The findings were robust when controlling for the impacts of type of electoral system (majority, mixed and proportional), disproportionality and party system fragmentation. Fourth, a time variable measuring the period between the survey and the latest parliamentary election did not predict satisfaction with democracy. Finally we included unit fixed effects through the inclusion of dummy variables for all but one country. The results remained largely the same as regards the combined effects of government fractionalization and economic performance. Overall, the empirical findings were robust to using alternative model specifications.
Discussion and Concluding Remarks
Public perceptions on how satisfied people are with how democracy works in their country are dynamic. The direction and magnitude of these changes in citizens’ views on the functioning of the democratic process vary, however, between countries. Previous studies have implied that a certain level of satisfaction with democracy is related to institutional performance, where evaluations of economic and government performance play a crucial role. In contrast, there is mixed evidence on the impact of power-sharing systems on democratic satisfaction, although – at least in theory – more inclusive regimes should narrow the satisfaction gap between winners and losers as well as increase the general level of satisfaction.
In this study we have combined short-term economic performance with type of executive power-sharing in 31 countries. We have shown that short-term changes in economic performance and government fractionalization interactively increase or decrease levels of political support. The more fractionalized the government, the weaker the effect of economic performance on satisfaction with democracy. Thus, the political systems with broad coalition governments seem to be less sensitive to changes in the economy. In systems which have governments with a dominant party, good economic performance boosts satisfaction with democracy significantly more. Polities with one-party governments must, however, pay a higher price during the economically bad times since the support for democracy then falls more drastically than in systems with broader executive power-sharing. In sum, the results reveal that while it is mainly about the economy, that is not the only factor. Governmental power-sharing has an impact on the effect of economic conditions on support for the democratic system.
Indeed, executive power-sharing seems effectively to neutralize the impact of economic performance on satisfaction with democracy, highlighting the importance of exploring the functions that the power-sharing arrangements may have in conditioning the impact of societal setbacks on satisfaction with democracy. This result implies that reducing the relationship between economic performance and satisfaction with democracy solely to the idea of punishing or rewarding the government dangerously simplifies the role of power-sharing institutions. Eventually, this may lead to theoretically unsound inferences where satisfaction with democracy is all about governmental performance and other possible and theoretically justified dimensions of the complex concept are ignored, in particular satisfaction with the democratic process, in which the power-sharing institutions have a key role.
In this study we have only explored the general European trends, and intentionally not moved to the level of individual country cases. This is not to argue that case studies on the subject would be irrelevant – quite the contrary. Studies of individual countries should, however, focus more on the interaction of long-term and short-term trends. This would give us a clearer picture of how citizen perceptions of the political system and its institutions are contaminated by the image of political actors and processes, by partisan loyalties, scandalous behaviour of the politicians and lack of policy responsiveness. In particular, studies should take into account how these temporary fluctuations of political trust may have far-reaching consequences for the stability of democratic regimes, and how they may prevent effective implementation of policies. Furthermore, the impact of power-sharing arrangements should be studied at the level of individual countries by taking into account the history of government composition and examining whether continual exclusion from governmental power increases feelings of exclusion that may further spill over into dissatisfaction with the functioning of the whole democratic system.
APPENDIX
Table A1 Descriptive Statistics
Table A2 Robustness Tests Using Alternative Dependent Variables (including GDP/cap)
Table A3 Robustness Tests Using Alternative Dependent Variables (including unemployment)


