


1. Introduction
The rapid thinning of many glaciers in Alaska since the Little Ice Age has contributed significantly to rising sea level and is linked to climate warming (Reference Arendt, Echelmeyer, Harrison, Lingle and ValentineArendt and others, 2002). However, the link between glacier thinning/retreat and climate is complicated for glaciers that lose mass through calving (Reference ArendtArendt and others, 2006; Reference Larsen, Motyka, Arendt, Echelmeyer and GeisslerLarsen and others, 2007). Calving is an important ice-loss mechanism, and can result in larger volumes of ice lost to the glacier than would be possible through surface ablation alone (Reference Van der VeenVan der Veen, 2002). The advance–retreat cycle of a tidewater glacier may operate independently of climate warming, due to the inherent instability of calving termini and their sensitivity to subglacial topography (Reference Meier and PostMeier Post, 1987; Reference Post and MotykaPost Motyka, 1995). Calving can also play a significant role in lacustrine situations at many spatial scales, from small alpine glaciers terminating in cirque basins to large lakecalving glaciers in Patagonia (Reference Warren, Greene and GlasserWarren and others, 1995, Reference Warren, Benn, Winchester and Harrison2001; Reference Warren and AniyaWarren and Aniya, 1999; Reference Naruse and SkvarcaNaruse and Skvarca, 2000), to lakes surrounding the Laurentide ice sheet at the end of the Last Glacial Maximum (Reference Cutler, Mickelson, Colgan, MacAyeal and ParizekCutler and others, 2001). It is not uncommon for proglacial lakes to form at the termini of glaciers as they retreat through overdeepened channels formed by glacier erosion (Reference Warren and AniyaWarren and Aniya, 1999). These proglacial lakes can then modify glacier behavior by increasing calving and accelerating terminus retreat (Reference Funk and RöthlisbergerFunk and Röthlisberger, 1989; Reference Warren and AniyaWarren and Aniya, 1999). Mendenhall Glacier provides an opportunity to study the terminus dynamics of a rapidly receding glacier as it approaches the probable end of its lake-calving phase.
The calving dynamics of tidewater glaciers have received much attention because the stability of these glaciers is important for sea-level rise (Reference Arendt, Echelmeyer, Harrison, Lingle and ValentineArendt and others, 2002; Reference O’Neel, Echelmeyer and MotykaO’Neel and others, 2003; Reference Rignot, Braaten, Gogineni, Krabill and McConnellRignot and others, 2004). Much less is known about lacustrine calving systems, even though the number of such systems is growing as glaciers worldwide continue to shrink. Some lake-calving glaciers lose mass mostly through surface ablation; calving mainly affects terminus geometry and retreat rate on sub-decadal timescales. Others, for example some large lake-calving glaciers in Patagonia terminating in deep water, lose more mass through calving, similar to many tidewater glaciers (Reference VenterisVenteris, 1999).
Investigations of calving behavior at stable tidewater glaciers have shown that there is a linear correlation between annual calving rate and water depth at the terminus (Reference Brown, Meier and PostBrown and others, 1982), although the details of this relationship are not well understood. In general, a similar relationship holds for large lacustrine termini, but lacustrine calving rates are typically an order of magnitude lower than at tidewater termini (Reference Funk and RöthlisbergerFunk and Rothlisberger, 1989; Reference Warren, Greene and GlasserWarren and others, 1995; Reference Warren and AniyaWarren and Aniya, 1999). Reference Van der VeenVan der Veen (1996) suggested that for retreating calving glaciers the calving rate is not simply related to water depth, but to ice approaching flotation thickness. He proposed a buoyancy-driven mechanism for calving in which ice thickness and water depth control the terminus position. Here, if surface melting and/or longitudinal extension of the glacier sufficiently thins the ice, the terminus calves back until it achieves a critical thickness, which may be up to 50 m in excess of flotation for some temperate tidewater glaciers. An increase in the calving rate results from thinning of the glacier and does not necessarily require retreat into even deeper water.
Reference Meier and PostMeier and Post (1987) state that, ‘no temperate tidewater glaciers have floating termini, except perhaps locally and temporarily’. When parts of a tidewater terminus do reach flotation it is not sustained and calving results. However, some retreating lake-terminating glaciers may achieve buoyancy for longer periods (Reference Naruse and SkvarcaNaruse and Skvarca, 2000; Reference Warren, Benn, Winchester and HarrisonWarren and others, 2001). Reference Van der VeenVan der Veen (2002) argued that lacustrine glaciers may become locally buoyant but not achieve flotation, if surrounding ice has the tensile strength to accommodate the buoyant forces. This proposal has led to the following theory of buoyancy-driven lacustrine calving proposed by Reference Warren, Benn, Winchester and HarrisonWarren and others (2001). Thinning of the terminus subjects ice to buoyant (upward) forces. If bending stresses are not accommodated by deformation, tensile stress at the base of the grounded ice tongue may form basal crevasses. Their calculations assume that the ice tongue remains grounded, although they suggest that in some cases the buoyant stresses may be partially accommodated by ice creep. If so, this could allow a floating terminus to be sustained despite its apparent instability. A situation such as this appears to have developed at Mendenhall Glacier between 2002 and 2004. The evidence for this condition and its causes are the subject of this paper.
2. Glacier Setting, Description and History
Mendenhall Glacier lies on the western (maritime) side of the northern Coast Mountains (Fig. 1a), in southeastern Alaska, USA. It is 22 km long, flowing from an ice divide at 1600 m a.s.l. to its terminus in Mendenhall Lake at 20 m a.s.l. The glacier has been in recession since the end of the Little Ice Age in the late 18th century. The proglacial lake began forming in the early 1930s. Reference Motyka, O’Neel, Connor and EchelmeyerMotyka and others (2002) have documented substantial mass wastage and negative mass balances at Mendenhall during the past approximately 50 years, with an estimated volume loss of 5.5 km3 since 1948. The lower glacier has thinned by more than 200 m since 1909 and thinning has accelerated to over 2 m a−1 in the late 20th century. Likewise, since 1909 the terminus has retreated approximately 3 km; the most rapid recession has occurred during two periods, one in the mid- 1940s and the second from the late 1990s to the present. Reference Motyka, O’Neel, Connor and EchelmeyerMotyka and others (2002) have linked 20th-century recession to an approximately 1.6°C increase in mean annual air temperature since 1943. However, the rapid wastage of Mendenhall is attributed to two factors: (i) negative mass balance due to climate warming and (ii) retreat driven by calving (periods of rapid recession have corresponded to periods of increased lacustrine calving).

Fig. 1. The study area is the terminus of Mendenhall Glacier in southeast Alaska. (a) The 1948 outline and 2005 terminus position are shown. Grey squares mark mass-balance sites, arrows indicate annual velocities, and the dashed line shows the approximate center line of the main tributaries. (b) Terminus positions from 1948 and 1982 are shown for reference, and recent terminus positions show rapid retreat of the calving terminus between 2002 and 2005. Black squares mark data collection sites.
As ice thinned, the majority of the ice flow was diverted eastward by the bedrock topography into the lake (Fig. 1b). (Hereafter we will use ‘terminus’ to refer only to the lacustrine part.) Radio-echo sounding (RES) profiles near the 2000 terminus position located glacier bed elevations below sea level and an overdeepening behind the eastern side of the lacustrine terminus. Reference Motyka, O’Neel, Connor and EchelmeyerMotyka and others (2002) predicted that retreat into deeper water would leave the lacustrine terminus increasingly vulnerable to calving, possibly accelerating the rate of retreat.
Since 2000, we have continued to observe Mendenhall Glacier and noted that the lacustrine terminus was becoming increasingly unstable. We focus on the terminus dynamics of Mendenhall Glacier, within the larger context of glacier-wide behavior. In particular, we focus on changes in terminus geometry, ice flow and calving rate, beginning in 2000 and culminating in summer 2005. Mendenhall Glacier has given us a slow-motion picture of dynamic and hydrological factors affecting a calving front, including accumulated stresses leading to deformation of the terminus, and eventual failure through large-scale (relative to the size of the glacier) calving events.
3. Methods
3.1. Surface mass balance
In order to assess glacier thinning and its causes, particularly at the terminus, glacier mass balance has been intermittently measured since 1998 (Reference Motyka, O’Neel, Connor and EchelmeyerMotyka and others, 2002), following the glaciological method described by Reference Østrem and BrugmanØstrem and Brugman (1991). The balance year was taken to be from 1 September to 31 August. During 2004, summer ablation (1 May to 31 August) was also measured, mainly at the terminus with an array of ablation wires. Six of these markers in the ablation area were remeasured in 2005. The equilibriumline altitude (ELA) was also estimated for balance years 2003 and 2004. An ablation meter, which measures surface melt by means of a pressure transducer drilled into the glacier (Fig. 1b). Surface melt was recorded at 3 hour intervals over a 2 month period in summer 2004.
3.2. Ice motion
We measured surface velocities at mass-balance and motion markers (Fig. 1a) using repeat surveys with differential global positioning system (DGPS) with positional accuracy of ±5 cm. In 2002, additional markers were placed on the ice to measure horizontal velocities near the calving front; nine additional velocity markers were placed on the lower glacier in May 2004. All of these markers were surveyed two or three times in early May and re-surveyed in mid-June 2004. Only one of the May 2004 markers survived to be resurveyed in late August 2004. Velocities are accurate to ±0.2 m a−1 at mass-balance markers and to ±0.5 m a−1 at surface motion markers. We calculated strain rates using triangular grids of markers on the eastern terminus. The timing of repeat surveys at different markers only allowed us to calculate strains for the period 5 May to 9 June 2004.
A semi-permanent global positioning system (GPS) receiver was established on the eastern terminus in January 2004 (Fig. 1b). The GPS antenna was mounted on three poles drilled into the ice. The station was positioned approximately 100 m behind the calving front. The GPS recorded data at 30 s intervals, with gaps due to periodic equipment failures. A base station located on the other side of Mendenhall Lake was operating simultaneously. These data were post-processed in 30 min bins to obtain differentially corrected positions. The error in each 30 min position is estimated at ±1 cm or better horizontal and ±2 cm or better vertical. We used only 12 and 24 hour mean positions, since the difference between 30 minute positions is within the error.
3.3. Terminus positions and geometry
Terminus geometry, important for understanding calving dynamics, was determined in several ways. The first method utilized vertical aerial photos acquired on 24 August 2004 and 9 September 2005, to develop digital terrain models (DTMs) and orthorectified mosaics using standard digital photogrammetric techniques. Elevation accuracy of the DTMs is estimated to be ±2 m based on comparison of surveyed bedrock and glacier points (the latter corrected for ablation) to the DTM. Several surveys of the terminus position were also conducted from a boat on Mendenhall Lake using DGPS. While the DGPS positions are accurate to within about 1 m, the boat could only follow the calving front to within about 5 m.
Information on terminus position was also obtained utilizing a time-lapse camera. Between 29 February and 8 August 2004, oblique photographs were acquired once per day from bedrock adjacent to the glacier terminus (Fig. 1b). Using bedrock control points, each image was two-dimensionally orthorectified according to methods described by Reference Krimmel and RasmussenKrimmel and Rasmussen (1986) and Reference Harrison, Echelmeyer, Cosgrove and RaymondHarrison and others (1992). The 2004 photos were then analyzed to obtain daily terminus positions which are accurate to ±5 m (Reference BoyceBoyce, 2006). Since day-to-day changes were typically minor, we mainly used the daily terminus positions to calculate the change in area during large, discrete calving events.
We also used kinematic GPS to survey the surface topography of the eastern side of the terminus on 27 August 2002 and 10 January 2004. The surveys covered the area from near the calving front to 150 m up-glacier. These ice-surface data are accurate to about 1 m and were used to construct a cross-section of the terminus. Additionally, center-line profiles of the glacier were acquired by an airborne laser altimetry system (as described in Reference EchelmeyerEchelmeyer and others, 1996) on 31 August 2000. Elevations were determined every 1.5 m along the profiles with an accuracy of 0.1–0.3 m.
Together with the DTM created from the 2005 photogrammetry, these data were used to quantify the amount of thinning that has occurred over the lower glacier between 2000 and 2005. First we differenced the 2005 and 2004 DTMs to determine surface elevation change on a 10 m grid of the lower glacier (below about 250 m a.s.l. as discussed above). Second, the 2004 and 2005 DTMs were used to determine surface elevations at the 2000 altimetry profile points. Finally, we used DGPS ice-surface data between August 2002 and May 2004 to determine changes very close to the calving front. This final method yielded only a rough approximation of thinning, since the surveyed areas and points did not overlap in all cases.
3.4. Bathymetry
Because water depth and ice thickness are important in understanding terminus calving dynamics, we conducted post-retreat bathymetric surveys to assess both at the calving face. Lake bathymetry was measured using an acoustic depth sounder, with a transducer mounted on a small boat. We used a 1 kW transducer with a narrow beam (6°). The system was calibrated in situ against known water depths. The estimated accuracy of raw water-depth measurements is in the order of 0.5 m. The bathymetry data were coregistered and logged with GPS data at 5 s intervals. Postprocessing against a local base station provided positional accuracy of ±1 m or better. Raw water-depth data were then referenced to the zero height level on the United States Geological Survey (USGS) Mendenhall Lake gauging staff (http://waterdata.usgs.gov/ak/nwis).
Previous work had mapped lake bathymetry up to the 2000 terminus position (Reference Motyka, O’Neel, Connor and EchelmeyerMotyka and others, 2002). Soundings obtained in 2002 and 2004 concentrated on the new proglacial lake area created by glacier recession. Bathymetry acquired soon after retreat is assumed to measure the former glacier bed. A comparison of glacier surface elevations (acquired by DGPS survey) with bathymetry yields the maximum possible ice thickness, assuming a completely grounded terminus.
3.5. Temperatures and water levels
A weather station was placed within 300 m of the terminus, and air temperature was recorded at hourly intervals approximately 1.5 m above the ice surface. Precipitation events were recorded at the same site using a tipping-bucket rain gauge. Water temperatures in Mendenhall Lake were measured at a mooring near the eastern side of the terminus, in approximately 90 m water. Sensors fixed at 40, 60 and 80 m depths recorded hourly temperatures between May and August 2004. Temperatures are accurate to ±0.2°C.
Daily mean water level in Mendenhall Lake was recorded by the USGS at a permanent gauging station (site ID 15052500) in Mendenhall Lake. We use the notation ‘LGR’ to denote heights measured with respect to the ‘lake gauge reference’. The gauge datum is 14.836 m referenced to Geoid96 (Alaska), measured by DGPS survey.
4. Results
4.1. Surface mass balance
The annual mass-balance record from this study and from Reference Motyka, O’Neel, Connor and EchelmeyerMotyka and others (2002) is summarized in Figure 2 and Table 1. Few mass-balance data were collected in 1999 or 2001, so no data are presented for those years. Except for balance year 2000, the available mass balance is strongly negative. The values given are reference surface balances, calculated using the area–altitude distribution from the 1948 USGS 1 : 63 260 scale map as a ‘reference surface’ (Reference Elsberg, Harrison, Echelmeyer and KrimmelElsberg and others, 2001), which is the more climatically relevant mass balance. These values do not include the fraction of ice loss due to calving. The estimated error in glacier-wide balances is ±0.3 m a−1 w.e. The ELA, estimated from airborne and ground-based observations, ranged from 1370 m a.s.l. in 2003 to 1250 m a.s.l. in 2004, ±50 m.

Fig. 2. Annual mass balance vs elevation for Mendenhall Glacier. Balance years 1998 (crosses, dotted line) and 2000 (grey squares, dashed line) are modified from Reference Motyka, O’Neel, Connor and EchelmeyerMotyka and others (2002); balance years 2003 (triangles, black dashed line), 2004 (grey circles, solid line) and 2005 (black stars, solid line) are unpublished data. Visual estimates of ELAs are plotted as points with 0 m balance.
Table 1. Volume change (ΔV) corrected to reference surface, and reference surface mass balance ![]() Calculations for 1998 and 2000 are based on field data from Reference Motyka, O’Neel, Connor and EchelmeyerMotyka and others (2002)
Calculations for 1998 and 2000 are based on field data from Reference Motyka, O’Neel, Connor and EchelmeyerMotyka and others (2002)

All balance curves from 2000 to 2005 have reversed slopes at the lowest elevations, indicating that maximum ablation does not occur in the eastern calving terminus but rather a bit higher near ‘Bench’, perhaps because of shading and debris cover lower on the glacier. Maximum ablation rates were −12.3, −13.3 and −14.4 m a−1 w.e. for balance years 2003, 2004 and 2005, respectively, all measured at 100 m a.s.l. In contrast, the summer ablation at 100 m a.s.l. measured −9.3, −11.5 and −11.3 m w.e. for balance years 2003, 2004 and 2005, respectively, accounting for an average of 80% of total annual ablation. Ablation meter records show a cumulative surface loss of −9.2 m w.e. over a 77 day period starting on 9 May 2004, or an average daily ablation of 12 cm. Daily ablation varied between 2 and 24 cm over this period. Cumulative ablation data in Figure 3b show at least 1.9 m w.e. of ablation occurred during May 2004.

Fig. 3. (a) A comparison of daily mean lake level and surface ice velocities (measured intermittently) between January and May 2004. Segments of dashed line represent interpolation over days when the GPS was operating <12 hours. Both velocity components reach peak values during May (shaded area). (b) Total vertical displacement of the continuous GPS (black dots), referenced to its initial position. The station was reset in early April and again in early May. Daily mean lake level (solid line) and cumulative ablation (grey diamonds) are shown where data are available.
4.2. Ice flow at the terminus
Surface velocities in the eastern part of the terminus range from 30–50 m a−1 in winter to 60–70 m a−1 in summer. Speeds are higher at the center of the terminus, reaching 110 m a−1 in summer. Velocities in the eastern terminus area were measured at least six times between the summers of 2002 and 2004, with no apparent trends (except seasonal variations) in the magnitude of the velocities. We focus on velocity measurements made near the terminus between 2002 and 2004, the period of interest during which the calving front was apparently being uplifted (flow field shown in Fig. 4a). The overall direction of flow was toward the eastern margin. Most velocity vectors are roughly parallel to contours in the subglacial topography rather than exhibiting a relationship to surface slopes (as would be expected for deformational ice flow). Over the 2 year period, there was a trend toward more easterly motion, as the orientation of flow vectors approached the strike of the bedrock trough (approximately 145°).

Fig. 4. (a) Changes in ice flow at the eastern terminus of Mendenhall Glacier, 2002–04, with terminus positions shown for reference. Velocities are distinguished by balance year for easier comparison. The bedrock trough axis is approximately 145°. (b) Extensional strain rates measured at triangles S1 and S2 between early May and early June 2004 were consistent with the presence of large, transverse crevasses in this terminus area.
Strain rates were calculated from horizontal velocities measured on the eastern terminus between May and June 2004 (Fig. 4b). Results showed primarily extensional strain rates: 0.25 a−1 for strain triangle S1, near the position of the continuous GPS, and 0.16 a−1 for S2, close to the highest part of the calving front. These strains were oriented northwest–southeast, in the direction of glacier flow. Calculated strain rates near the eastern margin suggest compression there, but the uncertainties are large. Crevasse patterns on the eastern terminus were in agreement with extensional strain rates calculated at S1 and S2 and compression near the eastern margin. Extensional flow at triangles S1 and S2 corresponded to thinning rates of about 4 cm d−1.
The semi-permanent DGPS station has yielded a record of ice motion near the calving terminus in spring and early summer 2004 (Fig. 3a and b). The record is intermittent due to equipment failure or meltout of the station. Motion was divided into a vertical component and a longitudinal component. The overall trend was an increase in along-flowline velocity through the spring of 2004, from an average of 51 m a−1 in January to 69 m a−1 averaged over May. The overall vertical motion was upward, and vertical velocities were also highest in May. Daily lake levels during the same period followed the same upward trend as the ice-motion data. There was a slight increase in mean daily lake level during 13–14 May, and a corresponding increase in vertical velocity which appears to track the lake level curve. A slight increase in longitudinal velocity also occurred at about the same time, but is more variable and weaker than the change in vertical velocity. We note that lake ice adjacent to the terminus broke up on about 14 April, a period for which there are no GPS data.
4.3. Terminus geometry
Post-retreat bathymetry (Fig. 5) showed an 80–90 m deep sublacustrine basin trending up-glacier beneath the eastern side of the terminus. The most significant changes in terminus geometry occurred over this trough. Here we summarize the changes in the surface topography of the terminus between 2000 and May 2004.

Fig. 5. Post-retreat bathymetry shows the former bed geometry beneath the eastern terminus. The transect A–A′ marks the location of the cross-section shown in Figure 6. Data are in UTM 8N, WGS84, height above ellipsoid. Depths are referenced to 0 m on the USGS lake gauge.
The longitudinal cross-section in Figure 6 shows the former geometry of the lacustrine terminus along the profile A–A′ (Fig. 5), which runs along the eastern side of the deep subglacial trough. It was chosen to maximize the density of geodetic ice-surface data for the cross-section. All elevations are referenced to LGR. Note that terminus positions only indicate the position of the calving front along A–A′. Between September 1999 and May 2004 the eastern terminus extended further than the western side. We define flotation thickness, h f, to express how close ice is to achieving flotation:

Fig. 6. Cross-section A–A′ (Fig. 5) of the lacustrine terminus of Mendenhall Glacier. Vertical exaggeration is 3×. Vertical reference is LGR, horizontal reference is UTM NAD83. The lake level of 0.9 m on 9 May 2004 is plotted. (a) Location of the semi-permanent GPS on 5 May 2004 (triangle), bed profile from 2004–05 bathymetry, flotation thickness (thick grey line) based on 9 May 2004 water levels. The ice surface from May 2004 depicts the large depression behind the uplifted calving front. (b) Ice-surface data from ground-based surveys in 2002–04. Solid lines (August 2002, January 2004, May 2004) are surface profiles obtained from gridded GPS survey data. Dashed lines are interpolated ice surfaces between sparse point data (March 2003, August 2003). Terminus coverage is patchy for 2002 and 2003.
where d is water depth, ρ w is water density (1000 kg m−3) and ρ i is the density of ice (917 kg m−3).
In 2000, the surface of the glacier was relatively flat for several hundred meters up-glacier from the calving front. Our geodetic ice-surface data from August 2002 showed that ice thickness was still slightly greater than flotation thickness. The height of the calving front was visually estimated at 10.5 m with respect to LGR, while geodetic ice-surface elevations of 8–10 m were measured 175–250 m behind the calving front, indicating that the eastern terminus was relatively flat. In the area roughly 200 m from the calving front, ice was then at approximately 95–98% of flotation.
A dramatic change in surface geometry began occurring in 2003. Our March 2003 geodetic data showed the beginning of a depression behind the calving front. Our August 2003 GPS survey showed that this depression had dropped an additional 5 m in elevation and that the base of the depression was only a few centimeters above lake level. The depression had thinned 6.4 m below the thickness at which flotation would have been possible (as determined from Equation (1)). The height of the ice cliff along the eastern side of the terminus was about 10 m above lake level, and the ice surface sloped down toward the depression. A few large transverse crevasses, some water-filled, were observed in the area, although the surface was relatively smooth and easily navigable.
By May 2004, the maximum height of the ice cliff was 12.5 m above lake level, located over the deepest part of the proglacial lake (Fig. 7). Cliff height was <4 m along the eastern face and similarly toward the central part of the terminus. The surface depression behind the cliff was then below lake level. The ice cliff somewhat obscures the depression in Figure 7, but it and the reversed slopes behind the calving front can still be seen. Silty ponds in the depression appeared to be hydraulically connected to the lake.

Fig. 7. Oblique view of the eastern terminus of Mendenhall Glacier in May 2004. The calving front is approximately 12 m above lake level, and the large depression lies 100–200 m behind the calving front. Arched thermo-erosional notches are visible on the ice cliff.
Assuming that ice is grounded below the lowest point of the depression (150 m along profile A–A′ in Fig. 6), then the ice thickness there would have been about 70 m. The velocity field and presence of transverse crevasses throughout the eastern terminus are indicative of extensional flow in this area. Thus there is no mechanism for ice thickening down-glacier from the depression. It is therefore reasonable to assume that ice thickness between the depression and the calving front is no greater than the thickness under the depression. Figure 6 indicates that about 150 m of ice behind the May 2004 calving front was not grounded. Comparison of calving-front height and surface-depression elevation indicates this process may have begun in summer 2002 closer to the calving front, although ice at the depression did not reach flotation until between August 2002 and March 2003.
4.4. Terminus thinning
Comparison of the 2004 DTM with 2000 altimetry profiles showed significant thinning of the lower glacier, 5.8 m a−1, averaged along the center-line profile. The 2000 altimetry profile data did not transect the eastern side of the terminus so we are unable to compare it with later ground-based or photogrammetric profiles of the depression and elevated ice front. By differencing the August 2004 and September 2005 DTMs, we obtained a volume change below 250 m a.s.l. (due to surface lowering) of −1.0 × 10⁷ m3 a−1 w.e., or an average thinning of ice of 11.5 m a−1. Actual surface lowering measured by this method ranged from 10 to 25 m a−1 in the region between 150 m a.s.l. and the terminus, with the greatest thinning occurring along the western margin of the glacier and along the eastern margin approximately 500 m from the August 2004 terminus. Lower rates were measured in the far eastern part of the terminus, which is extensively debris-covered and may be affected by topographic shading and by horizontal ice compression. We note that these thinning rates are comparable in magnitude to ablation rates for these elevations, indicating that ice flux into the terminus was far too small to replenish the ice losses due to ablation.
4.5. Proglacial lake environment
Mendenhall Lake undergoes seasonal fluctuations in water level, with minima occurring in winter and maxima in summer (Fig. 8). The annual change was typically 1.5–2.0 m during the study period. Fluctuations of 0.5 m over several days were common from January to July. During late summer and fall, rapid rises in lake level of up to 1 m occurred.

Fig. 8. Comparison of lake levels to heights of thermal notches, 2002–04. Water levels (grey dots), estimated heights of thermo-erosional notches (diamonds), and surveyed ice-surface height in the terminus depression (circles) are all shown relative to a fixed vertical reference, LGR. Dashed lines indicate consecutive observations of the same melt feature.
Lake temperatures display an overall cooling trend, from 3°C to 1°C, during the summer of 2004, with a few significant excursions (Fig. 9). This is in contrast to many Alaskan tidewater glaciers (e.g. LeConte), where ocean water has an overall warming trend, driven by heating of nearsurface water in the Gulf of Alaska (Fig. 9). The temperature excursions in Mendenhall Lake are shown more prominently in Figure 10, where the temperature record is compared with water level as measured by the USGS lake gauge, air temperature and precipitation recorded at the glacier terminus weather station, and daily ablation recorded at ‘Bench’. Temperatures at 40, 60 and 80 m depth typically fluctuated in unison, with swings of 1–2°C occurring within 1 or 2 days. Strong negative excursions in water temperature generally coincided with increases in lake level, which in some cases (but not all) occurred during large precipitation events. High precipitation during 24–26 May coincided with a rise in lake level and drop in water temperature during the same period. Small precipitation events (about 10 mm d−1 or less) in early June surrounded a small rise in lake level and cooler water temperatures on 7–11 June. A larger rise in lake level and downward temperature spike on 18 June did not coincide with high precipitation, but with increased air temperature and ablation rates. The greatest short-term rise in lake level occurred in late July, following precipitation of more than 35 mm d−1 on three consecutive days of rain. During this event, water temperatures were uniform at depth.

Fig. 9. Summer water temperatures in proglacial Mendenhall Lake and LeConte fjord, 2 week running means. Water temperatures in the proglacial lake were lower and showed an opposite trend to those recorded in front of LeConte Glacier, a nearby temperate tidewater glacier (Reference Motyka, Hunter, Echelmeyer and ConnorMotyka and others, 2003).

Fig. 10. Environmental variables recorded near the terminus of Mendenhall Glacier during summer 2004. The four largest calving events (responsible for much of the 2004 retreat) are indicated by grey shaded days. (a) Lake level (solid grey line) was highly variable but generally rose through the melt season. Daily water temperatures also showed strong negative excursions and an overall cooling trend (note Fig. 9). (b) Air temperature (°C, solid line), daily ablation (cm, black dots) and precipitation (mm, grey bars) over the same time period.
Between downward spikes, the 40 m temperature is fractionally cooler than the 80 m temperature. Since the density minimum is at 4°C, this is compatible with stable stratification. During four large downward spikes recorded during May and June, the coldest water temperatures are recorded at the greatest depths. This is consistent with meltwater entering the lake near the glacier bed and undergoing some mixing in the lake. Drainage events from several marginal lakes along Mendenhall Glacier may also have resulted in cold water pulses into Mendenhall Lake between May and July 2004.
4.6. Thermo-erosional notches
Horizontal notches in the calving front may be formed when rates of melting at the waterline are higher than subaerial or subaqueous rates of melting. The rates at which notches melt back into the calving face vary considerably, as they depend on water temperature and circulation and water-level fluctuations, as well as additional factors (Reference Bøggild, Olesen, Ahlstrøm and JørgensenRöhl, 2006). If water level is constant, Röhl gives a typical vertical notch width of 0.2–0.3 m. Lake level variations may widen a notch vertically or reset the position of the notch formation process (Reference RöhlRöhl, 2006). We note that this formation process is only capable of generating a horizontal notch, or set of parallel horizontal notches, within the range of water-level variations.
We observed thermo-erosional notches approximately 1.5 m above lake level along the eastern half of the terminus on 24 June 2002. Subsequent observations on 31 August 2003 also found horizontal thermal notches approximately 1.5 m above lake level. By 4 May 2004, thermo-erosional notches had risen 3 m above the lake surface near the highest part of the ice cliff (Fig. 8, dark grey diamonds). These former waterlines were arcuate in shape and sloped down to the lake surface in both directions (Fig. 7), indicative of deformation. Near the center of the terminus, a series of three to four thermal notches paralleling the lake surface was observed on 6 May 2004. The highest of these was approximately 1.25 m above lake level.
In order to place thermal notch and ice-surface depression heights within a fixed vertical reference frame, we used daily mean lake level records to determine the elevation of each feature relative to 0 m on the lake gauge (LGR). Figure 8 shows that elevations of thermal notches were substantially greater than lake level from late 2003 through to summer 2004. The height of the highest notch, measured during February and May of 2004, increased 0.8 m over 67 days. During the same period, lake level rise was 0.3 m and surface ablation was approximately 1.6 mw.e. Three small thermal notches observed during May–July 2004 (Fig. 8, black diamonds) were also elevated by up to 4 cm d−1 relative to a fixed reference, with a concurrent rise in lake level of only 1 cm d−1. Surface ablation over the same period averaged 8 cm d−1 w.e. The best example of a rising thermo-erosional notch occurred during July 2004, when one series of observed notches (Fig. 8, light grey diamonds) was uplifted by approximately 1.6 m over 3 weeks. Lake level rise over the same period was only 0.05 m, while surface ablation was 3.2 m w.e.
Table 2 summarizes lake level change, surface ablation and extensional thinning for three particular periods of notch rise. Extensional thinning is based on strain-rate measurements in May–June 2004, a period of accelerating velocities as documented by the continuous GPS. Therefore we have not used these values for the earlier notch observations. Table 2 also presents the calculated isostatic uplift expected from buoyancy as well as the actual or measured notch uplift. Note that both calculated and measured uplift values refer to uplift of the notch within a fixed reference frame (LGR), and not the change in freeboard height.
Table 2. Three cases of observed thermo-erosional notch uplift in 2004 (see Fig. 8). Three factors leading to increased buoyancy (lake level rise, ablation and extensional thinning calculated from 5 May to 9 June 2004) are combined to calculate the predicted isostatic uplift for freely floating ice. The residual isostatic uplift, or difference between calculated isostatic uplift and measured notch rise, is unaccommodated buoyant stress on the terminus

4.7. Terminus break-up
Break-up of the eastern terminus began in May 2004 (Fig. 11). In the weeks preceding terminus break-up, time-lapse photographs showed that transverse crevasses were opening up where failure eventually occurred. Between 25 May and 23 July, four large calving events caused the eastern terminus to retreat more than 200 m, approximately twice the maximum annual retreat previously observed at Mendenhall Glacier. The largest two calving events produced tabular icebergs roughly 70 × 200 m in size.
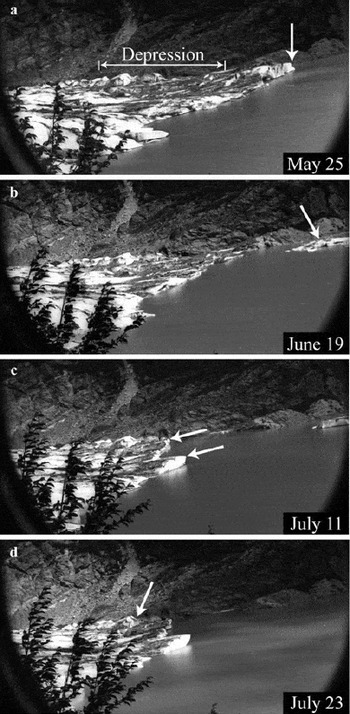
Fig. 11. Time-lapse photographs acquired at Mendenhall Glacier during spring and summer 2004. View is from the camera marked in Figure 1b, opposite from Figure 7. (a) 25 May. Arrow marks location of first large calving event. Note depression and reversed slopes behind calving front. (b) 19 June. Arrow marks the iceberg from 18 June. (c) 11 July. Arrows mark upwarping sections of the calving front. (d) 23 July. Arrow marks hinge line where failure occurs.
The first event, on 25 May, removed a large section of the ice cliff at the eastern side of the terminus (Fig. 11a), reducing lateral support for the remaining elevated calving front. Removal of this section of the ice cliff allowed the lake to inundate the ice depression behind the calving front, partially filling it with lake water. The second (and largest) event, on 18 June, removed the remaining uplifted area (Fig. 11b). The terminus retreated to a point almost halfway through the depression. The remainder of this low-lying area calved in a third event, on 10 July, resulting in the terminus retreating to the up-glacier side of the former depression (Fig. 11c). Following this event, we observed local uplift along the central and eastern parts of the terminus (Fig. 11d). The rate of uplift, measured by the rise of the thermoerosional notches marked in Figure 8 (light grey diamonds), was at least 7 cm d−1. The newly uplifted area broke off on 23 July as a large tabular iceberg.
The four large calving events during summer 2004 are marked for reference in Figure 10. The events on 25 May and 18 June coincide with slight increases in lake level and also with strong negative excursions in water temperature. The correlation suggests some hydrological connection to the timing of these two events. The 10 July calving exhibits no correlation to changes in water temperature, lake level or precipitation. The fourth event again coincides with an increase in lake level and a slight dip in water temperature. The largest short-term change in lake level and water temperature occurs in late July, after the break-up of the eastern terminus was largely complete.
4.8. Rates of retreat and calving
Terminus positions between fall 1999 and spring 2004 (Fig. 5) show that the eastern side of the calving front extended out into the lake up to 250 m further than the western half, and retreat was relatively uniform across the glacier until summer 2004. The average rate of retreat between 1997 and 2000, 66 m a−1 (Reference Motyka, O’Neel, Connor and EchelmeyerMotyka and others, 2002), is comparable to the average rate of retreat between 2000 and 2005, 58 m a−1. When short time periods are considered, the terminus has experienced quite rapid rates of retreat, up to 366 m a−1 between May and August 2004. The terminus has also experienced periods of low retreat rate, only 12 m a−1 between March 2002 and May 2004. Following the summer 2004 break-up, retreat rate between August 2004 and August 2005 was 60 m a−1.
‘Calving rate’ is defined as the difference between rate of change of terminus position and ice velocity at the terminus, and melting at the calving face is generally included implicitly in calculations of the calving rate. The amount of ice calved is expressed as a calving flux, Q C, and calculated as the difference between ice flux into the calving front, Q i, and the volume flux expressing the rate of terminus advance, Q L:
Ice flux through the terminus was estimated from surface measurements since the average velocity along a transverse surface profile is approximately equal to the mean crosssectional velocity. Reference PatersonPaterson (1994, p.272) notes that this estimate may be improved by adding a 10% correction factor. We applied this correction factor, but due to the uncertainties of this calculatin method we assumed a systematic error of ±10% in the resulting cross-sectional velocities. The glacier cross-section was constrained by bathymetry to within ±0.5 m. An estimated average ice surface of 10 ± 5 m above lake level was added to the bathymetry to obtain the cross-sectional area of the terminus.
Water depths (obtained by post-retreat bathymetry) were integrated over the change in terminus area to determine the volume of ice lost by terminus retreat. A mean crosssectional velocity of 55 m a−1 was used to estimate ice flux into the calving front. The error in change in terminus position is ±15 m. The resulting error in calving flux is ±0.06 × 10⁷m3 a−1 w.e. over the perioid March 2002–August 2005.
Changes in the retreat rate correspond to significant variations in calving flux between September 1999 and August 2004. Maximum calving flux, −1.7 × 10⁷ m3 a−1 w.e., occurred during the summer of 2004. The average calving flux between 2002 and 2005 was −0.75 × 10⁷ m3 a−1 w.e., compared with an average annual volume lost to surface melt of −15 × 107 m3 a−1 w.e. over the same period. Thus calving represented about 2.6% of the ice lost by surface melting between 2002 and 2005. As a fraction of the longterm mean annual volume change measured since 1948 by Reference Motyka, O’Neel, Connor and EchelmeyerMotyka and others (2002), calving is about 4%.
The mean water depth across the terminus between September 1999 and August 2004 was 45 m. Mean water depth varied little between 1999 (47 m) and 2004 (48 m) and was deepest between March 2002 and May 2004 (52 m). There was no correlation between mean water depth and rates of either calving or retreat.
5. Discussion
Earlier work on Mendenhall Glacier concluded that the terminus was particularly vulnerable to calving as ice thickness approached buoyancy and the terminus retreated into an overdeepening (Reference Motyka, O’Neel, Connor and EchelmeyerMotyka and others, 2002). Without shoals or bedrock rises to exert back pressure on the calving front, the terminus was in an inherently unstable position given current rates of thinning and ice flux to the terminus area. However, the position of the terminus remained relatively stable between 2002 and the summer of 2004 despite substantial thinning of ice. We discuss the various factors affecting the eastern terminus during the 2 years prior to its disintegration and the accompanying changes in ice flow and terminus geometry.
5.1. Effects of volume loss and thinning
The total volume loss at Mendenhall Glacier consists of surface ablation and calving flux. Although calving has been relatively minor when compared with total volume loss, it has still played a key role in affecting terminus dynamics. Changes in the annual mass balance at Mendenhall Glacier do not appear to impact terminus behavior over short timescales, yet long-term negative mass balances have led to the long-term downwasting of the glacier and left the terminus susceptible to large-scale calving events. The low calving:surface ablation ratio (CAR) of only 0.026 is an indication of how different Mendenhall Glacier is from tidewater calving glaciers, which may have CAR values more than two orders of magnitude higher (Reference Echelmeyer, Harrison, Clarke and BensonEchelmeyer and others, 1992).
Reference Motyka, O’Neel, Connor and EchelmeyerMotyka and others (2002) measured a thinning rate of 8 m a−1 on the lower glacier between 1995 and 2000, a trend that persisted between 2000 and 2004, then increased to 11.5 m a−1 in 2004–05. Surface lowering of the lower glacier is consistent with predictions of volume change obtained from balance flux calculations and ablation measurements (Reference BoyceBoyce, 2006). The terminus has simultaneously narrowed and downwasted, leaving a smaller lacustrine terminus increasingly close to flotation.
As terminus ice was pushed in a more easterly direction, the margin may have provided some back pressure to help stabilize the eastern terminus. In the case of Mendenhall Glacier, there is no obvious topographic rise in front of the glacier, but sufficient lateral stability may have been provided by the eastern bedrock margin. It is interesting to note that, at Mendenhall, large-scale calving during June and July 2004 followed the removal of a small section of the ice cliff closest to the eastern margin (25 May calving event).
5.2. Terminus velocities and strain rates
Recent thinning of the terminus was accompanied by a change in ice flow driven by the underlying basin geometry. As the terminus approached flotation and the surface slope became almost flat, we would expect the component of ice flow due to internal deformation to drop. At the same time, thinning of the ice would naturally lead to a decrease in effective pressure at the bed and an increase in basal sliding.
Using our terminus velocity measurements between early May and early June 2004, we found that strain rates were primarily extensional near the center line and depression, consistent with observed transverse crevasses. The calculated dynamic thinning was about 4 cm d−1. Thus we conclude that both dynamic thinning and ablation were controlling ice thickness near the center line of the terminus between 2002 and 2004. In contrast, we calculated a certain degree of compressional thickening near the eastern margin, although again we note that uncertainty is greater for this area. As terminus ice was pushed in a more easterly direction, the margin may have provided back pressure to help stabilize the eastern terminus. Again, we note that the large-scale calving during June and July 2004 followed the removal of a small section of the ice cliff closest to the eastern margin (25 May calving event).
Longitudinal and vertical velocities derived from continuous GPS data both qualitatively tracked lake level changes (Fig. 3a). Longitudinal ice flow steadily increased through spring, which we attribute to increased basal sliding caused by rising subglacial water pressure. This mechanism applies in areas upstream from the terminus, which in turn affect ice velocities at the terminus. Basal friction in the already floating area of the terminus would not have been affected, but increases in lake level and ice thinning would likely have led to upward migration of the grounding line, causing additional decoupling and greater longitudinal velocities.
Vertical velocity was more variable. In the winter months between January and mid-March 2004, it decreased as lake level dropped and snow accumulated. In May vertical velocity rose, coinciding with significant increases in ablation and water level (Fig. 3). A correlation between upward forcing and displacement would have indicated elastic bending; however, this correlation is not shown by the data. The observed correlation between upward forcing and velocity is indicative of viscous bending, suggesting that viscous deformation was the dominant mechanism over this period. Thus higher vertical velocities are attributed to increased upward forces (lake level rise and ice thinning). As we have discussed, thinning is mostly due to ablation but includes a dynamic component.
5.3. Uplift and flotation of the calving front
Evidence for the uplift of the calving front comes from observations of elevated thermal notches along the calving front, terminus geometry and measured ice motion. We have already noted the process by which thermo-erosional notches are created. Notches can be exposed above lake level in one of three ways: (i) there is a drop in lake level but the calving front remains stationary; (ii) the cliff face is uplifted, raising the notch above lake level; (iii) a combination of (i) and (ii). A comparison of notch height and lake level relative to a fixed reference frame clearly shows that the second process was largely responsible for exposed notches at Mendenhall Glacier (Fig. 8). The most extensive thermal notch (Fig. 8, dark grey diamonds) was higher than any water levels reached during the preceding year. Likewise, notches formed during summer 2004 were higher than any water levels reached since summer 2003. We considered two possible causal mechanisms for the reversed slopes behind the terminus and uplifted ice cliff that existed prior to the summer 2004 break-up:
-
1. Ice flowing through an overdeepening (below the depression) could be forced upward by subglacial topography, elevating the terminus locally. However, post-retreat bathymetric surveys conclusively show that the area of maximum upward displacement along the calving front was directly over a deep trough and that there was no topographic rise.
-
2. The lower glacier had simultaneously thinned and retreated into a deep basin, where it eventually reached flotation. Buoyant forces caused upwarping of the glacier tongue, with uplift driven by a combination of lake level rise and glacier thinning.
The second mechanism is consistent with post-retreat bathymetry, terminus geometry and changing rates of thermal notch uplift.
Comparison of ice surface elevations with post-retreat bathymetry shows that between 2003 and 2004 the eastern terminus reached flotation between the depression and the calving front. Our observations of thermo-erosional notches indicate that the ice cliff started upwarping sometime after August 2002, prior to the development of the surface depression. This uplift was driven by buoyant forces induced by ice thinning and lake level rise. Both dynamic processes and ablation were responsible for the observed thinning rates, which averaged 8–11 m a−1 in the terminus region, but were as much as 25 m a−1 at some localities. It is likely that the extent of the floating area varied seasonally as buoyant forces fluctuated as a result of seasonal variations in ice-flow dynamics and in ablation. The surface depression behind the calving front had thinned to below flotation thickness by August 2003 and perhaps as early as March 2003, although the data are sparse from this early survey. Although ice thickness there approached lake level, we believe ice was being held below flotation by torque exerted by the ice in front and by the tensile strength of grounded ice to the sides and up-glacier (Reference Van der VeenVan der Veen, 2002).
Following initial calving events in summer 2004 and removal of the floating terminus, ice in the depressed area was immediately subjected to upward buoyant forces. Reference Warren, Benn, Winchester and HarrisonWarren and others (2001) have stated that buoyant forcing causes high basal tensile stresses which lead to basal crevassing, unless they are accommodated by ice creep. At Mendenhall Glacier we have a clear example of deformation rather than immediate calving. Without the support of the uplifted front and ice at the margins, the ice that was formerly held down upwarped at a rapid rate, lifting thermoerosional notches up to 1.6 m over a 3 week period (Fig. 8, grey diamonds). However, not all the buoyant stress was realized as upwarping. In Table 2, we calculated the expected isostatic uplift of the ice cliff subjected to the recorded change in water level and thinning rates estimated from extension and ablation, for three different periods during 2004. Our estimates for extensional thinning come from our analyses (section 4.2) of velocity vectors for early May to early June and therefore apply directly to the second period in Table 2. It is reasonable to assume similar extensional thinning rates for the later summer period; it may have been somewhat less for the first interval. In all three cases, the measured uplift indicates that only about 50% of the full calculated isostatic upwarping had been realized. This indicates that the timescale of changes during each period is such that viscous deformation has not been able to reduce buoyant forces fully.
Additional evidence for buoyant upwarping comes from the record of vertical displacement on the continuous GPS. We find that it is both upward and monotonic into April (Fig. 3b), apparently because the GPS unit was moving upslope as it approached the calving front. Vertical displacement then increased significantly during May, far exceeding the simultaneous rise in lake level but closely tracking the onset of high summer ablation rates (Fig. 3b). While lake levels rose during May–July 2004, the measured notch rise (see Table 2) exceeded the increase in water level. This is to be expected since water level is not the only factor affecting vertical displacement of the terminus. However, we believe that the sensitivity of ice velocities to lake level (see Fig. 3a) is evidence that ice from the depression to the calving face was ungrounded during spring and summer 2004 up to 150 m behind the face, the initial location of the GPS station.
5.4. Forces affecting buoyant upwarping
We have substantial evidence for upward deformation during a period of relative stability (low retreat rates) between 2002 and May 2004. Apparently, there are circumstances under which such buoyant forces do not lead to immediate calving even in the case of temperate ice. As Reference Warren, Benn, Winchester and HarrisonWarren and others (2001) have suggested, bending stresses can be partially accommodated by deformation, or upwarping as we have seen in the case of Mendenhall Glacier. To investigate these particular circumstances, we consider the different factors that may change buoyant forces acting on the terminus.
Dominant controls on buoyant forcing are changes in water level or changes in ice thickness resulting in buoyant torque acting on the glacier tongue. Unlike the high-frequency variations in a tidally forced system, the largest amplitude changes in a lacustrine environment vary over seasonal or annual timescales. Lake levels rise during the melt season and fall during the winter months over a range of 1.5–2.0 m at Mendenhall Glacier. Survey and mass-balance data indicate that the terminus of Mendenhall Glacier undergoes substantial seasonal fluctuations in its thinning rate, with average summer loss of 10.7 m w.e. compared to average winter loss of only 2.6 m w.e. between 2003 and 2005 (at 100 m a.s.l.). Over shorter periods between September and April, winter accumulation results in temporarily positive balance rates and slight thickening. Daily ablation rates of 10–20 cm d−1 w.e. were recorded near the terminus between May and July 2004, while the maximum daily rise in lake level over the same period was only 2.4 cm d−1 and dynamic thinning rates were about 4 cm d−1. Therefore ablation-induced thinning is clearly the most important factor affecting the buoyancy of the terminus on seasonal or annual timescales. On timescales of only a few days, both thinning and water-level changes may be critical in exceeding the amount of buoyant force the ice is capable of withstanding, thereby triggering calving events.
A critical factor in buoyancy-driven lacustrine calving is the timescale of perturbations. Slow perturbations can result in viscoelastic deformation rather than calving failure (Reference BoyceBoyce, 2006). During the summer, elevated lake levels and thinning rates cause upward forcing and uplift of the calving front toward hydrostatic equilibrium. Subsequent cycles of upward forcing and deflection result in higher basal tensile stresses than those reached during the first melt season. If the same amount of deformation were achieved instantly (elastically), stresses would be much higher, probably resulting in break-up of the glacier tongue. However, cyclic deformation may still result in damage to the ice, but on a reduced scale. Accumulated damage would then lower the tensile strength. High-amplitude perturbations may not necessarily lead to terminus break-up if they occur slowly on annual or seasonal timescales. Thus a lacustrine glacier tongue could remain locally at flotation for a much longer period than previously supposed.
We therefore propose that the partial flotation of the eastern terminus that occurred between 2002 and 2004 was stable because ice creep accommodated stresses and lateral support was provided by grounded ice near the bedrock margins and up-glacier. After almost 2 years of partial flotation and continued thinning, the ice weakened and instability of the terminus reached a critical level during the 2004 melt season. The terminus of Mendenhall Glacier was then susceptible to short-term perturbations. These shortterm perturbations were sub-meter increases in lake level over a period of several days to several weeks, rapid summer ablation and an abrupt removal of adjacent ice, thereby decreasing the lateral stability of the glacier tongue. We believe these mechanisms triggered the calving events observed at Mendenhall Glacier during summer 2004.
5.5. Effect of Mendenhall Lake on calving
It has been suggested that subaqueous melting of the ice face is important in the calving of tidewater glaciers (Reference Motyka, Hunter, Echelmeyer and ConnorMotyka and others, 2003), where warm ocean water and thermohaline convection near the terminus leads to substantial melting of ice. Water temperatures at Mendenhall Lake showed that the lake became thermally stratified through the summer of 2004, and that pulses of meltwater or runoff entering from the glacier did not greatly disturb the water column. No evidence for thermal convection was found. Due to the cooler temperatures and lack of convection, we conclude that sublacustrine melting was not an important process at Mendenhall Glacier during 2004. Lacustrine glaciers are thus quite unlike tidewater glaciers with regard to the importance of subaqueous melting (Reference Motyka, Hunter, Echelmeyer and ConnorMotyka and others, 2003).
Calving events are infrequent, and most calving losses during summer 2004 were as large tabular icebergs released in discrete calving events. Fluctuations in water level, water temperature and precipitation were correlated with the timing of some calving events at Mendenhall Glacier. As we have discussed, although the floating terminus was able to withstand seasonal variations in lake level of 1.5–2.0 m (as well as thinning of 11.5 m a−1), by 2004 it was no longer capable of withstanding relatively small increases in lake level or ablation occurring over short periods. High seasonal ablation rates of up to 20 cm d−1 (which when uncompensated by ice flux from up-glacier lead to rapid thinning) also enhanced the likelihood of calving.
We now consider the possible triggers for each of the four large calving events. The calving on 25 May 2004 may have resulted from rapidly increased buoyant stresses caused by an approximate 30 cm rise in lake level over 24–26 May 2004. The water-level rise was due to a large drainage or runoff event, which may itself have directly influenced calving as all the additional water passing through subglacial channels could have caused rapid uplift. From observations of upwelling and surface currents, we believe that a large amount of subglacial water entered the lake along the eastern margin of the terminus. Following the calving event a small embayment formed at the eastern end of the terminus. Although this calving event was relatively small in terms of ice volume, it may have been significant in removing a large amount of lateral stability from the floating part of the terminus. The uplifted area was no longer connected to the eastern margin.
Without the added stability to hold the floating ice in position, another increase in lake level was then sufficient to cause the large calving event on 18 June 2004. Again the lake level exceeded previous water levels for the season, following 2 weeks of moderate precipitation, high ablation rates and a large pulse of cold water entering the lake. The third large-scale calving event does not have a strong correlation to rising lake level or water temperature fluctuations. This event could be a result of the terminus continuing to adjust to a decrease in back pressure following the removal of the uplifted front. In the 2 weeks prior to the fourth event, we can clearly see upward bending of the calving front. The calving coincides with a relative maximum in lake level. Thus three out of the four calving events responsible for rapid retreat during 2004 are related to short-timescale increases in lake level, which are in turn related to increased subglacial discharge or runoff from precipitation or rapid drainage events from marginal lakes (jökulhlaups).
6. Conclusions
The terminus of Mendenhall Glacier has experienced periods of both rapid retreat and relative stability during the past 5 years. Retreat during a 3 year period between 1999 and 2002 was approximately equal to the retreat that occurred during a 3 month period in summer 2004. The episodic nature of the retreat indicates that bedrock rises or positive basal slopes may exert sufficient back pressure to temporarily stabilize the terminus. This occurred between 1999 and early 2004, as the glacier terminus slowly pulled back from a bedrock rise. During this period of relative stability the eastern half of the terminus thinned until it reached flotation.
In considering what drives the retreat of a glacier such as Mendenhall, we identify factors on three timescales (there may be more).
First, we consider long-term changes in the lower glacier. Dramatic thinning of the lower glacier after the Little Ice Age has been attributed to negative mass balances linked to climate warming (Reference Motyka, O’Neel, Connor and EchelmeyerMotyka and others, 2002). Such thinning is responsible for the existence of Mendenhall Lake and also for the general terminus geometry since the 1980s, when the glacier retreated past a bedrock outcropping and ice flow was directed to the eastern side. The trend of negative mass balances and thinning has continued between 2000 and 2005. While over a long timescale, retreat is driven by climate, on shorter (perhaps sub-decadal) timescales the rate of retreat has been strongly affected by the bed geometry. Recent thinning rates have likely accelerated the retreat already underway, since thinning to the flotation thickness left the terminus vulnerable to buoyant forcing and enhanced the potential for lacustrine calving.
Second, we consider the annual cycles of surface mass balance and lake level. Thinning of the terminus occurs largely over the melt season, which coincides with high lake levels. Both factors drive ice closer to the flotation thickness, until it eventually becomes buoyant as was the case at Mendenhall. However, if bending stresses are increased slowly and relaxed by ice creep, the terminus can undergo annual cycles before failure occurs. Our results show that at Mendenhall Glacier there was considerable unaccommodated buoyant stress in summer 2004. At this stage, bed geometry is again important in providing lateral stability or back pressure on the calving front. The terminus of Mendenhall Glacier was at flotation locally for up to 2 years, therefore we cannot consider a grounded glacier tongue affected by buoyant torque (Reference Warren, Benn, Winchester and HarrisonWarren and others, 2001). Rather we conclude that seasonal fluctuations in thinning rate and in the level of Mendenhall Lake led to a gradual upward deflection of the calving front and gradual increase in unaccommodated tensile stresses.
Third, we consider short-term changes that trigger the eventual failure of the terminus. The nature of the calving events observed during summer 2004 is strongly indicative of buoyancy-driven calving, particularly in forming large, tabular icebergs which are often associated with lacustrine calving (Reference Warren, Benn, Winchester and HarrisonWarren and others, 2001; Reference Van der VeenVan der Veen, 2002). Measurements of water level and temperature in Mendenhall Lake indicate a link between hydrological variables and calving events. Short-term fluctuations in lake level and rapid ice ablation uncompensated by glacier flow can be important triggers for calving events, at least in cases where the terminus is already approaching instability. A slight increase in buoyant load applied over several days might not be accommodated by ice creep, especially given pre-existing weakening due to buoyant upwarping and crevassing.
The ability of temperate lacustrine termini to float reflects the significant differences between lake- and tidewatercalving glaciers. Our results show that sublacustrine melting was not an important ablation mechanism at Mendenhall Glacier during the period of our study. This may also be true at other similar lake-calving termini terminating in cold lakes that are predominantly fed by glacial meltwater. Overall, lacustrine termini experience fewer perturbations (e.g. tidal flexure, thermal convection leading to high subaqueous melt rates or undercutting of the ice cliff) and are therefore inherently more stable than tidewater termini. This may explain why the termini of small lake-calving glaciers such as Mendenhall are generally less weakened by crevassing. Thus it is not surprising that lake-calving rates are low, and lacustrine termini are capable of sustaining the generally unstable geometry of a floating temperate terminus in comparison to their tidewater cousins.
If current trends of recession and thinning persist, the calving rate at Mendenhall Glacier will remain high. The glacier bed remains below lake level at least 500 m behind the present terminus, and if recession continues at the 2000–05 mean retreat rate of about 60 m a−1 the terminus will recede onto land within a decade.
Acknowledgements
This work was supported by a grant from the US National Science Foundation (NSF), No. OPP-0221307. This publication results in part from a UAF Center for Global Change Student Award funded by the International Arctic Research Center through cooperative agreement ARC-0327664 with the NSF. Additional support was provided by the University of Alaska Natural Resource Fund, the USFS (United States Department of Agriculture Forest Service) Mendenhall Glacier Visitor Center, the Geophysical Institute at the University of Alaska Fairbanks, the Environmental Sciences Program at the University of Alaska Southeast, and by Northstar Helicopters, Inc. of Juneau, Alaska. Field equipment was provided by the University NAVSTAR Consortium (UNAVCO) and VECO Polar Resources. Field assistance was provided by J. Amundson, E. Kuriger, A. Bucki, M. Hekkers, M. Heavner, E. Hood and C. Connor. The manuscript greatly benefited from reviews by B. Hanson and A. Vieli.


