


Introduction
Sediment-budget considerations of Arctic Alaska’s inner shelf and coast reveal a significant deficit that requires cross-shelf transport to off-shelf basins, which may be accomplished by ice action (bulldozing, wallowing/ resuspension and rafting) (Reference Reimnitz and KempemaReimnitz and Barnes, 1987; Reference Reimnitz, Graves and BarnesReimnitz and others, 1988). Large amounts of sediments carried by first-year ice in Alaska’s coastal waters have recently been reported (Reference Barnes, Reimnitz and FoxBarnes and others, 1982; Reference Osterkamp, Gosink, Barnes, Scholl and ReimnitzOsterkamp and Gosink, 1984; Reference Reimnitz and KempemaReimnitz and Kempema, 1987; Reference Reimnitz, Kempema and BarnesReimnitz and others, 1987; Reference Kempema, Reimnitz and BarnesKempema and others, 1989). However, almost nothing is known about actual sediment content of pack ice seaward of the Alaska shelf to quantify offshore rafting by sea ice. Such knowledge is important for understanding sediment dynamics, the coastal-zone sediment budget and the circum-Arctic high rates of coastal retreat. Understanding of sediment rafting by sea ice would also improve our ability to interpret the geologic record of glacial/interglacial intervals in deep-sea sediments (Reference Reimnitz and KempemaReimnitz and Kempema, 1988; Reference Darby, Naidu, Mowatt, Jones and HermanDarby and others, 1989). For these reasons, we observed and sampled sediments carried by the pack ice on a cruise of the U.S.C.G. icebreaker Polar Star to the outer shelf and deep waters of the Beaufort Gyre in 1988. This paper is mainly an account of the occurrence, quantity and character of ice-rafted sediment in the Beaufort Gyre in 1988. It also includes analyses of four offshore sediment samples collected from the icebreaker Glacier in 1971 and 1972.
Background Information
Ice motion
Ice rafting is dependent on the movement of pack ice in the Arctic Ocean. Within the generalized circulation pattern (Fig. 1), the Transpolar Drift moves ice from the Siberian shelf across the Eurasian Basin to exit through Fram Strait in an average of 2–3 years (Reference NansenNansen, 1897, Reference Nansen and Nansen1904; Reference KochKoch, 1945; Reference Colony and ThorndikeColony and Thorndike, 1985). The present mean age of sea ice in the Beaufort Gyre (Fig. 1) is thought to be about 5–6 years (Reference Colony and ThorndikeColony and Thorndike, 1985), even though 35 years of observing the ice island T-3 show several revolutions before finally leaving the Arctic Ocean (Reference Clark, Hanson and MolniaClark and Hanson, 1983). Within the gross circulation pattern inFigure 1, the flow of ice is turbulent, commonly developing eddies of tens of kilometers in diameter (Reference WadhamsWadhams, 1981). Such turbulence, in the case of the Beaufort Gyre perhaps even driven by seasonal flow reversal associated with divergent ice motion (Reference McLaren, Serreze and BarryMcLaren and others, 1987), should mix materials from different regions of the Arctic across major stream boundaries.

Fig. 1. Drift of sediment in the pack ice of the Arctic Ocean, generalized after Reference Gordiyenko and LaktionovGordienko and Laktionov (1969). The shelf areas shallower than 30 m, thought to represent the sediment source areas, are stippled. These usually have a short open-water season required for fall-sediment entrainment.
Source of ice and entrained sediment
Continental shelves of the Arctic Ocean are thought to be important sources of sediment-laden sea ice. Conditions for sediment entrainment are optimal in shallow regions (stippled in Figure 1) when the summer open-water season is terminated by freezing storms (Reference Barnes, Reimnitz and FoxBarnes and others, 1982; Reference Osterkamp, Gosink, Barnes, Scholl and ReimnitzOsterkamp and Gosink, 1984; Reference Reimnitz, Barnes and KrausReimnitz and Kempema, 1987; Reference Reimnitz, Kempema and BarnesReimnitz and others, 1987; Reference Kempema, Reimnitz and BarnesKempema and others, 1989; Reference Reimnitz, Kempema, Weber, Clayton and PayneReimnitz and others, 1990). Reference Colony and ThorndikeColony and Thorndike (1985) also showed shelf areas as important sources for ice in the Transpolar Drift and the Beaufort Gyre (Fig. 1). A part of this ice ultimately exits the Arctic Ocean through Fram Strait (Reference Colony and ThorndikeColony and Thorndike, 1985) and recently has been observed to transport significant loads of sediment (Reference Larssen, Elverhøi and AagaardLarssen and others, 1987; Reference Pfirman, Wollenburg, Thiede, Lange, Leinen and SarntheinPfirman and others, 1989a, Reference Pfirman, Gascard, Wollenburg, Mudie and Abelmannb, Reference Pfirman, Lange, Wollenburg, Schlosser, Bleil and Thiede1990). Sediment is entrained during freezing storms over shallow seas. While turbulence prevents formation of a solid-ice canopy, the water becomes slightly super-cooled during storms, and large amounts of frazil ice are in the water column. The rising frazil forms a layer of slush ice containing evenly disseminated fine sediment, which upon congelation becomes turbid ice (Reference Kempema, Reimnitz and BarnesKempema and others, 1989; Reference Reimnitz, Kempema, Weber, Clayton and PayneReimnitz and others, 1990). A secondary entrainment mechanism active after a freezing storm is the rise of anchor ice, adding patchy coarse material to the newly forming ice canopy (Reference Reimnitz, Kempema and BarnesReimnitz and others, 1987). Likely areas for the formation of such turbid ice are shelf areas shallower than 30 m (stippled in Figure 1). Biogenic particulate matter is added to the ice canopy through diatoms, which live primarily on the under surface (Reference KindleKindle, 1909) and become incorporated during ice growth, sometimes resulting in a reddish tinge to the ice. Diatoms and algae also populate meltwater ponds (Reference Nansen and NansenNansen, 1906), adding particulate matter and causing surface discolorations of the ice.
Metamorphosis of sediment-laden ice during rafting
Sea ice undergoes various metamorphic changes that affect its sediment load over time. Reference Pfirman, Wollenburg, Thiede, Lange, Leinen and SarntheinPfirman and others (1989a, Reference Pfirman, Gascard, Wollenburg, Mudie and Abelmannb, Reference Pfirman, Lange, Wollenburg, Schlosser, Bleil and Thiede1990) gave excellent detail which we summarize here. Homogenization and redistribution of sediments occur when ice is crumbled and deformed into pressure ridges or hummock fields, or is rafted on top or underneath other slabs by compressional forces. More important, however, is surface melting, which affects deformed and undeformed ice alike and tends to form a surface lag deposit. Melting first transforms the snow into widespread meltwater ponds, covering as much as 60% of an area. Subsequently, 40–50 cm of the upper ice canopy melts each summer in the central Arctic, and a meter or more in fringing shallow shelf areas. An equal amount of basal ice growth occurs during winter, thereby rejuvenating the ice canopy. Sediment contained in the canopy works its way to the surface within a few years of cyclic surface melt and basal growth, where it tends to concentrate. Meltwater, carrying with it the fine fraction of sediments, drains into depressions or meltwater ponds, or is lost through cracks or over floe edges to the sea. Sediment accumulations in local depressions increase the heat absorption and melting rate, further deepening the depressions. Depression sizes range from large melt ponds to holes a centimeter in diameter. Holes are abundant, and commonly are deepened through the effects of particulate matter, similar to cryoconite holes on glaciers, to 20–30 cm in depth. Processes of freeze-thaw apparently later consolidate particulate matter collected in such holes into cohesive pellets (Reference Barnes, Kempema and ReimnitzBarnes and others, 1990). Such pellets on sea ice typically are only 1–3 mm in diameter (Reference KindleKindle, 1909; Reference Barnes, Reimnitz, Reed and SaterBarnes and Reimnitz, 1974), but may range up to 3 cm (Reference Pfirman, Gascard, Wollenburg, Mudie and AbelmannPfirman and others, 1989b).
Meltwaters, draining laterally off ice floes or vertically through brine channels (Reference Gow and TuckerGow and Tucker, 1987), should result in preferential loss of fine versus coarse sedimentary particles or aggregates each sumer. Reference SverdrupSverdrup (1938) saw more coarse clasts in the pack ice exiting the Arctic Ocean past Greenland than near the Siberian source areas, supporting the loss of originally more abundant fines. This is contradicted by more recent observations of a predominantly fine-grained sediment load in Fram Strait (Reference Larssen, Elverhøi and AagaardLarssen and others, 1987) and the Eurasian Basin (Reference Pfirman, Wollenburg, Thiede, Lange, Leinen and SarntheinPfirman and others, 1989a), where over 90% is clayand silt-sized material and the rare coarse grain ranges up to only 2 mm. The various changes in the mode of sediment occurrence in sea ice described above, and also a possible preferential loss of coarse sediment and Foram-inifera, obscure evidence for the initial entrainment mechanisms over time and drift distance from the source.
Field Methods
Observations were made and samples collected by U.S.C.G. icebreakers in 1971, 1972 and 1988, as shown in Figure 2. All observations reported here were made from along about 25% of the 1988 track line Fig. 1 between 2 and 28 September. During that cruise, samples were obtained at random opportunities, but not where there was notable sediment accumulation. These samples were processed either immediately aboard ship (filtration described later) or shortly after the cruise, while the four 1971–72 samples had been preserved by freeze-drying.

Fig. 2. C.G.C. Polar Star 1988 cruise track with locations of ice-sample stations 1–34 and C.G.C. Glacier 1971 and 1972 stations 35–38 shown as squares. Old snowdrifts with sediment were abundant south of the dashed line crossing the Polar Star track. Depth contours labeled in thousands of meters.
At the time of observations, meltwater ponds were already covered with new ice, and new snow draped the pack ice, except on the windward sides of ice obstructions. As a result, conditions for observing sediment on the sea-ice surface and in melt ponds were very poor. Samples of solid ice, slush ice on leads, new snow or sea water were collected at 34 sites (54 samples), melted, pumped through 0.4 μm pre-weighed nuclepore filters aboard ship and reweighed later, to determine the concentration of particulate matter in volumes of water, following the procedures described by Reference Barnes, Reimnitz and FoxBarnes and others (1982). Water volumes filtered ranged from 175 to over 2000 ml. Most samples were taken while underway with a basket, bucket or net. Where we had the opportunity to get on to the ice, we sampled with an auger or a shovel. At five stations, we obtained bulk sediment samples by picking, chipping or scraping from dirty ice surfaces into containers (most of the material from station 25 was accidentally spilled after melting).
The various analytical procedures used to study samples are not listed here but for brevity are given with the results.
Observations
From the ship
The thickness of new snow and ice on meltwater ponds and the amount of slush ice on leads increased with time and latitude during the cruise. Thus, any sediment load was best seen in fracture faces created by and adjacent to the icebreaker (Figs 3–5). The only sediment observable in a wider swath occurred in exposed old snowdrifts under favorable lighting (Fig. 6). The ice traversed generally covered from 7/10 to 10/10 of the sea surface and was commonly 2–3 m thick multi-year ice. Thicker ice was avoided if possible, thereby biasing underway observations toward thinner parts of the ice canopy.

Fig. 3. Dark plaques (~l–8cm) of algae (Melosira arctica) associated with broken new fresh-water ice covering melt ponds on sea ice.

Fig. 4. Layer of fine sediment on floor of meltwater pond on old sea ice fractured by vessel. The thin plates are new fresh-water ice grown on meltwater pond.

Fig. 5. Horizon of large pellets exposed about 20 cm below the ice surface.

Fig. 6. Faintly discoloured old snowdrifts containing significant amounts of fine sediment, typical of extensive regions south of the dashed line in Figure 1.
Commonly, the ice had a faint, orange-brown discoloration from algae occurring evenly through the lower half. Meltwater obtained from such ice had a tide-pool smell, and the filter membranes clogged rapidly with diatoms, chrysophytes and other biogenic materai. Where floes were surrounded by water and a submerged “ram” had formed, this had a dusting of particles released from dirty ice or from plankton. Such dusting occurred only on the leeward, sheltered sides of floes. Disturbances of such floes by the icebreaker produced plumes of sediment. Biogenic discoloration was seen mainly south of 73°N, was highly variable in intensity and commonly occurred in association with small Arctic cod living on the underside. Ice-breaking frequently suspended 1–8 cm brown plaques, probably algal material (Melosira arctica (Ehrenberg), according to R. Horner (personal communication, 1988)) living mainly on the underside of the ice but apparently also in melt ponds (Fig. 3).
Turbid ice, which is typically terminated by an undulating, sharp basal boundary (Reference Barnes, Reimnitz and FoxBarnes and others, 1982; Reference Kempema, Reimnitz and BarnesKempema and others, 1989), could be distinguished from biogenic discoloration with reddish tinge by the brownish to grey colour. This turbid ice was seen occasionally along the entire track line (Fig. 2) but occurred only in 0.5–3 m diameter patches in fracture faces. Sometimes turbid ice was capped by a discontinuous, 1–3 cm thick sediment layer extending for 20–40 cm along the snow/ice interface. Elsewhere, sediment pellets of 0.5–4 cm diameter were noted along that interface above small patches of turbid ice.
Sediment occasionally was also seen in 0.5–3 cm thick layers extending for 3 m or more along a fracture face. In some instances, such layers occurred in meltwater pools (Fig. 4) or along the interface between dense, clean ice and the snow blanket. Tree branches were occasionally associated with sediment layers.
A ubiquitous mode of sediment occurrence was in minute to 5 cm diameter pellets, usually aligned in irregular, sub-horizontal layers. Such aligned pellets were found as follows: (1) as far as 35 cm below the top of multi-year floes (Fig. 5), (2) at interfaces between ice and snow, or (3) on the ice surface. In deteriorating ice beneath meltwater ponds, sediment aggregates were seen in the voids between vertical prisms of rotten (candled) ice.
Volumterically, the most important mode of sediment occurrence seemed to be in subdued drifts of hard, granular snow (Fig. 6). The sediment discoloration of these drifts was usually subtle, and went unnoticed for several days until our first opportunity to walk on the ice (station 9, Fig. 2). Their abundance over the initial part of the track was documented later from color slides and video records. Once recognized, sediment-laden drifts were observed scattered over the entire pack ice south of ~74°N, but distinctly less northward from there toward the center of the Beaufort Gyre (Fig. 2). Snowdrift ablation surfaces showed sediment concentrations and occasional internal sediment stratification. Sediment-laden snowdrifts were most common on thick, hum-mocky or pressure-ridged ice, and were always seen in association with surface relief on the ice. The ice underlying discolored drifts usually was dense, blue multi-year ice apparently free of sediment internally.
In spite of special attention devoted by all members of the scientific party to a search for pebbles, shells or other coarse clasts, none was seen besides tree branches mentioned above. However, the common pebble-sized aggregates would be indistinguishable from the passing ship from rocks (Fig. 5) and their occurrence is not ruled out.
Observations from the Ice Surface
At five of seven sites where the ice canopy could be studied directly (stations 9, 12, 18, 25 and 34), 50–400 ml of wet sediment was concentrated from notably sediment-rich ice and snow. At the remaining two sites (stations 17 and 19), no such sediment concentrations were found after searching 2000 and 50000 m2 areas. Most of the five sediment-rich samples were taken from 0.5–3 m2 areas of porous, granular, hard old snow. At three sites, chipping downward to the toe of a snowdrift to the level of the underlying sea ice exposed sediment pellets in thimble-size holes. These sediments were also taken. At several sites, fresh snow was removed to expose sediment concentrations on an underlying hard ice surface. An overhanging ablation scarp exposed dry, powdery sediment in millimeter-size pockets. At station 34, sediment-rich snowdrifts occupied 6–8% of a particular, 300 m diameter floe surrounded by similar floes. We recovered about 400 ml of wet sediment from a 2 m2 large area on this floe (Fig. 7), without nearly exhausting the drift. We can therefore assume that this single floe carried at least 1.5 tonnes of mud, and 1km2 of ice canopy accordingly would carry over 22 tonnes of mud. Considering that the denudation rate of vast Iandmasses draining into the Arctic Basin is 8 tonnes km−2 year−1 (Reference Milliman and MeadeMilliman and Meade, 1983), this load is significant.

Fig. 7. Dirty, hard snow chipped from a 2 m2 area on the surface of this old drift at station 34 contained 400 ml of wet sediment.
The spilled sample from station 25 was very rich in organic matter, some sticking to the walls of the meltwater container, forming a thick gooey ring. Only enough sediment was salvaged for clay-minerals analyses and diatom identification.
Analytical Results
Sediment concentrations and composition of filtered material
The sediment concentrations contained in samples of solid sea ice, slush ice, snow and sea water are given in Table 1 as mg l−1 of suspended particulate matter (SPM), as all volumes were measured in the liquid state. The average SPM values for sea-ice samples are far higher than for samples of slush, snow or sea water. Two values of about lOOmg l−1 and one with over 900mg l−1 were obtained from drifting ice of the the same general area (stations 6, 7 and 8).
Table 1. SPM concentrations in (melt) water (mgl-1)

Filtration of two ice samples (stations 6 and 7) required a long time and the filter membranes were covered with a white, felt-like mat primarily of algal material. The highest SPM concentration (station 8) contained mainly silt-size, light-colored mineral matter, dominantly quartz and microscopic silt aggregates. Similar particulate matter was seen under the microscope on many of the other membranes. The most common particulate matter recognizable under the microscope consisted of diatoms, chrysophyte cysts, sponge spicules and a few fish teeth. Slush-ice samples contained diatoms, desmids and traces of light-colored mineral matter. New snow had extremely low concentrations of particulate matter (<1 mg l−1), none of it recognizable under the microscope. Several samples of seemingly clean, old, hardened snow also contained light-colored mineral grains and silt aggregates, but diatoms were not noted. Traces of silt-size terrigenous elastics were also seen in sea-water samples but these were likely suspended from surrounding ice by the icebreaker.
Sediment Pellets
Sediment pellets, separated from dispersed sediment at stations 9, 12, 18 and 34 by the gentle use of a 62μm sieve and running water, constituted from 20 to 40% of the bulk sample volume. Virtually all particles >62μm were sediment pellets. These pellets were further split into five size fractions by wet sieving and the volume percentages of fractions averaged from three independent, visual estimates (Fig. 8; Table 2). Abrasion and rounding of pellets during sieving was unavoidable, as revealed by continuing discharge of turbid water from the sieve. We believe, however, that size decrease in the process was negligible. Microscopic comparison of pellets concentrated by washing/decanting and by sieving indicates similar shapes (Fig. 9). A close-up view of a pellet surface (Fig. 10) is dominated by clay particles, diatoms and sponge spicules.

Fig. 8. The three largest size classes of pellets in sediments of station 18, separated by gentle wet-sieving.
Table. 2. Pellet-size distribution by wet volume (in per cent)

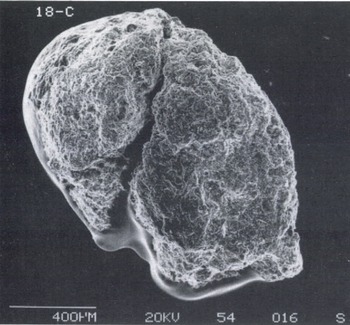
Fig. 9. Scanning electron-microscope (SEM) photograph of a pellet.

Fig. 10. Close-up SEM photograph of the pellet in Figure 9, showing sponge spicules, diatom fragments and fine clastic detritus.
Grain-Size Distribution
The size distribution of sediment samples, determined by sieve and pipette analyses (Reference Galehouse and CarverGalehouse, 1971) indicates a dominance of silt-and clay-size particles (Table 3). Disaggregated pellets analyzed separately were found to have essentially the same textural composition. All but the sample from station 38 contain 0.3–1.9% of sand-size material. Foraminifera were not seen in the sand fraction.
Table 3. Percentages of sand, silt and clay (pellet values in parentheses)

Carbon Content
Analyses of total carbon and inorganic carbon were performed using a CO2 coulometer with induction Averages of 2–3 burns/digestions per sample. High organic carbon content from contamination? furnace and acid digester (Reference HuffmanHuffman, 1977). Organic carbon is determined as the difference between total carbon and acid-digestible carbon. CaCO3 percentages were determined by multiplying the percentage of acid-digestible carbon by 8.333, a constant that assumes all inorganic carbon is in the form of CaCOß. Pellets were analyzed separately. Carbon-content values are similar in most samples (Table 4), with organic carbon values near 2% (1.1–2.7%) and calcium carbonate values mostly less than 0.5%. The high total carbon and calcium carbonate values for station 34 may be due to contamination during sample processing.
Table 4. Carbon content (C) of ice-rafted sediment (pellet values in parentheses)

Mineralogy of < 2 μm Fraction
The < 2 μm clay and non-clay mineralogy of bulk samples was determined following techniques of slide preparation, X-ray diffraction and identification described by Reference Hein, Scholl, Gutmacher and BaileyHein and others (1976). For the latter analyses, we used machine settings of 20 mA, 40 kV, rate 500, TCV5 and scanned from 4° to 70°, at a speed of 1°min−1 and a chart speed of 1.3 cm min−1. Relative percentages of clay minerals were calculated using Reference BiscayeBiscaye’s (1965) peak-area weighting factors of 2 for chlorite-kaolinite, 4 for illite and 1 for smectite. Pellets were analyzed separately and the results are shown in Table 5. Relative percentages of quartz, plagioclase, pyroxenes and other associated minerals were determined using peak heights and weighting factors of Reference Cook, Johnson, Matti, Zemmels and KanepsCook and others (1975). The results are shown in Table 6. Percentages of pyroxene and the clay minerals kaolinite, chlorite and illite are rather uniform among the ice floes sampled. This seems surprising since the ice at stations 35–38 was sampled 16–17 years prior to that of stations 9–25, and would represent different entrainment events. Such events are geographically restricted by a combination of weather, fetch, water depth to specific source areas for each event.
Table 5. Percentages of clay minerals (pellet values in parentheses)

Table 6. <2 μm non-clay mineralogy (in per cent)

Diatoms and Other Microfossils
Microfossils in the five ice-rafted sediment samples collected from Polar Star were identified by J. Barron (personal communication, 1990) and subsequently verified and expanded with addition of habitats by R. Horner (personal communication, 1990) (Table 7). The faunal compositions indicate a wide range of habitats, including benthic organisms that spend most of their life cycle on the shelf surface.
Table 7. Diatoms and other micro fossils, identified by J. Barron (labeled either bjor Barron, or A, C, For Rfor abundant, common,jew or rare, respectively, or R. Homer (labeled h). Homer provided habitats as known to her. An x in the last column marks those forms which, according to Barron, spend most of their life cycle on the shelf surface

Discussion and Conclusion
Sediment distribution and composition
Small amounts of fine-grained sediments were widespread on the pack ice of the Beaufort Gyre traversed by icebreaker in the late fall of 1988. The sediment occurred in the form of: (1) rare patches of turbid ice, (2) concentrated patches on the ice surface or on floors of melt ponds, (3) as pellets ranging up to several centimeters in diameter but usually much smaller, or (4) throughout drifts of old snow. Sediment-laden drifts of old snow carried the most sediment per unit area,especially at the fringes of the Beaufort Gyre. Such drifts were rare toward its center. Measured sediment concentrations in sea ice ranged from 0.5 to 900 mg l−1, and with an average of40 mg l−1 were significantly higher than in new slush on leads, in new snow or in sea water.
The sediments recovered from the pack ice of the Beaufort Gyre, considering its mobility, are remarkably similar ove wide areas and over the time span of about 16 years. In the few fresh bulk samples available (#9, 12, 18 and 34), sediment pellets comprise less than half the total volume and were predominantly smaller than 1 mm in diameter. Dispersed-sediment composition is similar to that of sediment pellets in all aspects studied. Both are composed of equal quantities of silt and clay with 1% or less of sand-size particles, contain about 2% organic matter, less than 0.5% CaCO3 and have similar clay-mineral types. The microfauna, consisting mainly of diatoms, indicates a cosmopolitan source. However, the fauna includes a conspicuous component of Arctic shallow-shelf forms.
The Probable Entrainment Mechanism
With the bulk of grains smaller than 16 μm, the texture is very similar to that of sediments previously collected from ice in the shallow Beaufort Sea (Reference Kempema, Reimnitz and BarnesKempema and others, 1989) and in the Eurasian Basin and Fram Strait (Reference Pfirman, Wollenburg, Thiede, Lange, Leinen and SarntheinPfirman and others, 1989a; Reference Wollenburg, Pfirman and LangeWollenburg and others, 1990). Recent field and laboratory studies have shown that fine-grained sediments are entrained into a newly forming ice cover in the presence of, or through the action of, frazil ice in shallow water (Reference Kempema, Reimnitz and BarnesKempema and others, 1989; Reference Reimnitz, Kempema, Weber, Clayton and PayneReimnitz and others, 1990). The fine texture, together with the presence of shelfal benthic marine microfossils and of sponge spicules, suggests shallow shelf surfaces bordering the Beaufort Gyre as likely sources.
The above entrainment mechanism of suspension freezing requires the presence of open water (fetch), sub-freezing winds, turbulence and shallow water occurring together. For this reason, the major events supplying sediment to the slowly revolving Beaufort Gyre do occur as pulses. One major pulse occurred in the fall of 1978 (Reference Reimnitz and KempemaReimnitz and Kempema, 1987; Reference Kempema, Reimnitz and BarnesKempema and others, 1989), and the next one 10 years later during the winter of 1989 (unpublished data of E. Reimnitz). Such pulses should be recognizable as large, discrete regions (hundreds of kilometers) containing very dirty ice separated by regions of relatively clean ice. Through several seasons of bottom adfreezing and surface melting, sediment originally dispersed throughout turbid ice ends up as a lag deposit on the surface, where it is concentrated and thus exposed to eolian processes.
Redistribution by Wind
Most sediment seen on the pack ice in 1988 appeared to have been eroded from the ice surface and redeposited in snowdrifts by wind. The dominance of eolian deposits occurring on massive, blue multi-year ice suggests that what may have originated as turbid ice had undergone several seasons of metamorphosis and therefore was distant in time and space from initial entrainment.
The phenomenon of sediment reworking on the pack ice by wind has previously been reported from other parts of the Arctic Ocean (i.e. Reference Pfirman, Gascard, Wollenburg, Mudie and AbelmannPfirman and others, 1989b) and therefore seems to be widespread. As the threshold velocity for snow mobilization is only 10 kt (Reference Ackley, Lange and WadhamsAckley and others, 1990), redistribution and resculpturing of the snow surface is an ongoing and highly dynamic winter process. Erosion and undercutting of windward faces of stratified snowdrifts, followed by sagging, calving and crumbling of cantilevers, all can be observed within only minutes (Fig. 11). In troughs between migrating drifts, sea ice may become exposed (Reference Ackley, Lange and WadhamsAckley and others, 1990), subjecting any surficial sediments to drying and wind ablation. Under such conditions, sediment derived from ablating surfaces of dirty ice may form drifts together with snow on adjacent, previously clean ice floes. Size sorting will occur in the process, with the coarsest clasts and aggregates left on the original dirty ice and the finer ones moving on. Some sediment would be lost to open water in leads.

Fig. 11. Photograph showing wind erosion of stratified snowdrift at speeds over 5m s−1. Note the down-bent bedding planes in 30 cm long cantilever.
Sediment Agregates
Pellets were an important component of the sediment load on the pack ice in 1988 (about 30% by volume). They were also seen on old snowdrifts. Winter mobilization and migration of snowdrifts should result in concentrations of pellets, the densest particles, at the underlying ice surface. Such concentrations were not observed, suggesting that sediment pellets might be detroyed by wind. The mechanism of pellet formation and consolidation probably is related to repeated freeze-thaw cycles, but details of the process remain uncertain (Reference Barnes, Kempema and ReimnitzBarnes and others, 1990). However, pellets clearly are derived from dispersed sediment on the ice, as both types of sediment are similar in all respects and the pellets even contain diatoms and sponge spicules.
Sediment pellets have been reported in sea-floor sediment cores from our study area (Reference Goldstein and MolniaGoldstein, 1983) and from other parts of the Arctic Ocean (Reference Goldschmidt, Pfirman, Wollenburg and HeinrichGoldschmidt and others, in press), and have been considered as indicators of the presence of drifting ice. The pellets separated in our analyses were surprisingly resistant to handling and sieving in water and appeared capable of staying intact when settling through a 3000 m water column. None was recovered in sieving the uper 7 cm of Holocene mud from two box cores nor in the study of split piston cores from the study area (personal communication from L. Phillips, 1991). A few sediment aggregates, generally smaller and more angular than those collected from the ice, were picked from alcohol-preserved surface slurries of seven piston cores, five box cores and one dart core, raised from depths between 3636 and 46 m in the study area (personal communication from M. Mullen, 1991). These aggregates were distinct from fecal pellets found in the same samples, and several also contained planktonic Foraminfera, lacking in mud pellets formed on ice. A more thorough comparison of fresh-ice and bottom samples must be made to answer whether sea-ice sediment pellets do survive the drop to the deep-sea floor.
Deposition From Pack Ice
According to Reference Colony and ThorndikeColony and Thorndike (1985), the ice moving within the Beaufort Gyre would melt largely in regions beyond its own boundaries, in the distal reaches of the Transpolar Drift (Fig. 1). That does not mean, however, that it is not releasing sediment along the way. As the ice surface melts, any contained sediment is concentrated there and re-distributed by running meltwater. Meltwater with sediment also spills to the sea. This was seen by the development of turbid plumes when the icebreaker tilted floes carrying pools of meltwater, as discussed earlier. Sediment spilling would occur on much larger scales when ice floes are broken and the fragments piled into large pressure ridges during melting. Sediment redistribution on floe surfaces by winter winds would also spill some particulate matter into adjacent leads. Some of the ice-rafted sediment seen in the study area, including pellets, therefore, is being deposited on the floor of the Canada Basin.
Deposition by pack ice is influenced by complex interactions of numerous factors that affect (1) the rate and timing of sediment release from ice, and (2) settling times from particle release to deposition. Sediment release is, of course, largely dependent on water and air temperatures, as shown by sediment-trap studies in Fram Strait (Reference Hebbeln and WeferHebbeln and Wefer, 1991). It is also dependent on ice thickness. Floes thickened through compression into massive ridges survive longer, travel farther and therefore release sediment beyond areas reached by relatively thin, undeformed floes. The timing of sediment release is mainly controled by the winter/ summer seasons, which effectively turn the rain of particles from a particular floe on and off while its drift continues. Settling times of a particle dropped from ice is not only a function of its size and the water depth at the drop point but is further influenced by formation of pellets, which increases settling rates. The interaction of these and other variables has the result that sediments entrained into the pack ice along the rim of the Beaufort Gyre in different source areas become well mixed over wide regions of the central Arctic Basin. Over time, particles from various ice floes and different source areas settle one on top of another on the basin floor.
Considering the above depositional setting, the relatively homogeneous distribution of clay-mineral assemblages in surficial sediments of the central Arctic Basin, reported by Reference Darby, Naidu, Mowatt, Jones and HermanDarby and others (1989), is not surprising. Likewise, their average clay mineralogy for surface sediments is rather similar to that of our ice-rafted samples (Fig. 12), even though the variability between floes (i.e. smectite range 4–26%) is rather high (Table 5). This observation supports the concept of sediment mixing of fine particles from different source areas by processes of ice rafting in the Beaufort Gyre.

Fig. 12. Average clay-mineral percentages from the region covered by the Beaufort Gyre in (a) 29 surface-sediment samples of the deep sea (after Reference Darby, Naidu, Mowatt, Jones and HermanDarby and others, 1989), and (b) 13 ice samples, including pellets (Table 5).
Size Sorting During Transport and Deposition?
Entrainment by suspension freezing is the principal loading mechanism for rafting by sea ice. While the resulting turbid ice contains mainly fine-grained sediment, it has patchy secondary inclusions of coarse clasts from the action of anchor ice (Reference Reimnitz, Kempema and BarnesReimnitz and others, 1987; Reference Kempema, Reimnitz and BarnesKempema and others, 1939; unpublished data). Therefore, we are puzzled by the apparent lack of sand or coarser clasts during the 1988 cruise. The only sample with a significant sand component was from a previous cruise (station 38, Table 3). Aside from several tree branches, no coarse clasts were seen from the ship in 1988, even though specific efforts were made by all observers. This apparent lack of coarse material here and at the Fram Strait exit of the Transpolar Drift mentioned earlier suggests a possibly preferential loss of coarse clasts, as unlikely as this seems. Evidence for downward migration and ultimate loss of surficial sand from a thick, perennial ice cover of an Antarctic lake, was presented by Reference Nedell, Andersen, Squyres and LoveNedell and others (1987), but the details of the process were left unclear. Thus, the long-term fate of coarse clasts held in sea ice needs additional studies.
Calcareous microfossils are abundant in turbid first-year ice of the inner Beaufort Sea shelf (Reference BriggsBriggs, 1983; Reference Kempema, Reimnitz and BarnesKempema and others, 1989, p. 315). Such fossils were also abundant in turbid first-year ice in 1989 along the Beaufort Sea shelf edge and in the Northwest Passage (unpublished data). Therefore, a complete lack of such a microfauna in multi-year ice may suggest their destruction by wind abrasion, or by dissolution from meltwater with low pH on the ice surface. Evidence in the form of abraded or dissolved tests or carapaces, however, is lacking. The lack of a calcareous microfauna may also be related to the suspected loss of a sand fraction discussed above.
Sediment-laden Ice Observed in 1978
In an attempt to gain a perspective on the question of the transport and source of the sediment sampled and observed in 1988, we refer to a major slug of ice-rafted sediment introduced in 1978. Unusual sediment entrainment conditions in the fall of 1978 placed over 1000 m3km−2 of sediment into newly forming ice, extending seaward to the 30 m isobath in the Prudhoe Bay area (Reference Reimnitz and KempemaReimnitz and Kepmema, 1987; Reference Kempema, Reimnitz and BarnesKempema and others, 1989). We estimate the subsequent course of that slug of ice-rafted sediment based on the work of Reference Pritchard, Barnes, Scholl and ReimnitzPritchard (1984). His simulated ice motions for a 1 year period, based on 25 years of wind data using a free-drift model,suggested that the bulk of the 1978 sediment load would have easily passed through our study area in less than a year Fig. 13. Conversely, the simulation suggests that turbid ice transported directly to our study area from known shallow sources fringing the Beaufort Gyre Fig. 1 would be less than 2 years old. In such relatively young ice, the entrainment mechanism would still be recognizable in the form of near-surface layers of turbid ice. What little turbid ice we did observe was patchy and broken up within massive multi-year ice, suggesting a history of multiple crushing and melt seasons. Moreover, 3–5 years are required to raise sediment originally contained in lower parts of young sea ice to the surface (i.e. Reference Pfirman, Wollenburg, Thiede, Lange, Leinen and SarntheinPfirman and others, 1989a). Essentially, all sediment occurred on or near the surface in 1988, but never associated with undisturbed turbid ice extending over tens of meters. Thus, the ice and sediment in our study area had undergone extensive metamorphosis. From these facts, and many years of observing new turbid ice on the shallow Beaufort Sea, we believe that the observed sediment had been rafted for over 4 years. Since 4 years updrift, there are no likely source areas for turbid ice Fig. 1, we speculate that the sediment was on at least its second circumvention of the Beaufort Gyre.

Fig. 13. lyear, mean cumulative drift trajectory for sea ice originating at Prudhoe Bay on 1 October simulated from 25years of wind records. The ellipse defines the area of 50% likelihood for the location of a floe after drifting lyear, and shading indicates the present study area. (Prepared after Reference Pritchard, Barnes, Scholl and ReimnitzPritchard (1984, fig. 15).)
Sediment-flux Estimation
In spite of the relatively clean appearance of sea ice transited in 1988, its average load (40mg l−1) exceeded that of sea water by 50 times (Table 1). Comparing this load to the contribution from atmospheric dust measured in new snow (<1 mg l−1; Reference Darby, Burckle and ClarkDarby and others, 1974; and Table. 1), atmospheric dust is insignificant for the overall sediment budget of the Arctic ice canopy. Assuming that only the upper 1 m of the 3–4 m thick ice cover contains particulate matter at concentrations of 40 mg l−1, the sediment load was 40 tonnes km−2. We estimate that discolored snowdrifts containing ablated sediment in a broad belt along the rim of the Beaufort Gyre contained an additional 22 tonnes km−2 of fine sediment. Using sediment dry densities of l g cm−3 measured on cores of the central Arctic Basin (personal communication from H. Lee, 1991), and assuming that each year the ice canopy releases one-third of its load to the sea floor, we calculate a sedimentation rate of 2 cm 1000 year−1. A Holocene deposition rate of 2–3 cm 1000 year−1 was recently measured from a box core in our study area by the accelerator mass spectrometer (AMS) 14C technique (personal communication from G.Jones, 1991). Without knowledge of sediment-release rates from the pack ice within the Beaufort Gyre, as for example those measured by traps in Fram Strait (Reference Hebbeln and WeferHebbeln and Wefer, 1991), load estimates cannot be translated into regional deposition rates. Our load estimates for comparatively clean ice do suggest, however, that sediment-rafting by modern sea ice is a significant component of the total Arctic Basin sediment budget. The high sediment content estimated for pack ice may also help explain questions about the coastal and shallow-shelf sediment deficit that led to this study.
Acknowledgements
We are very grateful to A. Grantz for opportunities provided to observe and sample the ice, to officers and crew of Polar Star, and to numerous members of the scientific team for their help in the field. We also thank J. Barron and R. Horner for their work in identifying the diatoms and possible sources for particulate matter in the ice. G. Jones graciously gave us surface muds from two box cores for our pellet studies. R. Oscarson assisted with the scanning electron-microscope studies, and J. Hein guided us through the clay-minerals analyses. We thank them for sharing their expertise and time with us. Special thanks are given to S. Pfirman and D. Darby for their knowledgeable reviews of the manuscript and valuable suggestions. An anonymous reviewer is acknowledged for improving the manuscript.
The accuracy of references in the text and in this list is the responsibility of the authors, to whom queries should be addressed.


