


Type 2 diabetes mellitus (T2DM) is a chronic disease mainly characterized by the disorder of glucose metabolism, which may lead to a variety of specific severe complications such as CHD, stroke, diabetic retinopathy and kidney failure( Reference van Dieren, Beulens and van der Schouw 1 ). T2DM and its complications have been becoming a main burden of disease around the world, particularly in developing countries( Reference Herman and Zimmet 2 ). Aggressive control of hyperglycaemia, either by medicine or lifestyle intervention, is crucial to decrease the incidence of diabetic complications and the related premature death( Reference Ismail-Beigi, Craven and Banerji 3 , Reference Ray, Seshasai and Wijesuriya 4 ). As a biomarker reflecting an individual's average level of blood glucose over past 2–3 months, glycosylated haemoglobin A1c (HbA1c) has been associated with the risk of long-term diabetes complications( Reference Stratton, Adler and Neil 5 ) and used as the main indicator of glycaemic control status among diabetes patients( 6 ). The American Diabetes Association recommends an HbA1c level below 7·0 % as the goal of glycaemic control for diabetes patients( 6 ).
There is sufficient evidence to support the role of dietary fibre in improving glycaemic control status in diabetes patients( Reference Chandalia, Garg and Lutjohann 7 – Reference Post, Mainous and King 9 ). Evidence is also available for its beneficial effect on prevention of diabetes complications. By following up 7822 US women with T2DM in the Nurses’ Health Study for 26 years, He et al.( Reference He, van Dam and Rimm 10 ) found that the highest v. the lowest quintile of intakes of whole grains, cereal fibre, bran and germ were associated with 16 % to 31 % lower all-cause mortality. Bran intake was inversely associated with CVD-specific mortality. The US Department of Agriculture has recommended a minimum daily fibre intake of 3·35 g/1000 kJ (14 g/1000 kcal) for individuals at high risk for T2DM( 11 ). The American Diabetes Association also suggests that patients with T2DM should increase their consumption of dietary fibre to adjust blood sugar and blood lipids, and thus reduce the risk of diabetic complications( 6 ).
Compared with Western populations, Chinese people usually have more dietary fibre intake( Reference Zhou, Stamler and Dennis 12 ). The average level of total and soluble fibre intakes in Chinese diabetes patients were reported to reach 26·5 and 10·4 g/d, respectively, in a small-scale hospital-based survey( Reference Yin, Zheng and Huang 13 ), more than the moderate amount recommended by the American Diabetes Association (total 24 g/d; soluble fibre 8 g/d and insoluble fibre 16 g/d)( 6 ). However, both glycaemic control status and complications control were unsatisfactory for Chinese diabetes patients( Reference Liu, Fu and Wang 14 ).
We previously reported an inverse association between dietary fibre and HbA1c among Chinese patients with T2DM( Reference Jiang, Qiu and Zhao 15 ). Based on the initial cross-sectional study, we further conducted a repeat dietary survey, aimed to evaluate the long-term effect of dietary fibre intake on glycaemic status among Chinese patients with T2DM.
Materials and methods
Participants
As described in our previous report( Reference Jiang, Qiu and Zhao 15 ), 979 prevalent patients with T2DM were recruited in the communities of Shanggang, Zhoujiadu, Huamu, Puxin, Weifang, Jinyang, Meiyuan and Jichang in Pudong New Area of Shanghai, China, during the period October to December 2006. These patients were diagnosed with T2DM by physicians according to the 1999 WHO diagnostic criteria: (i) fasting plasma glucose ≥7·0 mmol/l; or (ii) 2-h plasma glucose ≥11·1 mmol/l during an oral glucose tolerance test (75-g glucose load should be used); or (iii) a random plasma glucose concentration ≥11·1 mmol/l in persons with symptoms of hyperglycaemia or hyperglycaemic crisis. After excluding those occurring with a cardiovascular event during the previous 6 months, having advanced congestive heart failure, unstable angina, major depression or dementia, 934 eligible patients with a mean age of 64·5 (sd 10·1) years were interviewed; 41·7 % of these patients were male.
During the period May to July 2011, a repeat survey was conducted for all participants of the first survey using a similar protocol. A total of 508 patients were successfully followed up, with a response rate of 54·4 %. Of the 426 individuals lost, eighty-one were deceased or heavily sick, seventy-seven were out of town, eighty-one declined and 187 could not be contacted.
Data collection
In both surveys, a face-to-face interview was conducted by well-trained interviewers using a structured questionnaire after obtaining written consent from each participant. The collected information included demographic characteristics, duration of being diagnosed with T2DM, regular exercise (at least three times per week and at least half an hour per time), dietary habits, oral hypoglycaemia drug use and insulin use, and T2DM in first- and second-degree relatives.
At the interview, body measurement was conducted to collect body height, weight, waist circumference and hip circumference for each participant by following a standardized protocol. BMI was defined as weight divided by height squared (kg/m2).
Dietary assessment
Dietary intake was assessed using an interview-administered FFQ. The FFQ was modified based on an FFQ whose validity and reproducibility had been evaluated in the same population( Reference Shu, Yang and Jin 16 ). The FFQ specifies 103 food items, covering 90 % of food items commonly consumed by Shanghai citizens. Participants were asked to report the frequency (daily, weekly, monthly, annually or never) and duration (months per year) of their consumption of each food item, as well as the estimated amount for each time they ate in the unit of liang (1 liang = 50 g). The amount of intake was reported in millilitres for liquid foods like milk, juice and beverages, and was further transformed to grams in data analysis. The daily intakes of oil, salt and sugar were calculated as the average level consumed by each member of the participant's family.
The Chinese Food Composition Tables were utilized to estimate the amount of nutrients from each food item and to obtain glycaemic index (GI) values for most food items( Reference Yang, Wang and Pan 17 ). For the remaining GI values we referred to Foster-Powell et al.'s report( Reference Foster-Powell, Holt and Brand-Miller 18 ). Glycaemic load (GL) was calculated by multiplying a food's GI (as a percentage) by the net carbohydrates in a given serving( Reference Pi-Sunyer 19 ). The daily GL intake was calculated by summing the GL from each food item consumed, and the average GI intake was further obtained by dividing the daily GL intake by the total net carbohydrate intake. For dietary fibre intake, only insoluble fibre was included. We excluded from the study participants who had extreme values for total energy intake (<3347 or >16 736 kJ/d (<800 or >4000 kcal/d) for men, n 5; <2092 or >14 644 kJ/d (<500 or >3500 kcal/d) for women, n 3) to minimize the potential recall bias, as did previous studies( Reference Fung, Schulze and Manson 20 ).
Biochemical assay
In both surveys, a blood sample for biochemical assay was collected from each participant after an overnight fast of at least 10 h. As described in our previous report( Reference Jiang, Qiu and Zhao 15 ), HbA1c was measured using ion-exchange chromatography on a DS5 Glycated Hemoglobin Analyzer (DREW DS5; Drew Scientific Co. Ltd, Cumbria, UK). Quality assessment of assays was performed internally and externally( Reference Jiang, Qiu and Zhao 15 ).
Statistical analysis
Statistical analyses were conducted utilizing the SAS statistical software package version 9·3. Differences in characteristics and dietary factors between the two surveys were compared using χ 2 tests for categorical variables and non-parametric signed-rank tests for continuous variables. Pearson correlation tests were used to evaluate the consistency of the two measures of dietary fibre intake per 1000 kJ/d. An unconditional logistic regression model was applied to estimate the adjusted odds ratios and 95 % confidence intervals of dietary fibre intake per 1000 kJ/d with glycaemic control status, which was classified as ‘controlled’ and ‘uncontrolled’ by HbA1c level of 7·0 %. Dietary fibre intake per 1000 kJ/d was classified into tertile groups and scored as 1, 2 and 3 by sex-specific cut-off points for the first and second surveys, respectively. The change in dietary fibre intake was specifically defined as the difference in tertile scores between the two surveys, and thus yielded five groups ranked as −2, −1, 0, 1 and 2. A generalized linear model was used to estimate the effect of changes in dietary fibre intake on the difference of HbA1c level between the two surveys. All statistical tests were based on two-sided probability and the significance level was 0·05.
Results
Of a total of 934 participants, 508 patients were successfully followed up and 497 donated a blood sample. Compared with the non-participants of the second survey, the participants were significantly younger and less likely to use an oral hypoglycaemia drug and insulin at the first survey. However, no significant difference was observed between the two groups with regard to sex, BMI, family history of diabetes, duration of diabetes and presence of other chronic diseases (data not shown).
Among the 508 patients who participated in both surveys, more family history of diabetes, higher prevalence of hypertension, dyslipidaemia and CHD, more use of an oral hypoglycaemia drug and/or insulin, a higher level of dietary fat but lower levels of energy, carbohydrate, dietary GI and dietary fibre intakes were observed at the second survey than at the first survey, as shown in Table 1. These patients, however, were more likely to exercise and had lower average BMI at the second survey. No significant difference was observed for intakes of energy-adjusted dietary fibre (P = 0·252), protein (P = 0·852) and dietary GL (P = 0·888) between the two surveys.
Table 1 Characteristics and dietary intake in the two surveys: Chinese patients with T2DM, Pudong New Area of Shanghai (two cross-sectional surveys were conducted in 2006 and 2011)
T2DM, type 2 diabetes mellitus; GI, glycaemic index; GL, glycaemic load.
*Paired χ 2 test or signed-rank test.
†Values are presented as mean and standard deviation.
Although dietary fibre intake at the second survey was significantly lower than that at the first one, the two measures of daily intake per 1000 kJ were significantly correlated with each other, with a Pearson correlation coefficient of 0·100 (P = 0·028).
As shown in Table 2, an inverse association of dietary fibre with glycaemic control status was observed in both cross-sectional surveys, with adjusted OR of uncontrolled glycaemic status across the tertiles of fibre intake being 1·00, 0·62 (95 % CI 0·44, 0·87) and 0·54 (95 % CI 0·37, 0·77) at the first survey (P trend < 0·001) and 1·00, 0·58 (95 % CI 0·36, 0·93) and 0·75 (95 % CI 0·46, 1·21) at the second survey (P trend = 0·261). Among 497 patients donating bio-specimens in both surveys, dietary fibre intake at the first survey was inversely associated with uncontrolled glycaemic status at the second survey. Compared with patients in the lowest tertile of intake, the adjusted OR of uncontrolled glycaemic status was reduced from 0·72 (95 % CI 0·43, 1·21) to 0·58 (95 % CI 0·34, 0·99) with increasing tertile of dietary fibre intake (P trend = 0·048). No similar association pattern was observed for GI or GL intake (data not shown in the table).
Table 2 Association of dietary fibre intake with glycaemic control status in Chinese patients with T2DM, Pudong New Area of Shanghai (two cross-sectional surveys were conducted in 2006 and 2011)
T2DM, type 2 diabetes mellitus; HbA1c, glycosylated haemoglobin A1c.
*The tertile cut-off points of dietary fibre intake at the first survey for all 934 participants were respectively 1·04 and 1·58 g/1000 kJ per d (4·35 and 6·64 g/1000 kcal per d) in men and 1·19 and 1·65 g/1000 kJ per d (4·97 and 6·92 g/1000 kcal per d) in women; and for the 497 participants at the first survey were respectively 1·02 and 1·61 g/1000 kJ per d (4·26 and 6·75 g/1000 kcal per d) in men and 1·18 and 1·66 g/1000 kJ per d (4·96 and 6·94 g/1000 kcal per d) in women; the tertile cut-off points of dietary fibre intake at the second survey for the 497 participants were 1·04 and 1·50 g/1000 kJ per d (4·37 and 6·30 g/1000 kcal per d) in men and 1·12 and 1·72 g/1000 kJ per d (4·67 and 7·19 g/1000 kcal per d) in women.
†Adjusted for age (continuous variable), gender (male/female), BMI (continuous variable), duration of T2DM (continuous variable), physical activity (active/inactive), drug use (no drug/hypoglycaemia drug only/insulin use, dummy variables), family history of diabetes (yes/no), carbohydrate intake per 1000 kJ/d (continuous variable) and energy intake (continuous variable).
‡The HbA1c level in the first survey (continuous variable) is adjusted for the association of dietary fibre intake per 1000 kJ/d at the first survey and glycaemic control status at the second survey.
Figure 1 presents the association of dietary fibre and HbA1c level by duration of T2DM. Generally, regardless of the duration of T2DM, patients with higher fibre intake had a lower level of HbA1c. The long-term effect of dietary fibre intake appeared more pronounced than the recent effect (Fig. 1(c) v. Fig. 1(a) and Fig. 1(b)) and the effect was more evident among patients with longer T2DM duration (Fig. 1(c)).
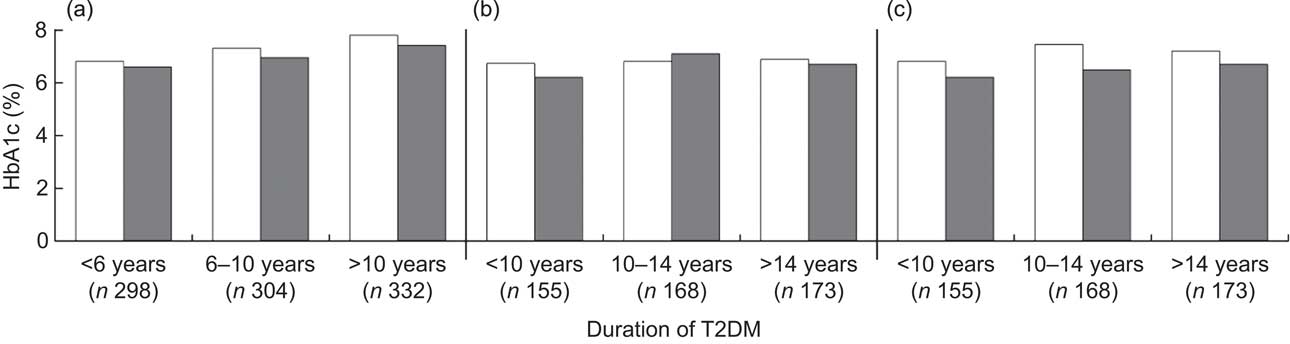
Fig. 1 Average level of glycosylated haemoglobin A1c (HbA1c) by dietary fibre intake (□, low fibre intake; ▪, high fibre intake) among Chinese patients with different duration of type 2 diabetes mellitus (T2DM), Pudong New Area of Shanghai (two cross-sectional surveys were conducted in 2006 and 2011). All P values from logistic regression models were adjusted for age (continuous variable), gender (male/female), BMI (continuous variable), regular exercise (ever/ never), drug use (no drug/hypoglycaemia drug only/insulin use, dummy variables), family history of diabetes (yes/no), carbohydrate intake per 1000 kJ/d (continuous variable) and energy intake (continuous variable). P values were: 0·054, 0·054 and 0·115, respectively, for patients diagnosed with T2DM for <6 years, 6–10 years and >10 years in (a); 0·045, 0·385 and 0·069, respectively, for patients diagnosed with T2DM for <10 years, 10–14 years and >14 years in (b); and 0·332, 0·032 and 0·088, respectively, for patients diagnosed with T2DM for <10 years, 10–14 years and >14 years in (c). In (a), both dietary fibre and HbA1c level were measured at the first survey; the median cut-off point for dietary fibre was 1·28 g/1000 kJ per d (5·37 g/1000 kcal per d) for men and 1·42 g/1000 kJ per d (5·94 g/1000 kcal per d) for women. In (b), both dietary fibre and HbA1c level were measured at the second survey; the median cut-off point for dietary fibre was 1·24 g/1000 kJ per d (5·20 g/1000 kcal per d) for men and 1·36 g/1000 kJ per d (5·70 g/1000 kcal per d) for women. In (c), dietary fibre was measured at the first survey and HbA1c level was assayed at the second survey; the median cut-off point for dietary fibre was 1·25 g/1000 kJ per d (5·24 g/1000 kcal per d) for men and 1·44 g/1000 kJ per d (6·03 g/1000 kcal per d) for women
We further evaluated the association of the changes in dietary fibre intake with the changes in HbA1c level. As shown in Table 3, a borderline association was observed between the change in dietary fibre intake and HbA1c change. Specifically, each increase in tertile scores of dietary fibre intake was associated with a 0·138 % decrease in HbA1c level (β = −0·138; 95 % CI −0·002, 0·278; P = 0·054) and a 19 % (OR = 0·81; 95 % CI 0·65, 1·02) reduced risk of uncontrolled glycaemic status at the second survey (P trend = 0·070). The OR of uncontrolled glycaemic status were 1·16 (95 % CI 0·63, 2·13) and 1·71 (95 % CI 0·82, 3·60) for those with –1 and –2 decrease in tertile scores of fibre intake, and 0·58 (95 % CI 0·33, 1·00) and 1·15 (95 % CI 0·52, 2·54) for those with +1 and +2 increase in tertile scores, compared with those without change.
Table 3 Association of changes in dietary fibre intake and HbA1c level between the two surveys: Chinese patients with T2DM, Pudong New Area of Shanghai (two cross-sectional surveys were conducted in 2006 and 2011)
HbA1c, glycosylated haemoglobin A1c; T2DM, type 2 diabetes mellitus.
*Difference in tertile scores of dietary fibre intake between two surveys.
†Adjusted for age (continuous variable), gender (male/female), BMI (continuous variable), duration of T2DM (continuous variable), regular exercise (never/ever), drug use (no drug/hypoglycaemia drug only/insulin use, dummy variables), family history of diabetes (yes/no), carbohydrate intake per 1000 kJ/d (continuous variable), dietary fibre intake per 1000 kJ/d at the first survey (by tertiles, dummy variables), energy intake (continuous variable) and HbA1c level at the first survey (continuous variable).
‡Adjusted for age (continuous variable), gender (male/female), BMI (continuous variable), duration of T2DM (continuous variable), regular exercise (never/ever), drug use (no drug/hypoglycaemia drug only/insulin use, dummy variable), family history of diabetes (yes/no), carbohydrate intake per 1000 kJ/d (continuous variable), dietary fibre intake per 1000 kJ/d at the first survey (by tertiles, dummy variables), energy intake (continuous variable) and HbA1c level at the first survey (continuous variable).
Discussion
In the present study with two repeat surveys among Chinese patients with T2DM, higher dietary fibre intake was consistently associated with better glycaemic control status and showed a long-term protective effect on HbA1c level. To the best of our knowledge, the present study is the first that evaluates the effect of changes in dietary fibre intake on glycaemic status among Chinese diabetes patients. Our results provide preliminary evidence on the beneficial effect of fibre intake on glycaemic control and implicate the potential role of dietary fibre intake in prevention of diabetic complications in this population.
Dietary fibre has been shown to benefit human health in several ways( 11 ). The mechanism by which dietary fibre reduces the risk of T2DM and diabetes complications is not clear, however. It is suggested that a fibre-rich diet provides limited energy( Reference Rolls, Bell and Castellanos 21 ), has longer processing time in stomach( Reference Jenkins, Kendall and Augustin 22 ) and a low GI, which are considered the primary way for dietary fibre to affect glycaemic control( Reference Jenkins, Jenkins and Zdravkovic 23 , Reference Marangoni and Poli 24 ). Numerous experimental studies have indicated that viscous dietary fibres benefit immediate postprandial glucose metabolism and long-term glycaemic control( Reference Chandalia, Garg and Lutjohann 7 , Reference Anderson, Allgood and Turner 25 ).
Chinese adults usually consume more dietary fibre compared with their counterparts in other countries and regions( Reference Zhou, Stamler and Dennis 12 ). It is reported that dietary fibre intake among Chinese T2DM patients reaches the recommended level for Americans( Reference Yin, Zheng and Huang 13 ). In the present study focusing on insoluble fibre intake only, we found that the median intake of dietary fibre was 8·7 g/d (1·39 g/1000 kJ per d, i.e. 5·8 g/1000 kcal per d) at the first survey and 6·9 g/d (1·31 g/1000 kJ per d, i.e. 5·5 g/1000 kcal per d) at the second survey, which is less than the reported average intake in healthy Chinese adults( Reference Zhou, Stamler and Dennis 12 , Reference Villegas, Yang and Gao 26 ) and below the recommended level of 16 g/d (1·91 g/1000 kJ per d, i.e. 8 g/1000 kcal per d) for adults at high risk of T2DM( 6 ). Our study suggests that dietary fibre intake among Chinese diabetes patients may have been overestimated, although the data derived from that single study were not representative( Reference Yin, Zheng and Huang 13 ). Due to the lower average level of energy intake, however, it is also possible that the absolute intake of fibre was underestimated in the current study.
In the present study, the two measurements of dietary fibre intake were significantly correlated, although with a small correlation coefficient. Moreover, most participants had no or a ±1 score change in tertile scores between two surveys. These results indicate relatively stable dietary habits along the duration of the disease in patients. In both cross-sectional surveys and the small-scale prospective investigation, we consistently observed an inverse association between dietary fibre and glucose control status. We also observed an insignificant association of changes in dietary fibre intake with changes in HbA1c level. Interestingly, we found that the beneficial effect of dietary fibre in this patient population was slightly more pronounced among those with longer T2DM duration. These findings implicate a potential long-term protective effect of dietary fibre in Chinese diabetes patients and indicate a possible clinical significance of increasing dietary fibre intake in these patients.
In this population of patients, we did not observe a significant association of dietary GI and GL intake with glycaemic status, which was not consistent with previous studies( Reference Jenkins, Kendall and McKeown-Eyssen 8 , Reference Thomas and Elliott 27 , Reference Esposito, Maiorino and Di Palo 28 ). Due to the generally high correlation between dietary fibre and GI/GL, the null association of GI/GL with glycaemic status in this population is somewhat difficult to explain. Our results appeared not to support the notion that low GI or GL value is the primary way for dietary fibre to affect glycaemic control, and suggest mechanisms other than GI value. The inaccurate GI value for some Chinese foods may also partly explain the results.
There are several strengths in the present study. First of all, two repeat surveys following a similar protocol make it possible to evaluate the long-term effect of dietary fibre intake on glycaemic control status. The validated FFQ, a standardized protocol for body measurements and stringent quality control in laboratory assays on HbA1c level minimized the potential information bias.
However, the high dropout rate (45·6 %) in the second survey may have introduced selection bias and decreased the validity of our results. The participants of the second survey were older and more likely to use an oral hypoglycaemia drug and insulin, indicating that they had more severe disease or uncontrolled HbA1c level. Whether dietary fibre intake can elicit a long-term protective effect on these severe patients remains unknown. Moreover, the amount of dietary intake in both surveys seemed much lower than those reported previously( Reference Villegas, Yang and Gao 26 ), raising our concern on the possible recall bias. However, the potential underestimation of dietary intake, if any, would be more likely to result in a non-differential misclassification bias, which may have biased our results towards the null. Furthermore, most nutrients were significantly lower in the second survey than in the first one, which may be due to ageing of the patients and the progression of T2DM. However, recall bias cannot be excluded. In addition, the two surveys were conducted in different seasons, which may affect the results and partly explain the lower dietary fibre intake but higher fat intake in the second survey. It is also possible that generally the Chinese middle-aged and elderly residents took less plant foods and more animal foods, which led to a higher energy intake from fat( Reference Su, Wang and Wang 29 ). To minimize the recall bias, we used energy-adjusted dietary fibre intake in the analysis and defined the changes in dietary fibre intake between the two surveys specifically as the difference in tertile scores instead of the difference in amount of intake.
In summary, our study provides suggestive evidence on the beneficial effect of dietary fibre on glycaemic control among Chinese diabetes patients. A well-designed cohort study or a randomized controlled trial is warranted to confirm our findings.
Acknowledgements
Sources of funding: This study was funded by the Shanghai Municipal Health Bureau (grant numbers 12GWZX1010 and GWDTR201204), the Academic Leaders Training Program of Pudong Health Bureau of Shanghai (grant number PWRd2010-03), and FDUROP project of Fudan University. The funders had no role in the design, analysis or writing of this article. Conflicts of interest: All co-authors declare that they have no competing interests. Ethics: The study was approved by Fudan University Institutional Review Board (IRB00002408, FWA00002399). Authors’ contributions: L.X.Y. and L.S. contributed to data collection, data analysis and drafting of the paper. J.Y.J., H.Q., Y.Z., H.Y.W. and L.M.Y. contributed to data collection and quality control. G.Y.Q. contributed to data analysis. G.M.Z., Q.W.J. and Q.S. contributed to revision of the paper. X.N.R. and W.H.X. contributed to study design, statistical analysis and revision of the paper. Acknowledgements: The authors are grateful to the study participants and research staff from Community Health Centers in Pudong New Area of Shanghai, China.


