


Introduction
Habitat loss, degradation and fragmentation resulting from deforestation is a principal driver of biodiversity loss across various spatial scales worldwide (Bowen et al. Reference Bowen, McAlpine, House and Smith2007; Ceballos et al. Reference Ceballos, Ehrlich and Dirzo2017; Miller and Cale Reference Miller and Cale2000), especially in tropical forests (Hansen et al. Reference Hansen, Potapov, Moore, Hancher, Turubanova, Tyukavina, Thau, Stehman, Goetz, Loveland and Kommareddy2013). In most of Central America, for example, little remains of intact primary forest (Reid et al. Reference Reid, Harris, Martin, Barnett and Zahawi2008; Sigel et al. Reference Sigel, Sherry and Young2006). Tropical regions generally support exceptional species richness (MacArthur Reference MacArthur1972), including a higher diversity of birds (Davies et al. Reference Davies, Orme, Storch, Olson, Thomas, Ross, Ding, Rasmussen, Bennett, Owens and Blackburn2007; Storch et al. Reference Storch, Davies, Zajícek, Orme, Olson, Thomas, Ding, Rasmussen, Ridgely, Bennett and Blackburn2006). Thus, tropical deforestation presents a grave threat to the preservation of biological diversity, natural community assemblages and ecosystem functions (Ceballos et al. Reference Ceballos, Ehrlich and Dirzo2017).
Costa Rica is currently considered a reforestation hotspot (Nanni et al. Reference Nanni, Sloan, Aide, Graesser, Edwards and Grau2019) in which human-facilitated reforestation outpaces forest removal (Zahawi et al. Reference Zahawi, Duran and Kormann2015). Some areas have seen recent increases in local forest cover facilitated by active reforestation efforts and human demographic trends potentially alleviating pressures on tropical forest ecosystems (Aide and Grau Reference Aide and Grau2004; Aide et al. Reference Aide, Clark, Grau, López-Carr, Levy, Redo, Bonilla-Moheno, Riner, Andrade-Núñez and Muñiz2013; Joseph Wright and Muller-Landau Reference Joseph Wright and Muller-Landau2006; Nagendra Reference Nagendra2007). The Bellbird Biological Corridor project, initiated in 1998, aims to create a corridor of forest from the continental divide to the Pacific Coast (Monteverde Institute 2017). The Premontane Wet Life Zone in the Monteverde region has been a focal point of the project because of the past actions of forest clearance for agriculture, and because this habitat type supports high species richness and high rates of endemism in Costa Rica (Kohlmann et al. Reference Kohlmann, Roderus, Elle, Solís, Soto and Russo2010). However, the value provided to bird communities by early-successional forests in the Premontane Wet Life Zone, such as those created by reforestation programmes, remains unclear.
Conservation initiatives in terrestrial systems have largely underestimated the importance of conserving previously degraded early successional or other secondary habitats which may support unique species assemblages (Sandoval et al. Reference Sandoval, Morales, Ramírez-Fernández, Hanson, Murillo-Hiller and Barrantes2019). In fact, in some ecosystems, early successional habitats may support greater biodiversity and/or abundances of particular taxa than mature habitats (Almazán-Núñez et al. Reference Almazán-Núñez, Charre, Pineda-López, Corcuera, Rodríguez-Godínez, Álvarez-Álvarez and Méndez Bahena2018; Acevedo-Charry and Aide Reference Acevedo-Charry and Aide2019; Sheil and Burslem Reference Sheil and Burslem2013). Moreover, whereas in pristine natural landscapes, early successional habitats occupy only a small proportion of the total landscape, the expansive anthropogenic conversion of subtropical/tropical lowland and montane forest has dramatically altered natural ecological successional dynamics (Sandoval et al. Reference Sandoval, Morales, Ramírez-Fernández, Hanson, Murillo-Hiller and Barrantes2019). Thus, remaining tropical forests may, in the future, be dominated by secondary and early successional stages (Aide and Grau Reference Aide and Grau2004; Joseph Wright and Muller-Landau Reference Joseph Wright and Muller-Landau2006). Previous work has suggested potential conservation value for these forests (Cannon et al. Reference Cannon, Peart and Leighton1998; Hughes et al. Reference Hughes, Edwards, Sayer, Martin and Thomas2020; Lawton et al. Reference Lawton, Bignell, Bolton, Bloemers, Eggleton, Hammond, Hodda, Holt, Larsen, Mawdsley and Stork1998), yet, these forests may lack adequate protections (Lennox et al. Reference Lennox, Gardner, Thomson, Ferreira, Berenguer, Lees, Mac Nally, Aragão, Ferraz, Louzada and Moura2018) even within Costa Rica (Reid et al. Reference Reid, Fagan, Lucas, Slaughter and Zahawi2019). Therefore, understanding community and population dynamics of tropical forest species across successional gradients represents a pressing need (Brown and Lugo Reference Brown and Lugo1990; Chazdon et al. Reference Chazdon, Peres, Dent, Sheil, Lugo, Lamb, Stork and Miller2009).
Within tropical forest ecosystems, birds are a group that has experienced marked population declines, causing substantial conservation concern (McKinnon et al. Reference McKinnon, Rotenberg and Stutchbury2015). For example, of the 3,168 neotropical birds classified as subtropical/tropical moist lowland and montane occupants, 385 species (12 per cent) are listed as Vulnerable (VU), Endangered (EN) or Critically Endangered (CR) (IUCN 2021). Within this group, wintering migrants may be particularly impacted, evidenced by macro-scale declines in migratory passage rates within the neotropical-nearctic migratory system (Davidson and Ruhs Reference Davidson and Ruhs2021, Kubelka et al. Reference Kubelka, Sandercock, Széekely and Freckleton2022; Rosenberg et al. Reference Rosenberg, Dokter, Blancher, Sauer, Smith, Smith, Stanton, Panjabi, Helft and Marra2019; Wilcove and Wikelski Reference Wilcove and Wikelski2008). Interestingly, tropical-wintering migrants have been shown to disproportionately use disturbed, edge, early successional and other putatively low-quality habitats in comparison to residents (Greenberg Reference Greenberg1995). On the other hand, old-growth tropical forests are important for maintaining both α- and β-diversity (Kormann et al. Reference Kormann, Hadley, Tscharntke, Betts, Robinson and Scherber2018). Thus, understanding how forest succession influences avian species diversity, abundance and migratory status may be useful for conservation planning and land management efforts.
We sought to understand avian community dynamics across a successional gradient created by reforestation efforts in what is today a partially restored tropical premontane wet forest in the Tilarán Mountains of Costa Rica. This region of Costa Rica has one of the highest levels of species richness and endemism in Costa Rica (Kohlmann et al. Reference Kohlmann, Roderus, Elle, Solís, Soto and Russo2010). However, little is known about whether these reclaimed lands are currently functional for the large diversity of migratory and resident bird species that inhabit the area. Therefore, we examined the effect of successional stage on overall abundance, species richness, diet niche, migratory status and community composition. We hypothesised that early successional forests would experience greater abundance(s) of birds driven by an increased proportional abundance of migrants in those treatments. We also predicted that community compositions would vary across successional stages. Finally, we quantified key vegetation structural variables to further elucidate trends in habitat across successional stages.
Methods
Study area
This study was conducted in Santa Elena, Costa Rica, near the Monteverde Cloud Forest Reserve in the province of Puntaranas (Figure 1). The hilly landscape is a patchwork of forest fragments at different stages of succession, cattle pastures and small settlements with small-scale coffee cultivation and other agricultural uses. Avian surveys were conducted along belt transects on the Pacific slope of the Tilarán range in the Premontane Wet Life Zone in Monteverde, Costa Rica. Study area elevation was approximately 1,400 m above sea level, and mean temperature ranges from 17 to 24° C (Hartshorn Reference Hartshorn and Janzen1983). Native forest, dominated by the Lauracea family, had been mostly removed for cattle grazing and small-scale agriculture. Forest restoration efforts began in the 1990s and continue today in an effort to create a connected corridor to the Pacific Ocean. Reforestation plots used in this study are part of a much larger project: the Bellbird Biological Corridor project. The plots used in this study were located on two private reserves, La Calandria and Nacimiento Y Vida, that were formerly pasture with some intact forest fragments. Both were adjacent to a gallery forest where native vegetation was unaltered.
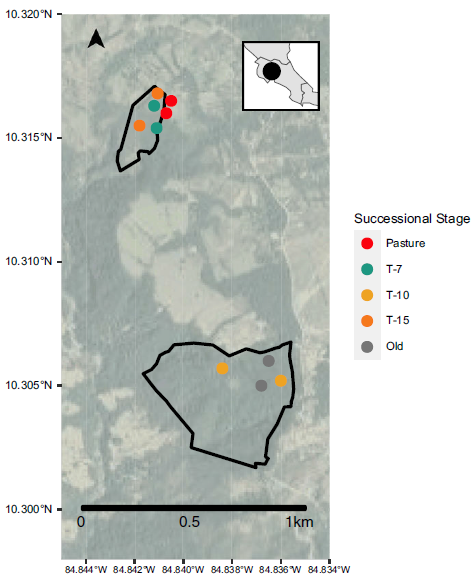
Figure 1. Study area map. Black polygons depict restoration sites with circles showing the transect locations (including two sites sampling pasture habitat just outside the restoration area boundary) coloured by successional stage.
Specific restoration treatments varied by location. Some plots were enhanced with fertilisers, and others had weedy plants removed, while some received no direct intervention. Transects for avian and vegetation sampling were established in three successional forests planted in 2003, 2008 and 2011, as well as primary forest patches and open pasture.
Transect surveys
We conducted repeated surveys along nine transects across five successional stages (Figure 1). Eight 100-m belt transects were established in primary forest (‘old’), pasture land (‘pasture’) and revegetated forest segments from 2003 (‘T-15’) and 2011 (‘T-7’). Two 50-m belt transects were located in revegetated forest segments initiated in 2008 (‘T-10’). Fifty-meter transects were necessary for the T-10 forest segments due to slightly smaller patch size and accessibility. For analysis, we treated these two transects as a single combined 100-m transect. Sampling occurred along established trails between February and May of 2018 with 1–2 sampling events per month resulting in a total of 64 transect surveys. We recorded all birds seen and heard but to account for imperfect detection, we restricted all observations to those occurring within 25 m of the observer and to individuals using the habitat (i.e., not simply ‘pass throughs’). One-hundred-metre transects were sampled for 30 minutes, and 50-m transects were sampled for 15 minutes (but were combined to make a single 30 minute, 100-m transect). All observations were made by a single observer familiar with identification of birds in this region.
Abundance
Using each transect survey event as the sample unit, we assessed the effect of successional stage on mean abundance of all birds by constructing two generalised linear mixed-effects models for mean overall abundance: (1) SUCC: mean avian abundance modelled as a function of successional stage; and, (2) INT: mean avian abundance modelled as a single fixed value (intercept only model). We used a log-link function on the response to account for the assumed Poisson distribution. Both models included a random effect of date on the intercept to account for variation in overall abundance as a function of season passage. We fit models in Program R (R Core Team 2018) using the package lme4 (Bates et al. Reference Bates, Mächler, Bolker and Walker2015). We then used information theoretics (AICc) to evaluate the relative support for each model and used coefficient estimates and associated likelihood profile-based 95% confidence intervals (CIs) to determine the effect of successional stage on avian abundance.
Species richness
We compared overall species richness across successional stages. We calculated and plotted total richness as the number of accumulated unique species for a given transect across all visits. We also calculated richness per transect as the total unique species observed at a site during a single visit. We compared mean richness per transect across successional stages with bootstrapped 95% CIs (10,000 replicates, bias-corrected, accelerated method) using the boot package in R (Canty and Ripley Reference Canty and Ripley2017; Davison and Hinkley Reference Davison and Hinkley1997). We considered mean proportions to be different if CIs were entirely non-overlapping.
Migratory strategy, diet breadth and conservation status
We assigned all observed species to migratory status (migratory or resident) based primarily on descriptions of migratory behaviours contained in the Handbook of the Birds of the World (del Hoyo et al. Reference del Hoyo, Elliott, Sargatal and Christie2019). When species exhibited multiple migratory behaviours across the range (e.g., partial migrants), we assigned that species to the status most relevant to the study area. In cases where migratory status remained ambiguous, we consulted local experts to assign final status (Hamilton pers. comm; Moreno pers comm.).
We also categorised each species as either omnivore or diet specialist based on the reported breadth of its primary diet during the season(s) of occupancy in the study area. We assigned species to the specialist group if their only or primary dietary guild was insectivore, granivore, frugivore, nectarivore or carnivore (vertebrate prey). Species that regularly consume food from more than one of these groups or forage opportunistically (e.g., scavengers) were assigned to omnivore. Diet breadth was again assessed using species accounts in the Handbook of the Birds of the World (del Hoyo et al. Reference del Hoyo, Elliott, Sargatal and Christie2019).
We evaluated whether the proportion of migrants or the proportion of specialists per transect varied between successional stages. We computed mean proportions for each successional stage and bootstrapped 95% CIs (10,000 replicates, bias-corrected, accelerated method) around those means using the boot package in R (Canty and Ripley Reference Canty and Ripley2017; Davison and Hinkley Reference Davison and Hinkley1997). We considered mean proportions to be different if CIs were non-overlapping.
Finally, we recorded the IUCN Redlist (IUCN 2021) status for each species observed and quantified the proportion of IUCN-listed species across successional stages. Because we observed so few IUCN-listed species, we restricted our analysis to simply reporting the number and proportion of each status observed per successional stage.
Community composition
We characterised community composition across successional stages using non-metric dimensional scaling (NMDS; Clarke Reference Clarke1993). NMDS is a non-parametric dimension reduction technique that relies on the ordination of dissimilarities across samples. To determine relative similarity/dissimilarity in abundance-corrected community composition between successional stages, we plotted a two-dimensional NMDS ordination based on Bray–Curtis dissimilarity in community composition (Bray and Curtis Reference Bray and Curtis1957). We treated each transect within a successional stage as a separate site (two per treatment for all but T-10 which had one transect) and repeated visits as replicates.
Vegetation succession
We considered four vegetation structural proxies for succession: tree height, tree diameter at breast height (DBH), relative shrub density and canopy openness. We measured these attributes in 5 m circular plots at randomly selected locations along each transect. All vegetation exceeding 3 m in height qualified as a tree. Height was either measured directly when possible with a tape measure or by triangulation with a rangefinder. DBH was measured with a DBH tape, and trees with multiple trunks were recorded as the sum of the individual DBH values for all trunks. Canopy openness was determined using a handheld demsiometer in the centre of each 5-m plot and was averaged for each cardinal direction. Finally, we used a scoring system to characterise the understory vegetation, whereby a score of 0 represents no understory vegetation, a score of 1 represented the understory as open but present, a score of 2 represented the understory as dense but passable by humans, and a score of 3 represented the understory as very dense and impassable.
We qualitatively evaluated trends in vegetative structure as a function of successional stage by plotting the sample distribution of each of these variables. We interpret findings about vegetation structure as suggestive of potential habitat drivers of observed trends in avian communities and abundances rather than directly inferred mechanisms.
Results
Transect surveys resulted in 659 unique observations. Censoring data to remove observations >25 m from the transect line and individuals not using the habitat (‘pass throughs’) resulted in a total of 389 observations across all sites. We observed a total of 61 species (Table S1).
Avian abundance as a function of successional stage
We found clear information theoretic support for modelling mean avian abundance as a function of successional stage (SUCC: AICc = 376.38, wt. = 1; INT: AICc = 439.06, wt. = 0). Mean abundance in the non-reforested pastures was 7.66 (95% CI: 5.73, 10.04) birds per count. Mean abundance was highest in the youngest successional stage (T-7; 10.10, 95% CI: 8.05, 13.64).
In fact, the estimated increase in mean abundance over the intercept for the T-7 successional stage was higher than all other successional stages (though CIs overlapped between T-7 and old; Table 1; Figure 2).
Table 1. Exponentiated coefficient estimates and profile-based 95% confidence intervals from generalised linear mixed-effects model with log link estimating mean abundance as a function of successional stage. Date were included as a random effect on the intercept to account for changes in abundance over time. Coefficient estimates for all successional stages except pasture represent offsets from the intercept (pasture) parameter; therefore, confidence intervals that do not overlap zero suggest differences in mean abundance as compared to pasture.


Figure 2. Mean abundance per transect based on linear mixed-effects model with a log link. Date included as a random intercept. Error bars show likelihood profile-based 95% confidence intervals. Values depicted represent a version of the model forced through the intercept to produce an estimate for each stage – see Table 1 for inferential estimates which considered each successional stage (and old growth) as an offset coefficient relative to unrevegetated pasture. Successional stages represent the years since succession began (‘Pasture’ indicates unreforested pasture; ‘Old’ indicates previously uncut forest).
Species richness as a function of successional stage
Total richness was highest in the T-7 successional stage (mean = 26.5, range = 23–30) and lowest in the T-15 stage (mean = 16.0, range = 10–22) and the old-growth stage (mean = 16.0, range = 13–19; Figure 3a). Per transect richness was also highest in the T-7 stage (mean = 7.40, CIs = 6.00, 8.80), though CIs were generally wide and were only non-overlapping between T-7 and old growth (Figure 3b).
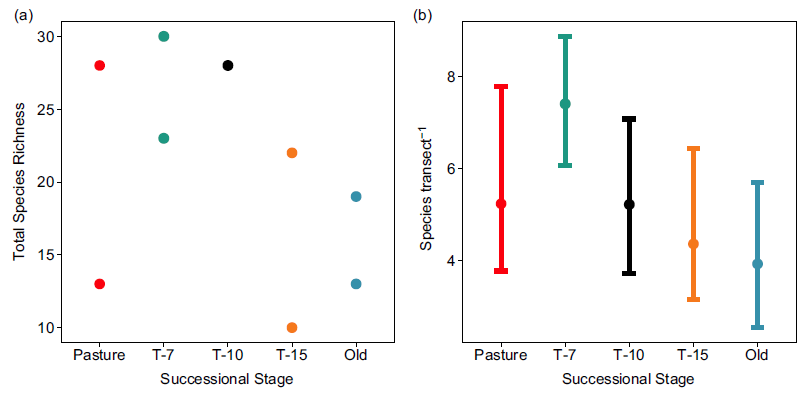
Figure 3. Species richness by successional stage. (a) Total species richness (total number of unique species observed per site across all sampling events) for each site (two sites per successional stage). (b) Mean diversity per transect across successional stages. Error bars show bootstrapped (10,000 replicates) 95% confidence intervals. Successional stages represent the years since succession began (‘Pasture’ indicates unreforested pasture; ‘Old’ indicates previously uncut forest).
Migratory status as a function of successional stage
Migrants made up a greater proportion of observations in the T-7 successional stage than any other stage (though CIs were overlapping between the T-7 and T-10 classes; Figure 4a). Pasture, T-10, T-15 and old-growth stages were all indistinguishable from one another with respect to the proportion of migrants on the basis of overlapping CIs (Figure 4a).
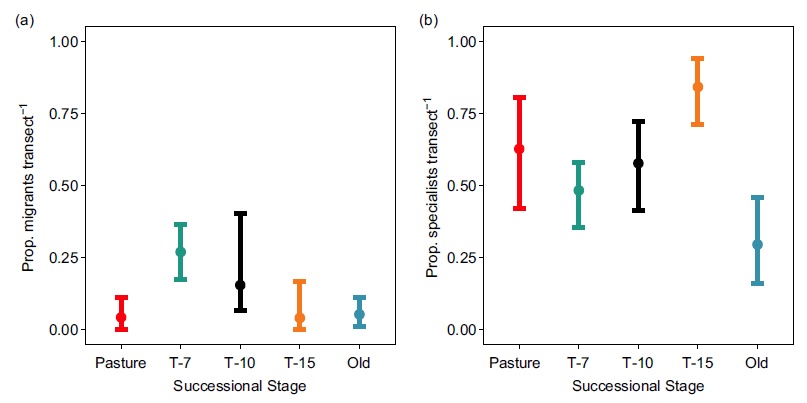
Figure 4. (a) Mean proportion of migrants per transect by successional stage during surveys performed in 2018. Error bars show bootstrapped (10,000 replicates) 95% confidence intervals. (b) Mean proportion of diet specialists (restricted to one diet category: insectivore, nectarivore, frugivore, granivore, herbivore and carnivore) per transect by successional stage during surveys performed in 2018. Error bars show bootstrapped (10,000 replicates) 95% confidence intervals. Successional stages represent the years since succession began (‘Pasture’ indicates unreforested pasture; ‘Old’ indicates previously uncut forest).
Diet breadth as a function of successional stage
We did not observe a clear trend in the proportion of specialists per transect as a function of successional stage (Figure 4). Old-growth forest showed the lowest proportion of specialists and CIs did not overlap between this stage and T-15 (but did for the other two stages). T-15 stage showed the highest proportion of specialists, but CIs were non-overlapping only with old growth and T-7.
Conservation status
Of the 389 total observations, only 4 (approximately 1%) consisted of IUCN-listed species. Three observations were Wood Thrush (Catharus skhskj) all observed on the same day in the earliest successional stage (T-7). The fourth observation was one Three-wattled Bellbird (Procnias tricarunculatus) observed in Pasture.
Community composition by successional stage
The NMDS plot of community composition (Figure 5) showed that pasture was by far the most unique community with large separation from the forested habitat types. The most frequently observed species in pasture included Black Vulture (Coragyps atratus; BLVU), Brown Jay (Psilorhinus morio; BRJA), Buff-throated Saltator (Saltator maximus; BTSA), Eastern Meadowlark (Sturnella magna; EAME), White-throated Magpie-jay (Calocitta formosa; WTMJ) and Yellow-faced Grassquit (Tiarisn olivaceus; YFGR). Within the forested habitat types, T-7 was distinct with the two T-7 plots being more similar to each other (closer in NMDS space) than to any other site. The most frequently observed species in the T-7 plots were Swainson’s Thrush (Catharus ustulatus; SWTH), Wood Thrush (Hylocichla mustelina; WOTH), Canada Warbler (Cardellina canadensis; CAWA), Olivaceous Woodcreeper (Sittasomus griseicapillus; OLWO) and Rufous-capped Warbler (Basileuterus rufifrons; RCWA). The most commonly observed species in the other forested plots were T-10: grey-crowned Yellowthroat (Geothlypis poliocephala; GCYE), grey-headed Chachalaca (Ortalis cinereiceps; GHEC), and Thicket Tinamou (Crypturellus cinnamomeus; THTI); T-15: Red-billed Pigeon (Patagioenas flavirostris; RBPI), Cabanis’s Wren (Cantorchilus modestus; CABW), and grey-crowned Yellowthroat; and, Old: Brown Jay, White-eared Ground-sparrow (Melozone leucotis; WEGS), Long-tailed Manakin (Chiroxiphia linearis; LOTM), and Rufous-capped Warbler. The full presence–absence matrix by transect is provided in Supplementary Information.
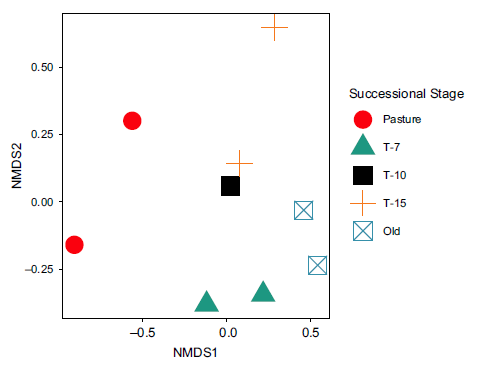
Figure 5. Non-metric dimensional scaling of community composition by successional stage. Symbols represent NMDS scores for each site in this study. Dissimilarities used were calculated using the Bray–Curtis method. Pasture clearly separates from the forested types, and each forested type shows clustering relative to other types.
Structural changes in vegetation with succession
The T-7 successional stage exhibited a consistently unique vegetative structure compared to both pasture and the later successional stages. The distribution of tree heights showed a trend towards both greater mean height and variance with increasing time since succession (Figure 6a), while DBH showed decreasing mode with increasing variance (Figure 6b). Intuitively, the right tail of each distribution also grew with successional stage as the largest trees continued to grow; of note is the striking difference in the range of heights at the T-7 reforestation stage (145, 500) compared to old-growth forest (200, 1200).
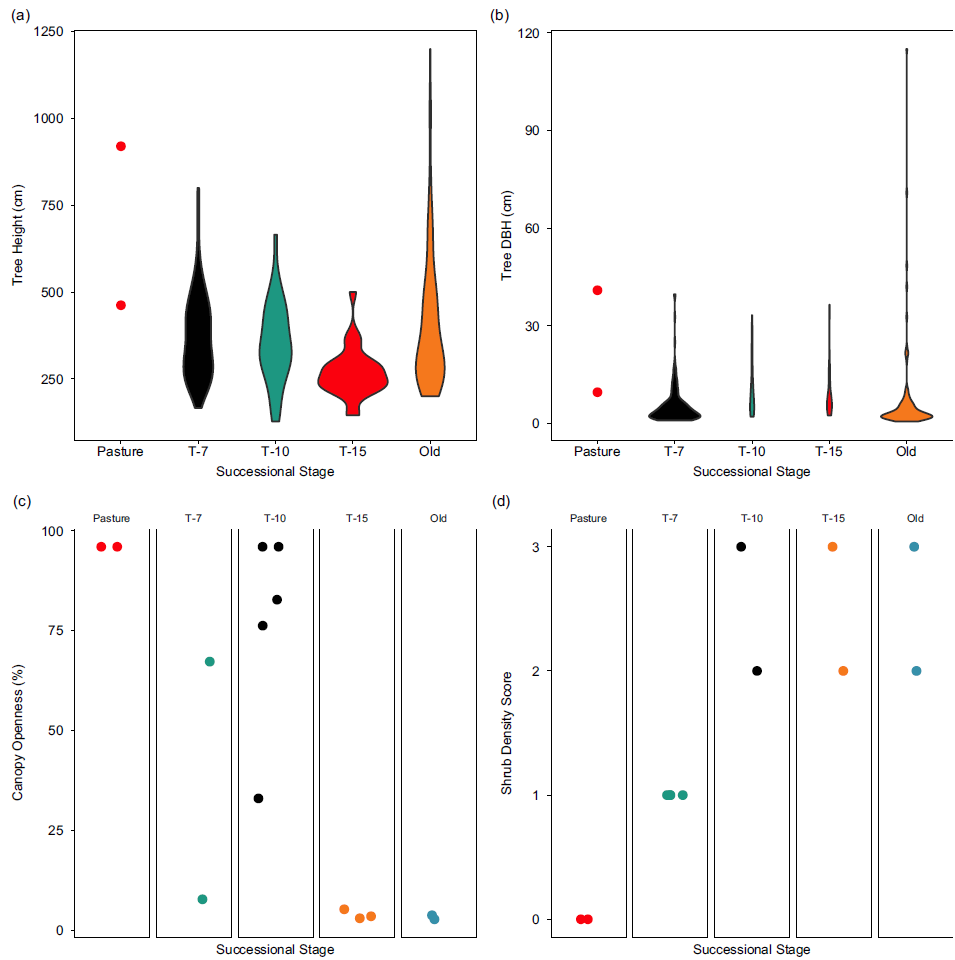
Figure 6. Vegetation structure by successional stage. (a) Violin plot of the sample distribution of tree heights across 10 sites in various stages of succession. (b) Violin plot of the sample distribution of tree diameters at breast height across 10 sites in various stages of succession. (c) Canopy openness measures for each individual site grouped by successional stage. (d) Shrub density scores for each site grouped by successional stage. 0 = no understory present, 1 = open understory, 2 = understory dense but passable by human, and 3 = very dense understory, impassable by human. Successional stages represent the years since succession began (‘Pasture’ indicates unreforested pasture; ‘Old’ indicates previously uncut forest).
The patterns in canopy openness were less clear (Figure 6c). Unsurprisingly, the pasture sites showed very high canopy openness, while both old growth and T-15 showed consistently low canopy openness. Between these stages, T-7 and T-10 stages showed highly variable canopy openness. Finally, shrub density was very low (absent) in pasture and dense in the older forest successional stages. Only the T-7 successional stage showed intermediate shrub density.
Discussion
Patterns of avian abundance and species richness in early successional forests are highly variable with forest types and community assemblage (Borges et al. Reference Borges, Tavares do, Crouch and Baccaro2021; Espejo and Morales Reference Espejo and Morales2019; Ribon et al. Reference Ribon, dos Santos, De Marco and Marini2021). In this study, we found that overall avian abundance, species richness, community composition and proportional occupancy by migrants varied by successional stage. Moreover, the earliest successional stage following the initiation of reforestation (T-7) showed the highest estimates for abundance and species richness (Figures 2, 3, Table 1). This stage also showed the greatest proportional use by migrant species (Figure 4). Broadly, these findings highlight the important role that early successional habitat can play in supporting bird communities.
Our observation of higher species diversity and avian abundance in the T-7 successional stage may be driven, at least in part, by an apparently unique community composition. The NMDS analysis in this study showed a unique community composition within the T-7 plots as compared to the other successional stages (Figure 5). This is broadly consistent with patterns seen in other settings. For example, secondary Amazonian rainforests (less than 10 years old) were the least similar in species composition to older secondary forests and old-growth forests (Andrade and Rubio-Torgler Reference Andrade and Rubio-Torgler1994). Similarly, second-growth lowland rainforest in Costa Rica has been shown to support greater species richness than old growth (Blake and Loiselle Reference Blake and Loiselle2001). Because we assumed the probability of detections to be constant across species and sites, our study does not disentangle the possible role of differential detection processes. However, we censored observations recorded more than 25 m from the transect (which represents the distance wherein we expect auditory and visual detection rates to be roughly equivalent across sites). However, we cannot entirely eliminate the possibility of treatment-varying detection processes which could bias some of our findings. Thus, forests in early stages of succession appear to be important for maintaining and increasing biodiversity in a given area.
These trends in abundance and diversity may also be related to occupancy of early successional habitats by wintering migrants. Early successional habitats in this study hosted a greater proportion of migrants than both pasture and older forest types (Figure 4). This result is consistent with previous findings, suggesting that habitat heterogeneity mediates interspecific competition arising from seasonal influxes of migrants to tropical landscapes. Migrants arriving on wintering grounds encounter a landscape currently occupied by year-round residents, with whom they must compete for access to resources (Greenberg Reference Greenberg1995; Ricklefs Reference Ricklefs, Hagan and Johnston1992). In the case of many areas in the Neotropics, mean arthropod abundances are lowest during the period of co-occupancy by residents and migrants, potentially intensifying competition (Greenberg Reference Greenberg1984, Reference Greenberg1995). The Breeding Currency Hypothesis (BCH) posits that migrants alleviate competition with resident species by occupying habitats containing resources that are sufficient for survival but not reproduction (Greenberg Reference Greenberg1995; Johnson et al. Reference Johnson, Sherry, Strong and Medori2005). Thus, the BCH would predict a higher proportion of migrants in early successional or marginal habitats, which is what we observed in this study. Future studies extending on our work to consider trends in avian abundance, diversity and community composition as potentially dynamic across seasons may assist in estimating the degree to which our findings are driven by temporary occupancy of these habitats by wintering migrants.
We also observed the lowest proportion of diet specialists in old-growth forest. This finding is counterintuitive, yet consistent with previous reports showing a higher proportion of generalists in old-growth forests than in successional forests (Boyle and Sigel Reference Boyle and Sigel2015; Bradfer-Lawrence et al. Reference Bradfer-Lawrence, Gardner and Dent2018; Powell et al. Reference Powell, Stouffer and Johnson2013; Stouffer et al. Reference Stouffer, Cockle, Aleixo, Areta, Barnett, Bodrati, Cadena, Di Giacomo, Herzog, Hosner and Johnson2011). This result too may be related to differential occupancy of old growth and successional habitats by migrants and residents. Generally, migrant species tend to conserve niches across seasons, whereas residents more frequently engage in niche-switching between seasons (Gómez et al. Reference Gómez, Tenorio, Montoya and Cadena2016; Nakazawa et al. Reference Nakazawa, Peterson, Martínez-Meyer and Navarro-Sigüenza2004; Zurell et al. Reference Zurell, Gallien, Graham and Zimmermann2018). Thus, migrant species may tend towards diet specialisation as compared to non-migratory species. If so, the greater proportion of migrants we observed in early successional habitats may explain the relatively low proportion of dietary specialists we observed in old-growth forest. We also note that our diet guild classification was somewhat coarse and may mask more complex facets of dietary specialisation (e.g., foraging behaviour, target prey, etc.).
Patterns of vegetation structure across successional stages also mimicked the unique patterns we observed in avian community composition and abundance. In the early successional forest, the density of shrubs and the degree of canopy openness were intermediate between open pasture and older successional forests, whereas DBH and tree height were more uniform. Together, these variables revealed a unique forest structure when compared to other successional stages. It is unclear from our data whether the inhabitants of these early successional forests are specifically targeting this habitat type for occupancy due to, for example, food resource abundances (as in Conway et al. Reference Conway, Powell and Nichols1995), or if these stands represent marginal habitat only suitable for non-breeding occupancy (see above). Vegetation structure in tropical forests has been shown to be only weakly linked to understory bird abundance and species richness (Cabral et al. Reference Cabral, Faria and Morante-Filho2021), and no difference in winter survival rates were observed in four neotropical migrant species between early successional forests and mature forests (Conway et al. Reference Conway, Powell and Nichols1995).
Whatever the underlying mechanism, our finding that avian communities differed across successional stages in our study highlights the potential importance of considering faunal inhabitants in addition to the vegetation when evaluating the effects of forest restoration activities. For example, vegetation morphometrics alone are often used to evaluate the success of forest recovery efforts. However, consideration of faunal occupancy of recovering habitats can provide additional information on the success of forest recovery and a more holistic picture of ecosystem restoration. For example, our findings highlight the potentially important role played by early successional habitats in this landscape in supporting overwintering neotropical migrants and dietary specialist species. To this point, successional heterogeneity may be important for supporting diverse avian communities at landscape scales and simple metrics evaluating progress towards old-growth status may underestimate the importance of successional heterogeneity. For example, temperate secondary forests have been shown to disproportionately benefit avian species of conservation concern (Kamp et al. Reference Kamp, Trappe, Dübbers and Funke2020). Our analysis revealed a unique community assemblage and high avian abundance and diversity in early successional forest.
Despite the apparently important role that secondary forests play for both resident and migratory birds, they lack the same protections in Costa Rica that old-growth forests have in place. One recent study showed that 50% of secondary forests are cleared within 20 years of when they were first observed (Reid et al. Reference Reid, Fagan, Lucas, Slaughter and Zahawi2019). Given the unique avian communities (including wintering migrants) and high diversity these habitats apparently support, conservation efforts directed towards early successional habitats may benefit birds on landscape scales. It is worth noting, however, that the conservation value of secondary forests is highly context-dependent and landscape juxtaposition – and proximity to old-growth patches, in particular – can substantially affect ecosystem processes in successional forests (César et al. Reference César, Moreno de, Coletta, Schweizer, Chazdon, Barlow, Ferraz, Crouzeilles and Brancalion2021; Chazdon et al. Reference Chazdon, Peres, Dent, Sheil, Lugo, Lamb, Stork and Miller2009). Early-stage successional forest in other locations may not show this same pattern if it is not in close proximity to pristine forests (Helmer Reference Helmer2000; Martínez-Ramos et al. Reference Martínez-Ramos, Pingarroni, Rodríguez-Velázquez, Toledo-Chelala, Zermeño-Hernández and Bongers2016).
We also note that while we treat time since initiation of restoration as the primary predictor variable of interest, it is important to note that restoration was not implemented uniformly across sites. Thus, caution is warranted in interpreting these results because some of the variance we observed in, for example, avian community composition or abundance may be attributable (at least in part) to specific restoration activities and not successional stage per se. However, the distinct vegetation structure we observed across sites suggests that successional trajectory (interpreted as both the time since initiation of succession and the specific restoration implementation) has resulted in variance in habitat structure with concomitant variance in avian community and abundance metrics. Future work disentangling the effects of successional stage (time only) and specific restoration interventions would provide valuable insight into both the implicit effects of natural succession and the effects of specific management actions on bird communities. Similarly, successional trajectories may be site- and ecosystem-specific. For example, a study of fossil pollen in tropical regions showed that forests in Central America recover faster from disturbance than forests in South America (Cole et al. Reference Cole, Bhagwat and Willis2014). Thus, the results here may not generalise to specific successional time frames in other environments. Finally, we note that our study only sampled nine transects within a portion of a single year. Future studies with more extensive sampling regimes would be helpful in clarifying how broadly these findings apply. Specifically, we suggest sampling a longer portion of the annual cycle with greater spatial replication and/or testing whether these effects hold across multiple sites or forest types.
In this study, we found that early successional pre-montane wet forest in Costa Rica apparently supported higher avian abundance, greater taxonomic diversity and a higher proportions of over-wintering migrants as compared to both open pasture and more mature forests. This finding highlights the potential importance of early successional forests in supporting diverse avian communities and suggests the need for additional consideration of such habitats in conservation and management planning. In particular, the potential value of these early successional habitats for wintering neotropical migrants warrants additional study, especially as these species come under increasing conservation concern.
Supplementary material
To view supplementary material for this article, please visit https://doi.org/10.1017/S0266467423000093
Data and code availability
Code used to process and analyze data and produce all figures in the manuscript can be accessed at: https://github.com/syanco/monta_verde_succession/. All data used in this manuscript can be downloaded at: https://osf.io/65pby/
Acknowledgements
We are thankful to the many individuals that contributed their time and expertise to the completion of this project. We thank Rafael Vargas for his expertise on the birds of Monteverde and his dedicated time to data collection. We also thank Kyndal Mallory and Kat Bonfiglio for their assistance with the collection of vegetation morphometrics. This project would not have been possible without the collaboration of individuals from the Monteverde Institute, especially Dr. Debra Hamilton and Luisa Moreno and, faculty and students from the Metropolitan State University of Denver that contributed to preliminary studies, particularly Dr. Jennifer Gagliardi-Seeley and Dr. Nels Grevstad, Vinson Turco, Ricky Martinez, Ashleigh Nakata, Stacey Fuller, Kevin Dykstra, and Shane Way. Finally, I would like to thank Dr. Catherine Ortega and Dr. Andrea Cortina for their thoughtful reviews and suggestions on the paper prior to submission. This study was financed by the College of Letters Arts and Sciences and the Department of Biology, the Metropolitan State University of Denver. SY was partially funded by the Max Planck – Yale Center for Biodiversity Movement and Global Change. Research permit granted by the ministerio de ambiente y energía, Sistema nacional de áreas de conservación, Costa Rica (108-2017-ACAT).
Author contributions
Author contributions following CRediT format are as follows. CC: Conceptualisation, Methodology, Investigation, Writing – Original Draft, Writing – Review & Editing, Supervision, and Funding acquisition; SY: Methodology, Formal analysis, Data Curation, Visualisation, Writing – Original Draft, and Writing – Review & Editing.


