

“At the order of the most glorious [governor] it has been determined that the poll tax will be levied … and I am worried that this will scare them.”
Athanasios, (Coptic) head of Hermopolis district in Upper Egypt, in a letter to his subordinate Shenoute, 3 March 644 ce (cited in Sijpesteijn Reference Sijpesteijn2013, p. 73).Differences in socioeconomic status (henceforth, SES) between religious groups have been an intriguing topic in social sciences since at least Max Weber’s seminal work on Protestantism (1905). Explanations of the phenomenon abound. Weber traced the Protestant-Catholic SES gap to a causal impact of religious beliefs that operates through a Protestant work ethic, and, extending his thesis to Asia, he argued that Asiatic religions were less conducive to capitalism. More recently, scholars of the economics of religion, while acknowledging the endogeneity of religion, attempted to disentangle its impact on SES in cross-country studies, such as Robert Barro and Rachel McCleary (Reference Barro and McCleary2003), or in single-country studies that emphasized the human capital channel, such as Vani Borooah and Sriya Iyer (Reference Borooah and Iyer2005), Sasha O. Becker and Ludger Woessmann (Reference Becker and Woessmann2009), and Latika Chaudhary and Jared Rubin (Reference Chaudhary and Rubin2011). A different explanation that remains far less studied is that of self-selection of converts on SES. An early example of this hypothesis is to be found in Weber (Reference Weber, Gerth and Martindale1958, p. 6), who noted that conversions to Christianity and Islam in India came from the lower Hindu castes. Recently, Maristella Botticini and Zvi Eckstein (Reference Botticini and Eckstein2005) hypothesized that Rabbinic Jews with a lower taste for education converted out of Judaism because of its emphasis on literacy, with the remaining Jews forming a better-off minority.
Inspired by the selection conjecture, this article hypothesizes that self-selected conversions were an important cause of the inter-religious SES gap in Egypt, one of the largest Middle Eastern countries. Newly digitized data from Egypt’s population censuses of 1848 and 1868 reveal that, among adult employed men, 33 percent of Copts (Egyptian Christians; 7 percent of Egypt’s population) worked in white-collar jobs, compared to 14 percent among Muslims.Footnote 1 This phenomenon is striking if we take into account that Egypt was Coptic Christian before the Arab Conquest in 641, and, since in- and out-migration were limited, Egypt’s “Copts” and “Muslims” are mostly descendants of the pre-641 “Coptic” population who either chose to remain Coptic or to convert to Islam (converts could not switch back to Christianity due to the death penalty of apostates in Islam). Bearing this fact in mind, I argue that Copts’ conversion to Islam between 641 and 1868 was characterized by selection on SES due to the tax system. Upon the Conquest, Arabs imposed an annual poll tax on every adult free Coptic male, which was enforced until 1856. As conversion freed Copts from the poll tax liability, and since the conversion incentive was decreasing in income owing to the (quasi) lump-sum feature of the tax, I hypothesize that the tax caused the conversion of poorer Copts, leading Copts to shrink into a better-off minority. Restrictions on apprenticeships and schooling imposed by each religious group led the initial selection to perpetuate thereafter. There are a few distinguishing features of this hypothesis. Unlike Weber (Reference Weber, Gerth and Martindale1958) who did not specify a selection mechanism of converts, selection is caused here by an economic incentive, the tax exemption. This incentive is distinct from the religious incentive to read the Bible in Botticini and Eckstein (Reference Botticini and Eckstein2005). And unlike the latter article, the persistence of the Coptic-Muslim SES gap is explained by group restrictions on acquiring skills and not by Copts’ higher preference for human capital.
The article contributes to a century-long debate on the Middle East. It has been long documented, albeit qualitatively, that native non-Muslim minorities of Egypt, Iraq, Jordan, Lebanon, Palestine/Israel, and Syria have, on average, higher SES than the Muslim majority (Tagher Reference Tagher1951; Issawi Reference Issawi1981; Courbage and Fargues Reference Courbage, Fargues and Mabro1997). Inspired by major papyri discoveries from early Islamic Egypt, pioneering early-twentieth-century scholars such as Julius Wellhausen (Reference Wellhausen and Weir1902), Carl Becker (Reference Becker1902), Harold Bell (Reference Bell1910), and Adolphus Grohmann (Reference Grohmann1932), emphasized the tax incentive of conversion to Islam under the early Arab Caliphate. Two Coptic chronicles dating from the seventh and ninth centuries (and uncovered around 1900) lent support to their theory as they included narratives of tax-induced conversion waves that were not mentioned by the Arabic sources.Footnote 2 The hypothesis of tax-induced conversions triggered fierce debates among historians. While scholars such as Gladys Frantz-Murphy (Reference Frantz-Murphy and Conrad2004) and Yossef Rapoport (Reference Rapoport2004) endorsed the hypothesis,Footnote 3 others such as Daniel Dennett (Reference Dennett1950), Kosei Morimoto (Reference Morimoto1981), and Petra Sijpesteijn (Reference Sijpesteijn2013) took a cautious stance in light of the growing papyri discoveries that suggested that conversions in Egypt may not have started until the mid-eighth century. A third group argued that conversions occurred even later for other causes including the suppression of Coptic tax revolts in the ninth century (Al-Maqrizi Reference Al-Maqrizi and Sayyid2002 [1500]; Mikhail Reference Mikhail2004) and state persecution in 1250–1517 (El-Leithy Reference El-Leithy2005), while a fourth group contended that it was Islam’s appeal that attracted converts (El-Shayyal Reference El-Shayyal1966). Despite this large body of scholarship, and partially due to data limitations, the “conversion” literature did not address the SES advantage of the surviving non-Muslim minorities, a task that was left to a separate body of (qualitative) literature, and so the impact of taxation on the inter-religious SES differences has remained a black box. As a result of this omission, neither the regressivity of the poll tax nor the possibility of selection-on-SES of converts, a logical consequence of tax regressivity, was examined by this literature, with the exception of a conjecture in Youssef Courbage and Philippe Fargues (Reference Courbage, Fargues and Mabro1997, pp. 22–23). The novelty of this article is thus manifold. It hypothesizes that taxation led to self-selected conversions (and not simply, conversions); this distinguishes taxation from the other causes of conversion that did not necessarily trigger self-selection of converts. Furthermore, the article draws on economic theory, empirics, and novel data in order to test this hypothesis. The article also provides the first quantitative evidence on Copts’ population share and the Coptic-Muslim SES differential in Egypt in both the medieval period and the mid-nineteenth century. This is, to the best of my knowledge, the first empirical test of self-selected conversions not only in the Middle East, but more generally.
The long-term trends of the poll tax, Copts’ population share, and the Coptic-Muslim SES gap, are broadly consistent with the selection hypothesis. To construct these trends, I draw on novel data sources including a village-level dataset on Christian churches and monasteries in 1200 and 1500, an individual-level dataset on occupations and religion in 641–969 (N = 402) from Egyptian papyri, and two nationally-representative samples of Egypt’s population censuses of 1848 and 1868 that I digitized at the National Archives of Egypt and that are among the earliest pre-Colonial censuses from any non-Western country.Footnote 4 The trends suggest that the higher poll tax rate before 1250 was correlated with a decline in Copts’ population share and the emergence of a Coptic-Muslim SES gap as farmers and unskilled Copts were more likely to convert, but that conversions subsided afterwards as the tax rate declined.
Since taxes were administered at the local level, the econometric evidence on the hypothesis is based on exploiting the cross-district variation in the average poll tax that is observed in the extant papyrological individual-level poll tax payment records (N = 408) in 641–1100. Tax papyri are subject to certain caveats, however. They survived for only four out of 42 kuras (Egypt’s administrative units in 641–1036) that map into 11 out of 76 districts in 1848–1868, all located in the Nile Valley, and most papyri are dated within a range, such as a century, rather than a specific date. There are two outcomes of interest. The first is Copts’ population share, which I measure in 1200 and 1500 by the village-level presence of at least one Coptic church or monastery, and in 1848–1868 by the individual-level religious affiliation in the population census samples. The second outcome is the Coptic-Muslim SES (occupational) gap, which I am able to observe at the district level in only 1848–1868, but not before.
I first employ an ordinary least squares (OLS) strategy where I control for a host of pre-641 district-level characteristics. I then use an instrumental variable (IV) strategy to account for the potential endogeneity of the poll tax, where I use the distance to ‘Arish, the first town to be captured by Arabs in 639, as an IV. This is based on the argument that Arabs in 700–969 were more likely to settle in districts that were closer to ‘Arish, although there were exceptions to this general pattern.Footnote 5 In these districts, the argument goes, tax enforcement was stricter, as Arab settlers were more likely to replace Coptic elites in administering taxes. The findings from both the OLS and IV estimates lend support to the selection hypothesis. I document that compared to Copts in “low-tax” districts, Copts whose origin is in a “high-tax” district are relatively fewer in 1200, 1500, and 1848–1868, but differentially more likely to be artisans and white-collar workers in 1848–1868. Since all districts were (almost) 100 percent Coptic in 641, the findings suggest that high-tax districts witnessed relatively more conversions and a more extensive selection-on-SES that resulted in a greater Coptic-Muslim SES gap.
The empirical evidence indicates that the initial positive selection of non-convert Copts persisted for over a millennium. I argue that this is likely due to group restrictions on apprenticeships and schooling. However, due to data limitations, the evidence on this mechanism rests on theory and history. As conversions sorted Copts and Muslims on occupations, each group then attempted to exclude the other from the artisanal and white-collar occupations in which it was over-represented. They did so via limiting apprenticeships and schooling within group members. The consequent Coptic-Muslim differences in human capital were later altered in favor of Copts, with the expansion of European schooling after 1850, and then in favor of Muslims, with the introduction of public mass education a century later in 1951–1953.
There are alternative theories that can explain the decline in Copts’ population share and both the formation and persistence of the Coptic-Muslim SES gap. I discuss some of these theories, where I argue that they are either complementary to the selection hypothesis or inconsistent with the historical evidence. I do not claim though that taxation was the sole cause of conversions between 641 and 1200, but that, compared to the other causes, taxation offers a consistent answer to both conversions and the Coptic-Muslim SES gap. I do not claim either that there were no other historical processes, besides group restrictions on skills, that affected the Coptic-Muslim SES gap. To be sure, state policies throughout Egypt’s history and European influence starting from 1800 had their effects, and I examine some of these effects in other work.
Besides the literature on religion and SES and the historical literature on conversions in the Middle East, the article contributes to the literature on institutions and cultural beliefs, both in general (North Reference North1990; Greif Reference Greif1994; Sokoloff and Engerman Reference Sokoloff and Engerman2000; Acemoglu, Johnson, and Robinson Reference Acemoglu, Johnson and Robinson2001; Nunn Reference Nunn2008; Dell Reference Dell2010; Tabellini Reference Tabellini2010; Acemoglu, Cantoni, Johnson, et al. Reference Acemoglu, Cantoni and Johnson2011) and in the Muslim World (Kuran Reference Kuran2004b; Blaydes and Chaney Reference Blaydes and Chaney2013; Carvalho Reference Carvalho2013; Jha Reference Jha2013; Meyersson Reference Meyersson2014; Artunç Reference Artunç2015). I document that Egypt’s taxation shaped religious adherence and inter-group SES inequalities that persisted for over 12 centuries. The persistence of the Coptic-Muslim SES gap is consistent with the literature on SES persistence across multiple generations (Long and Ferrie Reference Long and Ferrie2013; Clark Reference Clark2014).
Two final remarks about the article’s argument are important to mention. First, Copts were not a political elite minority. In fact, in 1848–1868 half of Copts were farmers and unskilled workers, and Muslims (mostly Turks) monopolized top political elite positions. The highest white-collar positions that Copts reached were limited to mid-low bureaucracy such as scribes, accountants, and land tax collectors. However, the article seeks to understand why Copts were richer, on average, than Muslims. Second, the article does not claim to generalize its hypothesis beyond Egypt as we know little about the formation processes of other non-Muslim minorities in the Middle East, such as Greeks, Armenians, Karaite Jews, Rabbinic Jews, and Levantine Christians. However, understanding the origins of Copts’ privilege over Muslims is valuable because Copts are the largest non-Muslim minority (in absolute number) in the region, because unlike other non-Muslims who were mostly urban and traders, Copts’ spatial and occupational distributions exhibited greater variation that allows testing the selection hypothesis, and because using the medieval papyri advances our knowledge of this phenomenon instead of relying on often subjective narratives.
Historical Background
Islamization of Egypt
Christianity reached Egypt in the first century and the last pocket of paganism was Christianized by the sixth century. The Coptic Christian church, followed by the Egyptian masses, split from the Byzantine church in 451. Yet, Greeks and Hellenized Egyptians stayed loyal to the Byzantine church forming a parallel church, the Melkite church. Condemned as heretics, Copts were persecuted by the Byzantines until the Arab Conquest in 641. On the eve of the Conquest, Copts constituted the majority of Egyptians, with non-Coptic Christians and Jews forming two mostly urban minorities (see Footnote footnote 14).
Following the Conquest, non-Muslims shrank from 100 percent of Egypt’s population in 641 to 7 percent in 1897. Yet, in the absence of published statistics on Egypt’s religious composition before the 1897 population census report, determining the date at which non-Muslims shrank into a minority remains a matter of strong debate. Courbage and Fargues (Reference Courbage, Fargues and Mabro1997, pp. 27–28) used total poll and land tax revenues to estimate non-Muslims’ population share between 641 and 813, finding that non-Muslims shrank into a minority by 680.Footnote 6 Egypt’s Islamization was mostly driven by voluntary conversions to Islam, that were observed by the state (see the discussion of alternative theories).Footnote 7 Importantly, being Muslim was an “absorbing state” due to three Islamic laws: apostates are sentenced to death, the offspring of a Muslim male is Muslim, and Muslim females may only marry Muslim males.
Tax Wedge between Copts and Muslims in 641–1856
To provide incentives for non-Muslims to convert to Islam, the Arab tax system granted tax exemptions to converts. After a formation period between 632 and 750, the tax system evolved into its canonical form around 750 and remained unchanged in essence until 1856. Table 1 summarizes the taxes and benefits that were imposed on Copts (C) and Muslims (M). Every free adult Coptic male paid a poll tax (jizya), an annual per head cash tax; furthermore, Coptic landholders paid an annual land tax (kharaj) assessed at a lump-sum amount per unit of land that varied by crop and paid in cash or kind.Footnote 8 By contrast, Muslims were exempted from the poll tax, and Muslim landholders paid (until 750) a reduced land tax (variously called tithe, ushr, zakat, sadaqa) that was assessed at a percentage of yield that varied by land quality and paid in cash or kind, but they became subject to the higher kharaj tax rate starting from 750. Finally, Copts were subject to miscellaneous taxes that were later extended to Muslims starting from 750. Muslims, on their part, were subject to military conscription in return for a stipend in cash (‘ata’) and kind (rizq); an obligation that was abolished in 833 with the shift to recruiting slave soldiers.
Table 1 Difference in Net Taxes Between Copts and Muslims
Notes: Miscellaneous taxes changed over time. In 641–857, they were ad-hoc taxes collected for specific uses such as military expenses, lodging for officials, governor’s expenses, the village overhead expenses, and public projects. In 857–1171, their tax base expanded to include pasture, weir, and various crops and products. In 1171–1856, they included taxes on pasturage, industry, mines, fisheries, trade and transactions, property, maintenance of public services, war taxes, and taxes on vice.
Sources: Morimoto (Reference Morimoto1981, pp. 51, 140, 257–63), Rabie (Reference Rabie1972, pp. 73–132), and Ismail (Reference Ismail1998, pp. 153–208).
To sum up, the Coptic-Muslim difference in net taxes in 641–750 was equal to the sum of (1) poll tax, (2) (positive) difference between kharaj and ushr land tax rates, (3) miscellaneous taxes, and (4) difference between stipend and (non-pecuniary) cost of military conscription. Since 750, however, the net tax differential has equated the poll tax.
Regressivity of the Poll Tax Schedule
Figure 1 shows the long-term trend of the de jure nominal annual poll tax per person. From 641 to 750, the poll tax was one dinar on average, but starting from 750, it was imposed in three lump-sum amounts per person of one, two, and four dinars on the poor, middle, and rich respectively.Footnote 9 The nominal tax remained stable from 750 to 1100, increased slightly between 1101 and 1300, declined in 1301–1400, remained stable between 1401 and 1700, and then increased between 1701 and 1856, when it was finally abolished. Although the de facto poll tax varied more than the de jure tax, they were equal on average.Footnote 10
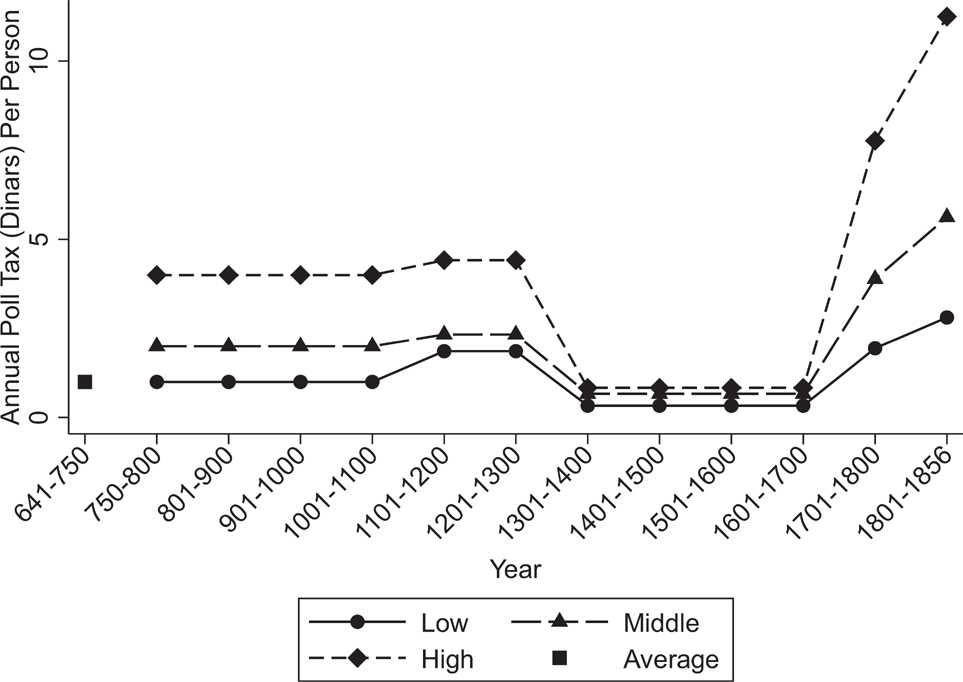
Figure 1 De Jure Nominal Annual Poll Tax Per Person in 641–1856
Notes: An Islamic dinar weighs 4.25 grams of gold.
Despite the three-bracket system, the poll tax rate per dinar of income was higher among low-income Copts. First, Figure 2 shows that the de jure poll tax per dinar was decreasing in wages. Second, examining the de facto poll tax reveals the same finding. A few tax registers in 703–733 contain information on both the poll tax and (cash) land tax per person. Since the cash land tax was a lump-sum amount per unit of land, it can be used as a proxy of the size of landholdings (wealth) of landholders. Table D.1 in the Online Appendix shows that the de facto poll tax rate per dinar of land tax was decreasing in land tax; smaller landholders faced, on average, a higher poll tax per dinar.
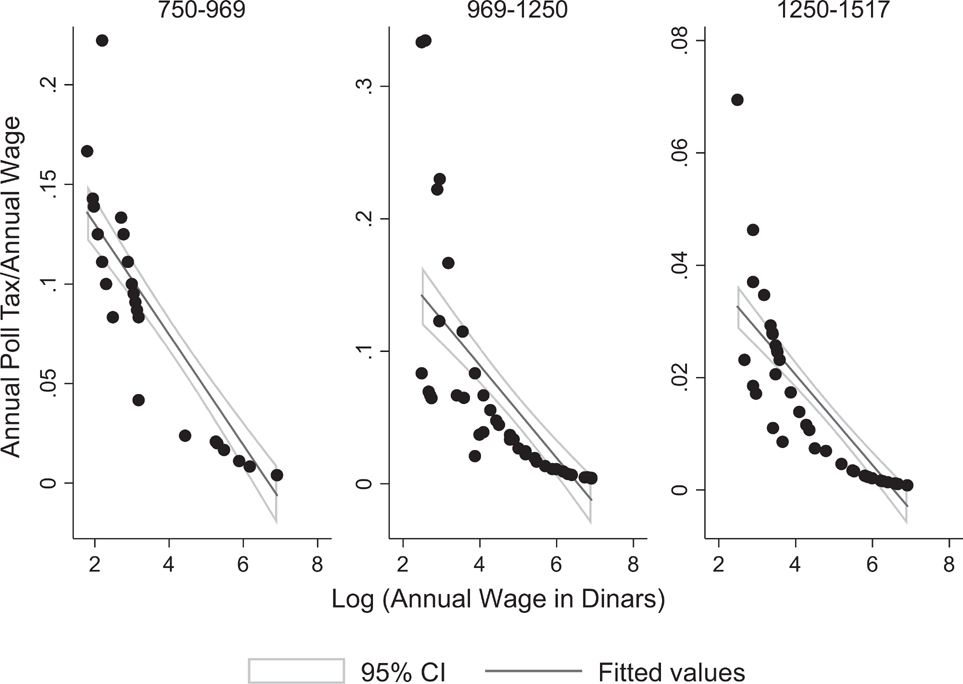
Figure 2 Wages and De Jure Poll Tax Per Dinar in 750–1517
Notes: The fitted lines estimate the following OLS regression in each period: ti = α + β log (yi) + ui where ti is the poll tax per dinar for individual i and log (yi) is the natural logarithm of the annual wage. The estimates are as follows (robust standard errors are in parentheses): (1) In 750–969: t = 0.186 (0.012) - 0.028 (0.002) log (y) [N = 35; RFootnote 2 = 0.83]; (2) In 969–1250: t = 0.229 (0.031) - 0.035 (0.005) log (y) [N = 77; RFootnote 2 = 0.54]; (3) In 1250–1517: t = 0.053 (0.005) - 0.008 (0.001) log (y) [N = 60; RFootnote 2 = 0.71].
Conceptual Framework
I employ a simple framework to guide the empirical analysis. Each Copt is endowed with income y distributed with density f(.) and distribution F(.), and religiosity r distributed with density g(.) and distribution G(.), where y > 0 and r > 0. For the purpose of the model, I assume that income and religiosity are independent, but I am agnostic about their relationship in the empirics.Footnote 11 I think of y as SES that has multiple dimensions, such as education, occupation, and wealth, that are positively correlated with income, and of r as the non-pecuniary cost of conversion that includes the psychological attachment to Coptic Christianity and the potentially bad treatment of converts as outcasts by Copts or as subordinates by Arabs. Population size is of measure one. Copts pay a lump-sum poll tax τ that is removed upon conversion. More broadly, I think of τ as the Coptic-Muslim net tax difference. While the de jure poll tax was imposed in three amounts on the poor, middle, and rich, it resembled a lump-sum tax to the extent that the poll tax rate, both de jure and de facto, was decreasing in income (Figure 2 and Online Appendix Table D.1).
Because of both the lump-sum feature of the poll tax and the concavity of the utility function, the model predicts that, holding religiosity constant, poorer Copts are more likely to convert, and, similarly, holding income constant, less religious Copts are more likely to convert. It is important to note that the screening mechanism predicts that the poorest Copt is at least as rich as the richest convert, at a given level of religiosity. This may not hold though if religiosity differs among Copts. Specifically, the model allows for the possibility of poor Copts choosing to stay Coptic because they are highly religious and of rich Copts choosing to convert because they are not attached to Coptic Christianity. The model, however, generates the major empirical fact that this article seeks to understand, namely, that Copts are richer, on average, than Muslims.
Holding the income distribution constant, I examine at a given level of religiosity the partial effects of changing the tax on converts’ population share and on the difference in the average (before-tax) income between those who remain Copts and converts (Muslims), which captures the selection-on-income effect of the poll tax. Let y *(τ;r) be the income at which a Copt is indifferent about conversion at a given level of religiosity. The following propositions hold (I relegate the proofs to Section A of the Online Appendix):
Proposition 1 Holding r constant, Copts’ population share is decreasing in τ.
Proposition 2 Holding r constant:
1 The average (before-tax) income of those who remain Copts, E(y | y > y *), and of those who convert to Islam, E(y | y ≤ y *), are both increasing in τ.
2 The Coptic-Muslim difference in average income is increasing in τ if f(y) is everywhere decreasing.
Figure A.1 in the Online Appendix illustrates the intuition behind these results. The concavity of the utility function implies that y * moves rightwards in response to an increase in τ, which decreases Copts’ population share (Proposition 1). As y * increases, the remaining Copts are richer on average as they lose their poorest members. The same holds for converts who are richer on average as they gain new converts who are richer than any previous convert. Hence, the Coptic-Muslim income gap may go up or down depending on the income distribution. For example, it increases if the density of the income distribution is everywhere decreasing (Proposition 2).Footnote 12
Evidence from the Country-Level Long-Term Trends
In this section, I introduce the first suggestive evidence on Propositions 1 and 2: the long-term trends of the poll tax, Copts’ population share, and the Coptic-Muslim SES gap. These trends, I argue, are broadly consistent with both propositions.
Real Poll Tax Rate in 641–1517
The real poll tax decreased between 641 and 750, because the nominal tax did not increase (Figure 1), and because the dinar’s purchasing power declined (Ashtor Reference Ashtor1969, p. 465). Furthermore, the poll tax declined as a percentage of income due to the increase in nominal wages. The dataset on occupations and wages in Figure 2 reveals that the de jure poll tax in 750–969 was, on average, 8 and 10 percent of the annual wage for low- and middle-income brackets respectively, but it declined to 6 percent in 969–1250, and 1.4 percent in 1250–1517. The tax was negligible though for the high-income bracket throughout the whole period.
Copts’ Population Share in 641–1897
Courbage and Fargues (Reference Courbage, Fargues and Mabro1997)’s estimates of Copts’ population share in 641–813 from total tax revenues rely on strong assumptions on tax enforcement. Two novel data sources allow me to provide different and arguably more convincing estimates of non-Muslims’ population share between 641 and 1897. The first is a dataset on Christian churches and monasteries (both Coptic and non-Coptic) in 1200 and 1500 that I constructed from Abul-Makarim (Reference Abul-Makarim and Anba-Samuel1984 [1200]) and Al-Maqrizi (Reference Al-Maqrizi and Sayyid2002 [1500]) (see Section B in the Online Appendix for further details). Using this dataset, I estimate non-Muslims’ population share in 1200 and 1500 by the share of villages in all Egypt that had at least one Christian church or monastery. The second is the 1848 and 1868 population census samples that record the religious affiliation of each individual. My estimates, plotted in Figure 3, indicate that non-Muslims’ population share was 16 percent in 1200, 3 percent in 1500, and 7 percent in 1848–1868. These estimates are consistent with those of Courbage and Fargues (Reference Courbage, Fargues and Mabro1997) and indicate that non-Muslims fell into a minority by 1200 and declined slowly thereafter.Footnote 13 The composition of Egypt’s non-Muslims likely persisted from 641 through 1868.Footnote 14
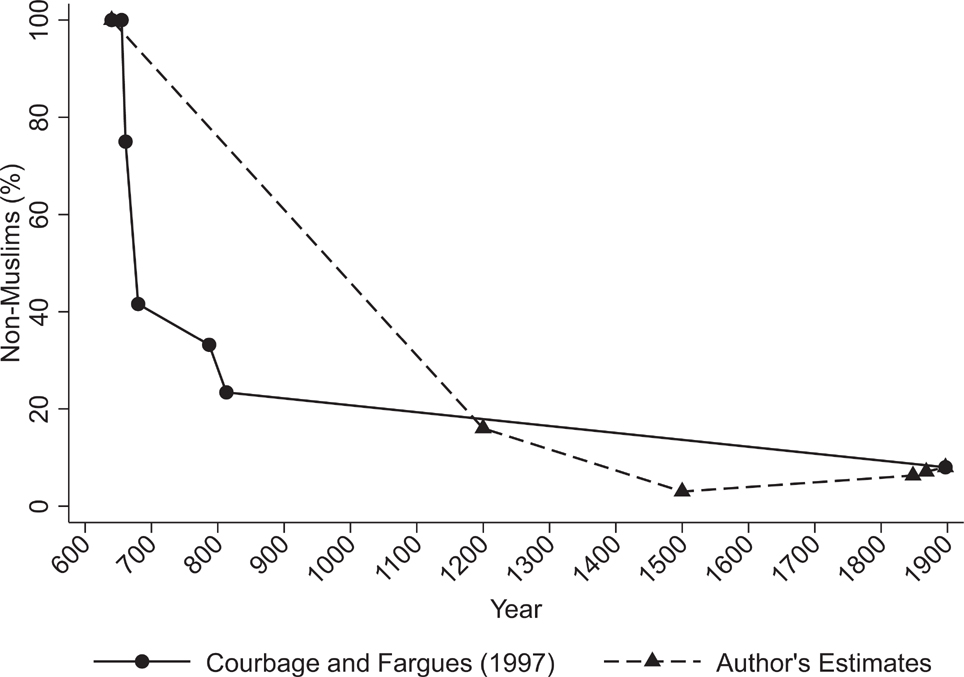
Figure 3 Non-Muslims’ Population Share in 641–1897
Coptic-Muslim SES Gap in 641–969 and 1848–1868
Documenting the trend of the Coptic-Muslim SES gap is challenging because it requires observing religion and occupations simultaneously. To this end, I collected all the available individual-level information on occupations and religion in 641–969 (N = 402) from the papyri in the Arabic Papyrology Database (henceforth, APD), where I inferred a worker’s religion from his name (converts adopted an Arabic name). I compare Copts’ and Muslims’ occupational distributions estimated from the APD sample in 641–969 to those estimated from the 1848–1868 census samples. For the purpose of this article, I pooled the two samples in 1848 and 1868 and restricted the analysis to Egyptian local free Coptic and Muslim employed men of a rural district of origin who are at least 15 years of age and with non-missing information on age, religion, occupation, and district of origin. I refer the reader to Section B in the Online Appendix for further details about the two data sources, and a discussion of the representativeness of the APD sample.
To measure SES in the APD sample and the 1848–1868 samples, I constructed three dummy variables that measure the incidence of working in a white-collar job. White-collar1 =1 if an individual is a professional, a high-level bureaucrat, or a mid-low bureaucrat; these are literate white-collar jobs that are non-political and non-religious (except high-level bureaucrats). White-collar2 =1 if white-collar1 =1 or if an individual belongs to the judiciary, the military, the police, the clergy, or the rural elites; these are literate political or religious white-collar jobs. White-collar3 =1 if white-collar2 =1 or if an individual is a merchant; a white-collar job that is not necessarily literate. I also created dummy variables for three other outcomes: artisans, farmers, and unskilled workers. By construction, the population shares of white-collar3, artisans, farmers, and unskilled workers sum up to 1, thus, exhausting the occupational distribution.
The findings are in Table 2. Copts (56 percent of the APD sample) are over-represented among white-collar workers in 641–969. About 22 percent of Copts in the sample worked in white-collar jobs compared to 15 percent among Muslims. This is mostly attributable to Copts’ over-representation in the mid-low bureaucracy (scribes, land tax collectors, accountants). In fact, Copts are seldom observed among the judiciary, the military, the police, and merchants, but the differences are not statistically significant and the population share of these jobs among Muslims (5 percent) is too small to offset Copts’ over-representation in the mid-low bureaucracy. The advantage of Copts is not limited to white-collar jobs, however, as they are over-represented among artisans (weavers, carpenters, tailors) at 19 percent versus 14 percent among Muslims (p = 0.13) and under-represented among farmers. The results in 1848–1868 are strikingly similar. Copts are more likely to be white-collar workers (as mid-low bureaucrats) or artisans, at 50 percent as opposed to 20 percent among Muslims. They are also less likely to be farmers or unskilled workers, at 50 percent versus 80 percent for Muslims. Even though Muslims are over-represented among professionals, high-level bureaucrats, the judiciary, the military, the police, the clergy, and the rural elites, the combined population share of these jobs (6 percent) is too small to offset Copts’ advantage. Comparing the figures in 641–969 and 1848–1868 indicates that the Coptic-Muslim gaps persisted with respect to most outcomes, although the gaps with respect to mid-low bureaucrats, artisans, and unskilled workers increased significantly.
Table 2 Coptic-Muslim Occupational Differences in 641–969 and 1848–1868
Notes: Standard deviations are in parentheses. Robust standard errors are in brackets.
*** p < 0.01
** p < 0.05
* p < 0.10
Differences in columns (3), (6), (7), (8), and (9) are estimated from the regression:  ${y_{it}} = \sum\nolimits_{l = 1}^2 {{\beta _{1l}}{d_l}} + \sum\nolimits_{l = 1}^2 {{\beta _{2l}}} \left( {cop{t_{it}} \times {d_l}} \right) + {\varepsilon _{it}}$, where y it is a dummy variable indicating the occupational outcome of individual i in period t(= 641–969 or 1848–1868); d l are period fixed effects; copt is an indicator variable for being Coptic Christian; εit is an error term.
Sources: The APD sample in 641–969 and the 1848–1868 census samples (see the text and Sections B.1 and B.3 in the Online Appendix for details).
A few important notes are in order. First, because of their political or religious nature, the judiciary, the military, the police, the (Muslim) clergy, and the high-level bureaucracy were (mostly) restricted to Muslims by law.Footnote 15 But since Egyptian Muslims (converts) were under-represented in these jobs vis-à-vis non-Egyptian Muslim elites (Arabs, and later on, Turks), the findings likely underestimate the true Coptic-Muslim SES gap. Second, Eliyahu Ashtor (Reference Ashtor1969) documents that bureaucrats were better paid than artisans and unskilled workers, and hence the occupational gap likely reflected an income gap. Third, Copts’ persistent over-representation in the mid-low bureaucracy and skilled artisanal jobs, and Muslims’ over-representation in trade, are both well documented in history. Circa 1000 ce, Al-Muqaddasi noted that, “scribes in the Levant and Egypt are Christians.” According to Jacques Tagher (Reference Tagher1951, p. 142), “the condition of the Copt did not change during the six centuries preceding [the nineteenth century]… His work, tax collecting, was the basis of his existence and his only hope to accumulate wealth.” Lord Cromer, the British Consul of Egypt in 1883–1908, observed that, “when the English took Egyptian affairs in hand, the accountants in the employment of the Egyptian government were almost exclusively Copts,” (Tagher Reference Tagher1951, p. 213). André Raymond (Reference Raymond1973, pp. 456–59) documents that Copts in eighteenth-century Cairo were over-represented among jewelers, carpenters, tailors, and weavers, which are almost the same set of occupations in which I observe Coptic artisans in both 641–969 and 1848–1868. Muslims, on their part, were over-represented in trade. Under the Mamluks, for example, all merchants of spices were Muslims.
To summarize, the long-term trends are broadly consistent with Propositions 1 and 2. The higher tax rate in 641–1250 triggered a decline in Copts’ population share and the emergence of a Coptic-Muslim SES gap as farmers and unskilled Copts were more likely to convert. Conversions subsided after 1250 with the tax decrease. Being at the country level though, the evidence from the long-term trends is only suggestive.
Evidence from Geographic Variation in the Poll Tax
I now turn to the econometric evidence on Propositions 1 and 2 that exploits the geographic variation in poll tax rates. Due to space constraints, I relegate to Section C in the Online Appendix a discussion of a number of concerns about the empirical evidence, namely, representativeness of the tax papyri, measurement error in the poll tax, and the possibility of tax-induced migration across districts.
Empirical Strategy
Poll tax rates varied across districts. Tax papyri in 641–1100 reveal that among the four kuras for which I observe the poll tax, the average tax was lower in the kura of Qahqawa in the south than in the three northern kuras by 25 percent (Figure 4, panel A). I first treat the tax variation as exogenous, and examine its effects using two sets of OLS regressions. The first set examines the effect on Copts’ population share in 1200, 1500, and 1848–1868: $1200\,{\rm{ and\,1500:}}\,churc{h_{vd}} = {\beta _{10}} + {\beta _{11}}{\tau _d} + {X_d}{\beta _{12}} + {\varepsilon _{1vd}}$ $1800 - 1868{\rm{: }}cop{y_{id}} = {\beta _{20}} + {\beta _{21}}{\tau _d} + {X_d}{\beta _{22}} + {\varepsilon _{2id}},$
while the second set of OLS regressions examines the impact of the poll tax in 641–1100 on the Coptic-Muslim occupational gap in 1848–1868: $1848 - 1868{\rm{: y}}_{id}^o = {\beta _d} + \beta _{31}^ocop{t_i} + \beta _{20}^o(cop{t_i} \times {\tau _d}) + (cop{t_i} \times {X_d})\beta _{33}^o + \varepsilon _{3id}^o;o = 1,2,3,4,$
where the dependent variable in equation (1), church =1 if village v in district d has at least one Coptic church or monastery in 1200 and 1500. The dependent variable in equation (2), copt =1 if individual i of district of origin d in the 1848–1868 population census samples is Coptic Christian. The dependent variable in equation (3),  $y_{id}^o = 1$ if individual i of district d works in occupation o. I estimate equation (3) separately for four occupational outcomes that exhaust the full occupational distribution (defined as in Table 2): white-collar3, artisan, farmer, and unskilled occupations. The main regressor, τd =1 if the average poll tax payment in 641–1100 in district d is higher than the cross-district average. The parameters β 10 and β 20 are constant terms, while βd is a full set of district of origin fixed effects.
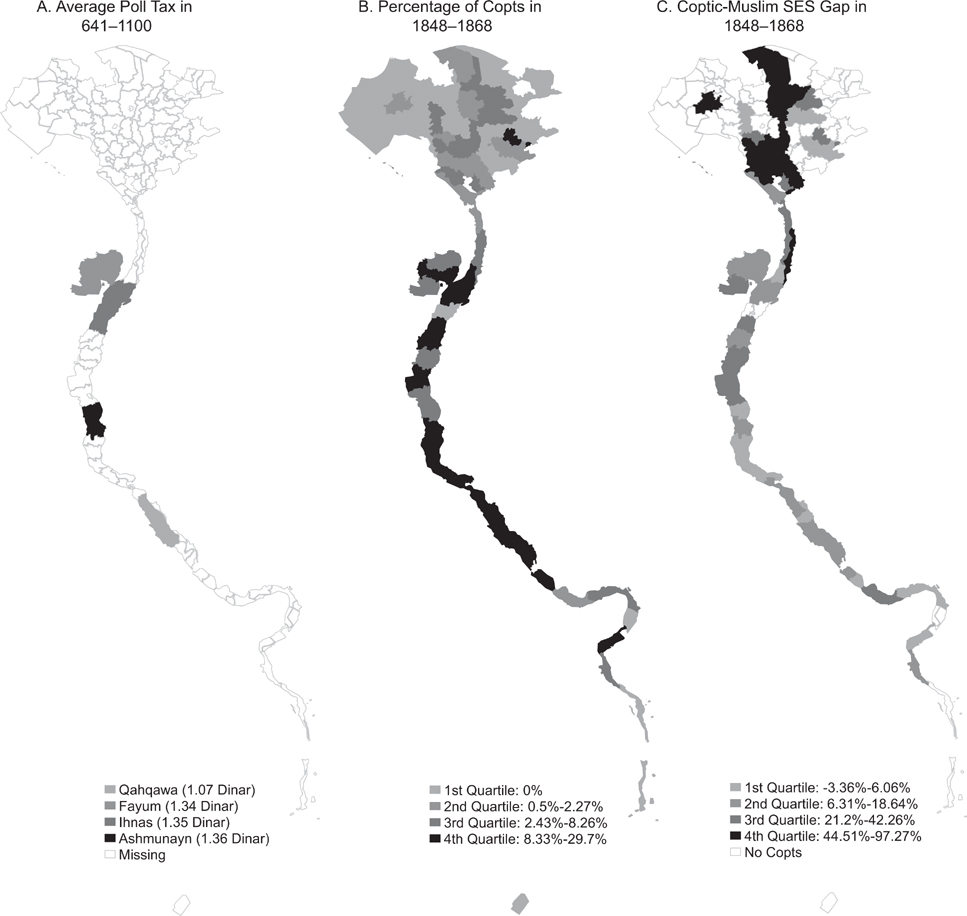
Figure 4 The Spatial Distribution of the Poll Tax, Copts’ Population Share, and the Coptic-Muslim SES Gap
Notes: The Coptic-Muslim SES gap is the difference between Copts and Muslims in the population share of professionals, high-level bureaucrats, and mid-low bureaucrats (white-collar1 =1). The Nile Delta is the northern triangle on the map. The Nile Valley extends from the south of the Nile Delta to Egypt’s southern border with Sudan.
I include in Xd a set of pre-641 district-level controls to account for cross-district heterogeneity that may be correlated with poll tax rates, conversions, and the Coptic-Muslim SES gap. The controls are: (1) the natural logarithm of the urban population in district d circa 300, as a proxy for income; (2) a dummy variable that takes value 1 if district d is believed (according to a Coptic book written around 400 (Mingana Reference Mingana1931)) to have been visited by the Holy Family during its legendary flight to Egypt, as a proxy for religiosity or attachment to Coptic Christianity, but since the book’s date is uncertain it must be interpreted with caution;Footnote 16 (3) a dummy variable that takes value 1 if district d had at least one autopract estate circa 600, as a proxy for the resistance to Arabs of the Coptic elites; the autopragia was a privilege granted to large landholders in late Byzantine Egypt allowing them to pay taxes directly to the capital and collect taxes in their constituencies; (4) a dummy variable that takes value 1 if there was at least one Byzantine garrison in district d circa 600, as a proxy for Byzantines’ resistance to Arabs (Copts did not hold arms during the Conquest).
Standard errors are clustered at the district level, the level at which I observe the poll tax indicator variable, after mapping kuras in 641–1100 into districts in 1200, 1500, and 1848–1868. Technically, this is a justifiable level of clustering because it is the level at which the treatment (poll tax) is assigned (Abadie, Athey, Imbens, et al. Reference Abadie, Athey, Imbens and Wooldridge2017). However, since the number of districts (clusters) where the poll tax papyri survived is too small, this may bias the standard errors downwards (Cameron, Gelbach, and Miller Reference Cameron, Gelbach and Miller2008; Cameron and Miller Reference Cameron and Miller2015). Unfortunately, I am not able to correct for this bias by the adjustments that are suggested in the literature, because the main regressor, the poll tax, does not vary within clusters (districts). But to mitigate this concern, I also report the White-Huber robust standard errors in the village-level regressions in 1200 and 1500 (equation (1)), and the robust standard errors clustered at the finer village level in the individual-level regressions in 1848–1868 (equations (2) and (3)). As predicted by the literature, these alternative standard errors are mostly larger than the ones clustered at the district level, but in most cases the coefficients retain their statistical significance. Furthermore, as a robustness check in Section C in the Online Appendix, I re-estimate all three equations using Arab settlement in 700–969, that is observed for all 42 kuras or 76 districts, as an alternative measure of the poll tax (see Online Appendix Tables C.1 and C.2).
Equations (1), (2), and (3) are direct tests of Propositions 1 and 2. They are equivalent to district-level regressions (weighted by a district’s population) with Copts’ population share being the dependent variable (in equations (1) and (2)), and the Coptic-Muslim difference in the population share of each occupational outcome being the dependent variable (in equation (3)). The thought experiment here is to vary the poll tax across districts and observe the two outcomes, while holding income, religiosity, and resistance to Arabs, constant across districts.
Propositions 1 and 2 make the following predictions. Proposition 1 predicts that β 11 < 0 and β 21 < 0; districts with a higher poll tax will have relatively fewer Copts. As all districts were almost 100 percent Copt in 641, and assuming away cross-district migration, Copts’ population share in 1200, 1500, and 1848–1868 is approximately equal to one minus the share of converts between 641 and each of 1200, 1500, and 1848–1868. The coefficient  $\beta _{31}^o$ captures the Coptic-Muslim SES gap in low-tax districts. The model predicts that $\beta _{31}^o \gt 0$ for the white-collar and artisanal outcomes and < 0 for the farmer and unskilled outcomes. Due to the initial positive selection of non-convert Copts in every district, and assuming that the initial selection perpetuated through 1848–1868, Copts in low-tax districts are expected to be over-represented among white-collar workers and artisans and under-represented among farmers and unskilled workers. The coefficient on the interaction term (copti×τd), $\beta _{32}^o$, captures the impact of the tax on the Coptic-Muslim SES differential. Proposition 2 predicts that $\beta _{32}^o \gt 0$ for the white-collar and artisanal outcomes and < 0 for the farmer and unskilled outcomes. Assuming that the initial selection persisted through 1848–1868, I expect that, compared to Copts in low-tax districts, Copts in high-tax districts are differentially more likely than Muslims to be white-collar workers or artisans and differentially less likely to be farmers or unskilled workers.
Figure 4 maps the average poll tax in 641–1100, and Copts’ population share and the Coptic-Muslim SES gap, both observed in 1848–1868. First, within the 11 districts for which I observe the poll tax, the tax is higher in the north. Second, Copts are a minority in all districts in 1848–1868, but are relatively more concentrated in the Nile Valley. Finally, Copts are more likely than Muslims to be white-collar workers in 41 out of the 49 districts in which there are any Copts, but the gap is larger in districts with a relatively smaller Coptic minority.Footnote 17
However, it is unlikely that the poll tax was exogenous. The poll tax was assessed and collected by the local authorities of each district, and thus the variation in tax rates may reflect differences across tax administrators in their willingness to enforce the poll tax within their constituencies.Footnote 18 This introduces two potential sources of endogeneity: (1) reverse causality: tax authorities may have chosen tax rates in 641–1100 in response to conversions and the Coptic-Muslim SES gap within their constituencies, and (2) omitted variables: tax rates may have been impacted by unobserved district-level characteristics that are not captured by the current set of control variables and are correlated with conversions and the Coptic-Muslim SES gap.
To address the potential endogeneity of the poll tax, I employ an IV strategy. As an IV for the poll tax in equations (1) and (2), I use district’s distance to ‘Arish, a town close to Egypt’s northeastern borders that was the first to be captured by Arabs in 639 due to its proximity to the Arab peninsula. Similarly, I use “Copt × Distance to ‘Arish” as an IV for the interaction term in equation (3). The argument is that Arabs were more likely to settle in areas that were closer to ‘Arish. In these areas, the argument goes, Arabs were more likely to replace Coptic local elites as large landholders and headmen (Sijpesteijn Reference Sijpesteijn2009), and hence to impose a higher poll tax rate (or enforce the tax more strictly) on Coptic taxpayers. By contrast, in areas where Arabs did not settle, Coptic elites remained in power and were likely more lenient with their fellow Copts by allowing taxpayers to pay zero or reduced tax and to accumulate tax arrears (Morimoto Reference Morimoto1981). This argument is supported by quantitative and historical evidence. For one, Table D.2 in the Online Appendix reveals that poll tax payments in 641–1100 were, on average, higher in kuras where at least one Arab tribe settled in 700–969. The result holds when I use distance to ‘Arish as an IV for Arab settlement. And Arabs were less likely to settle in districts further away from ‘Arish. For another, tax papyri in 641–1100 indicate that the poll tax rate in the kura of Qahqawa, where Arabs did not settle, was, on average, lower, due to the higher share of its Coptic taxpayers who paid zero poll tax. Indeed, complaints from Egypt’s governor Qurra ibn Sharik (709–715) to Basileios, the (Coptic) headman of Qahqawa, that reached us in the extant papyri may have been motivated by Basileios’ lenient tax policy.
Does the distance to ‘Arish satisfy the exclusion restriction? The proximity to ‘Arish, a small border town, is (arguably) unlikely to be correlated with pre-641 characteristics of districts. Table D.3 shows that urbanization circa 300, religiosity, power of Coptic elites, and Byzantine resistance in a district are all uncorrelated with its distance to ‘Arish.
Findings
Table 3 shows the findings on the impact of the poll tax on conversions in equations (1) and (2). The OLS estimates in Panel 3a indicate that villages located in districts that faced a higher-than-average poll tax in 641–1100 were less likely to have at least one Coptic church or monastery in 1200 and 1500 by 15 and 38 percentage points; approximately, 0.5 and 1.5 standard deviations, respectively. This implies that these districts witnessed relatively more conversions to Islam between 641 and 1200 (and 1500). Similarly, in 1848–1868, individuals who originated in high-tax districts are less likely to be Coptic Christian by about 16 percentage points; approximately, one standard deviation. The IV estimates in Panel 3b confirm the OLS findings.
Table 3 The Poll Tax in 641–1100 and Copts’ Population Share in 1200, 1500, and 1848–1868
Dependent Variable: 1200 and 1500: = 1 if At Least One Coptic Church or Monastery in Village 1848–1868: =1 if Individual is Coptic Christian
Notes: Standard errors clustered at the district level are in parentheses, and at the village level in brackets. White-Huber robust standard errors are in curly brackets. KP Wald F-Stat in parentheses corresponds to clustering at the district level, in brackets to clustering at the village level, and in curly brackets to White-Huber standard errors.
*** p < 0.01
** p < 0.05
* p < 0.10
A constant is included in all regressions.
Source: 1200 and 1500: Dataset on Christian churches and monasteries in 1200 and 1500; 1848–1868: The population census samples. Data on regressors are from multiple data sources. See Section B in the Online Appendix for details.
Results on the Coptic-Muslim occupational differentials in equation (3) are in Table 4. The OLS estimates in Panel 4a show that, compared to their co-religionists in low-tax districts, Copts in high-tax districts are differentially more likely than Muslims to be white-collar workers and artisans and differentially less likely to be farmers and unskilled workers (the latter effect is statistically insignificant). For example, compared to low-tax districts, the Coptic-Muslim difference in the population share of white-collar workers in high-tax districts is greater by 10 percentage points; approximately, one standard deviation of the cross-district distribution of the Coptic-Muslim white-collar difference. Estimating separate regressions for each occupational category in White-Collar3 (results not shown) reveals that the effect stems from Copts’ higher over-representation among mid-low bureaucrats in high-tax districts. The IV estimates in Panel 4b confirm the OLS estimates.
Table 4 The Poll Tax in 641–1100 and The Coptic-Muslim Occupational Differences in 1848–1868
Dependent Variable Indicated on Top of Each Column
Notes: Standard errors clustered at the district level are in parentheses, and at the village level in brackets. KP Wald F-Stat in parentheses corresponds to clustering at the district level, and in brackets to clustering at the village level. Copt is a dummy variable that takes value 1 if individual i is Coptic Christian. Poll tax is a dummy variable that takes value 1 if the average poll tax payment in 641–1100 in district d is above average.
*** p < 0.01
** p < 0.05
* p < 0.10
Source: The 1848–1868 population census samples combined with multiple data sources. See Section B in the Online Appendix for details.
Overall, the results suggest that, compared to Copts in low-tax districts, Copts in high-tax districts were relatively fewer in 1200, 1500, and 1848–1868, but differentially better off in 1848–1868. Put differently, there was an initial positive selection of non-convert Copts on SES between 641 and 1200, the extent of which varied across districts due to the cross-district variation in the poll tax during this period. The initial selection persisted at the district level through 1500 and 1848–1868.
Persistence of the Coptic-Muslim SES Gap
The empirical evidence suggests that Copts shrank into a minority between 641 and 1200 and that the initial tax-induced positive selection of non-convert Copts persisted thereafter. Gary Becker and Nigel Tomes (Reference Becker and Tomes1979) attribute the intergenerational transmission of SES within dynasties to two channels: parental investment in child’s human capital (nurture), and inheritance of genetic and cultural endowments (nature). However, their model predicts that dynasties must eventually regress to the mean SES of the population after a few generations, even at very high rates (<1) of intergenerational persistence of SES. Hence, the persistence of the Coptic-Muslim SES gap for over a millennium poses a theoretical dilemma. To be sure, since the poll tax was enforced from 641 to 1856, persistence can be possibly explained by repeated selected conversion waves, even in the absence of poll tax rises, due to idiosyncratic shocks to income and religiosity.Footnote 19 Indeed, Copts’ population share declined, albeit slowly, between 1200 and 1868, and so it is plausible that selected conversion on SES continued throughout the whole period leading the SES gap to perpetuate. Yet, this explanation fails to account for why Copts did not vanish given that being Muslim was an absorbing state. An additional mechanism, besides intergenerational persistence of SES within dynasties, is thus needed to explain not only the persistence of the gap, but also the survival of Copts. The case of Copts is far from being empirically unique, though. Researchers have long noted the persistence of inter-group SES gaps (and the survival of minorities) beyond what is predicted by theory. This includes the white-black SES gap in the United States, the Protestant-Catholic SES gap in Europe, and Jews’ higher SES in the Middle East, Europe, and the United States. George Borjas (Reference Borjas1992) explains this phenomenon by a spillover or community effect where a child’s SES depends not only on parental SES (via nurture and nature), but also on the group’s average SES (or human capital). Botticini and Eckstein (Reference Botticini and Eckstein2005), on the other hand, attribute Jews’ persistent elite position to successive selection on SES, with low-SES Jews, who had lower preference for human capital, continuously converting out of Judaism due to Rabbinic Judaism’s emphasis on literacy.
This article explains both the persistence of the Coptic-Muslim SES gap and the survival of the Coptic population by group effects on children’s SES. Group effects operated through allowing, or rather blocking, children’s human capital accumulation via group’s control over apprenticeships and schooling. In medieval Egypt, white-collar and artisanal occupations required learning occupation-specific skills from a young age. As human capital was job-specific, it was acquired primarily via apprenticeships, and to a lesser extent, schooling. The supply of both apprenticeships and schooling was mostly restricted though to social networks of white-collar workers and artisans. For one, obtaining an apprenticeship, the gateway to most artisanal and white-collar occupations, required the approval of a master in a specific occupation. Masters were more likely to admit their family members and acquaintances. For another, school enrollment that provided elementary training for white-collar jobs (that had to be later augmented by apprenticeships), was limited to social networks of workers in these jobs. Conversions of Copts to Islam between 641 and 1200 arguably redefined social networks along religious lines. As conversions sorted Copts and Muslims on occupations, each group then attempted to exclude the other from apprenticeships and schooling that would qualify a child to the white-collar and artisanal jobs in which the group was over-represented. Put differently, a child’s occupational attainment depended on two factors: intergenerational transmission of SES via both nature and nurture, and family’s religious group.Footnote 20
This mechanism can be interpreted as a specific form of the “group effect” that was proposed by Borjas (Reference Borjas1992). While Borjas’s group effect can operate via both the demand and supply sides of the production of a child’s human capital, the group effect proposed here emphasizes the supply side. Two sons, Coptic and Muslim, born to fathers with the same SES, say unskilled workers, and whose fathers demand the same human capital for their sons, say apprenticeship as a tailor or a scribe, may end up with totally different human capital and hence SES. Whereas the Coptic son may indeed become an apprentice in a tailor’s workshop or at a scribe’s office since Copts were over-represented among tailors and scribes, the Muslim son may fail to achieve the same result. The mechanism is different though from the human capital channel that emphasizes the demand (or preferences) for human capital as has been suggested by Botticini and Eckstein (Reference Botticini and Eckstein2005) (see the discussion in the next section). Specifically, I argue that the supply side of the provision of skills was a binding constraint for most farmer and unskilled parents, and thus there was “pent-up” parental demand for human capital. Group effects are also similar to Simon Kuznets’ (Reference Kuznets and Finkelstein1960) explanation of Jews’ SES advantage by their attempt as a minority to preserve their identity via specializing in jobs in which they built a tradition.Footnote 21 This mechanism explains not only the persistence of the overall Coptic-Muslim SES gap, but also the persistence of Copts’ and Muslims’ specialization in specific occupations that is observed in Table 2.
The mechanism is supported by historical evidence. Copts restricted access to skills that were required for jobs in mid-low bureaucracy. While Coptic elementary schools taught arithmetic and geometry in order to train Coptic children for jobs in mid-low bureaucracy, Muslim schools failed to provide this training (Heyworth-Dunne Reference Heyworth-Dunne1938, pp. 2–7, 84–92). However, it was primarily apprenticeships, not schools, that trained Coptic children for bureaucratic jobs.Footnote 22 In Fatimid Egypt (969–1171), “the persistence of Coptic administrative personnel [was because] the agrarian administration was very complex and not easily mastered. In it the Copts played an important role at the local level as well as at the central offices in the capital… The administrative knowledge was passed on by the officials in their families when fathers employed their sons, thus maintaining the hold of the family over posts,” (Samir Reference Samir1996, p. 190). In the words of Lord Cromer, the British consul of Egypt in 1883–1908, the Coptic accounting system was “archaic” and “incomprehensible to anyone but themselves” (Tagher Reference Tagher1951, p. 213). Copts used fractions and “ambiguous abbreviations” in accounting based on units of measurement in use in rural Egypt.Footnote 23 Group effects on acquiring human capital were not limited to Copts in mid-low bureaucracy though. Copts were legally banned from the judiciary, military, police, and clergy, and these jobs were thus monopolized by Muslims. Muslims were banned from brewing that became a Coptic specialization. The 1848 and 1868 census samples reveal that Copts were over-represented among jewelers, dyers, carpenters, weavers, and tailors, whereas Muslims were over-represented among blacksmiths, sawyers, bakers, and butchers. Raymond (Reference Raymond1973, pp. 544–51) suggests that the reason for the persistence of this occupational specialization was restricting apprenticeships. The Coptic-Muslim SES gap may have increased in the late nineteenth century with the expansion of European schools (see the next section), but it declined in the late twentieth century with the expansion of public mass modern education in 1951–1953 that relaxed each group’s restrictions on access to (white-collar) skills (Saleh Reference Saleh2016).
Discussion of Alternative Theories
There are other theories that can explain the decline in Copts’ population share, the formation of the Coptic-Muslim SES gap, and the persistence of the SES gap. I discuss some of these theories below, but due to space limitations I relegate the results to Section D in the Online Appendix.
Theories of Decline in Copts’ Population Share
There are two sets of explanations for why Copts shrank into a minority between 641 and 1897: the first traces Egypt’s Islamization to demographic factors, whereas the second emphasizes Copts’ conversion to Islam. Strictly speaking, three demographic processes could have driven Islamization in the absence of conversions (Fargues Reference Fargues2001): population replacement via Muslims’ immigration or Copts’ emigration; Muslims’ higher birth and/or lower death rates; and intermarriage between Coptic females and Muslim males (opposite scenario is prohibited) without pre-marriage conversion, which results by law in a Muslim offspring.Footnote 24 These processes, I argue, are not the main causes of Islamization. On the one hand, Arab immigration, the largest Muslim immigration wave in Egypt’s history, was small compared to Copts’ population. In 641, Egypt’s population (2.7 millions) was three times that of the Arab peninsula (1 million) (Russell Reference Russell1958, p. 89). Josiah Russell (Reference Russell1966) estimates the number of Arab immigrants in 650 at 100,000. Arab immigration subsided after 833 with the shift to slave armies and the stoppage of state stipends to Arabs. On the other hand, Copts rarely emigrated from Egypt because of their unique denomination that differed from Catholics and Greek Orthodox Christians. Next, I consider differences in fertility and mortality. As the 1848–1868 censuses predate the demographic transition, they provide a glimpse of the demographics of medieval Egypt. The samples suggest that within male household heads, Copts had, on average, more children than Muslims (1.48 versus 1.35, p = 0.003). In addition, Copts had higher mortality at younger ages (10–29 or 10–39), but lower mortality at older ages (30–79 or 40–79) (Table D.4).Footnote 25 This implies that Muslims did not have higher fertility or lower mortality than Copts. Finally, cross-marriages (without pre-marriage conversion) were rare as suggested by the dearth of cross-marriage contracts in the papyri in 641–969. The 1848–1868 samples record only two cross-marriages.
But even if Egypt’s Islamization was mostly driven by Copts’ conversion to Islam, there are alternative explanations of the conversion process other than the tax system. To begin with, an old thesis traces Copts’ conversion to the violent suppression of Copts’ tax revolts in 726–866. This theory does not fully account for the findings, though. For one, it is not obvious why poor Copts were more likely to convert, since both rich and poor Copts revolted. For another, Online Appendix Table D.5 shows that almost all tax revolts were in the Nile Delta. Since the districts where I observe the poll tax are in the Nile Valley, where almost no revolts took place, it is unlikely that the cross-district variation in conversion is driven by the revolts. Another thesis traces Copts’ conversion to state persecution or anti-Coptic riots. Two early persecution waves took place in 847–861 and 996–1021, but the third wave in 1250–1517 was the largest and the most violent. Although persecution may indeed explain part of the decline in Copts’ population share (especially between 1200 and 1500), it does not fully explain the findings. Again, it is not clear why persecution or riots would target poor Copts. Furthermore, the list of churches and monasteries in Al-Maqrizi (Reference Al-Maqrizi and Sayyid2002 [1500]) allows me to calculate the number of Coptic churches that were burned in each province in the anti-Coptic riots of 1321, one of the most violent riots during that period. Out of the 35 churches that were burned, 17 were located in urban Egypt, 8 in the Nile Delta, and only 6 in the Nile Valley. None of the Nile Valley churches were located within the 11 districts for which I observe the poll tax. A third hypothesis traces conversions to Copts’ desire to access top state posts that were confined to Muslims. But this theory is insufficient because the population share of these posts was too small to shift the Coptic-Muslim SES gap in favor of Muslims (Table 2). And, if anything, this mechanism would have actually mitigated the Coptic-Muslim SES gap. Finally, conversions may have occurred due to a true belief in Islam, but again it is not obvious why poor Copts were more likely to convert since Coptic Christianity was, like Islam, attractive to the poor. After all, it was Coptic Christianity that attracted Egypt’s poor masses, and induced them to resist the Byzantines’ persecution to convert to the (elite) Melkite church between 451 and 641. Moreover, this theory does not explain why conversions among the poor were more widespread in high-tax districts.
Theories of Formation of the Coptic-Muslim SES Gap
One explanation for the emergence of Copts’ economic advantage over Muslims that differs from tax-induced self-selected conversions is that Egypt’s rulers may have preferred to recruit Copts in the bureaucracy. For one, Copts were more likely than Muslims to cooperate with rulers whose doctrine differed from that of Egypt’s Muslim (Sunni) population. A famous example here is the Fatimids (969–1171), who were Ismaili Shiites and preferred to recruit non-Muslims in top state posts. For another, Copts were perhaps better candidates to fill the local bureaucracies of districts with relatively larger Muslim populations, because as Copts lacked local support bases in these districts, they were less likely to rebel or support Muslim rebels. This mechanism is unlikely to fully explain the Coptic-Muslim SES gap, though. Copts’ SES advantage did not stem from top state posts, but from mid-low bureaucracy and artisanship where rulers’ preferences played less of a role. And even in local rural bureaucracies, Copts rarely reached top posts that would have allowed them to lead (or subdue) rebellions. Indeed, Online Appendix Table D.7 shows that the share of Copts in the bureaucracy was, if anything, increasing in Copts’ population share, controlling for the bureaucracy size; districts with larger Coptic populations filled their bureaucracies with more Copts. This suggests that rulers filled local bureaucracies with qualified personnel regardless of their religion.
Another set of explanations of the Coptic-Muslim SES gap emphasizes Western Europe’s influence in Egypt starting from 1800. Charles Issawi (Reference Issawi1981) and Timur Kuran (Reference Kuran2004a) postulated that the privilege of non-Muslim minorities emerged in the nineteenth century because Europeans favored non-Muslims or because non-Muslims adopted European legal structures. The role of the expansion of European schools in the rise of Egypt’s non-Muslim minorities has also been explored (Salama Reference Salama1963; Abecassis Reference Abecassis2000). But although these theories may indeed account for part of the SES advantage of non-Coptic Christians and Jews and for the (possibly) widening SES gap between Copts and Muslims after 1850, they do not fully account for the findings. They do not explain why the Coptic-Muslim SES gap emerged by 969, long before the rise of Europe. Furthermore, the 1848–1868 censuses record the “protégé” status that individuals purchased from European consulates in return for having access to European legal structures. Table D.6 reveals that the share of protégés was negligible (<1 percent) among Muslims and Copts in both 1848 and 1868. Protégés were only sizable among non-Coptic Christians (17–26 percent) and Jews (8–10 percent); the two groups constituted only 6 percent of non-Muslims in Egypt and were mostly urban. These differences are likely due to occupational specialization. While non-Coptic Christians and Jews excelled in commerce; a profession that involved transactions with Europeans where access to European laws mattered, Copts’ advantage stemmed from artisanship and bureaucracy where European laws had less of an influence.
Finally, as Jews’ economic advantage has often been explained by the ban on Jews from practicing certain jobs such as farming, one might extrapolate this explanation to Copts. Yet, Copts were not banned from farming; one third of adult employed male Copts in 1848–1868 were farmers. If anything, Copts were banned from high-level bureaucracy, military, police, judiciary, and clergy, which likely mitigated the gap.
Theories of Persistence of the Coptic-Muslim SES Gap
If SES and (genetic) ability are positively correlated, the positive selection on SES of non-convert Copts will imply selection on ability. The persistence of the Coptic-Muslim SES gap may thus be attributable to the persistence of ability differentials. Although I cannot rule out this explanation given that we lack genetic evidence on ability differences between Copts and Muslims, I argue that it is unlikely to account for persistence because it relies on assumptions that have limited support from history. First, historical evidence on group restrictions on apprenticeships suggests that SES in medieval Egypt was at most weakly correlated with ability. Furthermore, the fact that the SES gap declined in the late twentieth century with the expansion of mass modern education, that relaxed group control over access to (white-collar) skills, implies that ability differences, if any, were less influential. Second, even if there were initial ability differences, they are unlikely to persist for over a millennium unless we assume within-group selected marriages on ability. Strictly speaking, both endogamy and successive selected conversions on ability (due to, say, the continuous imposition of the poll tax until 1856 and idiosyncratic shocks to ability) are insufficient to generate persistence. This is because, unlike Jews and non-Coptic Christians who were homogeneously rich, mostly urban, elites, Copts were much more heterogeneous on SES (ability). This heterogeneity was possibly the result of cross-district differences in the poll tax, and the fact that the selection effect of the poll tax was conditional on religiosity. Consequently, even under endogamy and repeated selected conversions, since poor Copts likely had the same ability as poor converts, the possibility of marriages between rich and poor Copts would lead Copts’ ability to regress to the population mean. Third, even if we assume within-group selected marriages on ability, these do not explain why Copts did not disappear given that there were likely idiosyncratic shocks to ability leading to new conversions in every generation.Footnote 26 Finally, ability differences do not explain why Copts and Muslims persisted in specific occupations (and not merely that Copts maintained a higher SES).
Apart from genetics, persistence of inter-group SES inequality can also be attributed to intergenerational transmission of cultural differences. Following Botticini and Eckstein (Reference Botticini and Eckstein2005), one can argue that Coptic Christianity, like Rabbinic Judaism, encouraged the accumulation of human capital which pushed Copts with a lower preference for education to convert. This theory is unlikely to hold though as there is no literacy requirement under Coptic Christianity and illiteracy among adult male Copts in 1986 was 34 percent. Furthermore, Coptic schools were purely religious in 641 when conversions started and their shift towards teaching secular subjects by 1700 was possibly a result of selected conversions on SES. Another cultural explanation is due to Weber (Reference Weber and Parsons1905), who explained Protestants’ SES advantage by their work ethic. Yet, Coptic Christianity shared with the Egyptian Muslim Sufi culture a mystic outlook on life that attributed materialistic success to metaphysical factors rather than to hard work. Moreover, the fact that Copts’ advantage stemmed from bureaucracy and artisanship, and not from commerce, indicates that Coptic Christianity was not more conducive to Capitalism than Islam.
Conclusion
Drawing on novel primary data sources, I traced the origins of the superior SES of the Coptic Christian minority in Egypt to the tax system that was imposed upon the Arab Conquest of the then-Coptic Christian Egypt in 641. In particular, I hypothesized that the poll tax, a regressive tax removed upon conversion to Islam, led to the shrinkage of Copts into a better-off minority. I first drew suggestive evidence on the hypothesis from the long-term trends of the poll tax, Copts’ population share, and the Coptic-Muslim SES gap. I then documented that districts that were subject to a higher poll tax in 641–1100 had relatively fewer Copts in 1200, 1500, and 1848–1868, who were differentially richer in 1848–1868. Finally, I argued that the persistence of the initial positive selection of non-convert Copts is due to group restrictions on access to apprenticeships and schooling that qualified a child to practice white-collar and artisanal occupations.
The findings open two new areas of research. First, an intriguing feature of the poll tax is that it likely lied on the wrong side of the Laffer curve in the sense that an increase in the poll tax rate eroded the tax base (via conversions) and thus reduced the total poll tax revenues. Indeed, historians documented that Muslim rulers faced a trade-off between winning converts and increasing tax revenues. I explore in different work the co-evolution of conversions and taxation in Egypt between 641 and 750. The argument is that this feature of the poll tax led rulers around 750 to impose on converts the higher land tax (kharaj), that was initially confined to non-convert Copts. This policy change shaped the canonical form of Islamic taxation from 750 until 1856. Second, I plan in the future to examine the formation processes of other non-Muslim minorities (non-Coptic Christians and Jews) in Egypt and other countries of the region. There are unexplored data sources that can help to explore this research question including papyri (98 percent of which are still unpublished), sixteenth-century Ottoman tax registers, and Ottoman population censuses in 1891–1914. These sources may reshape our understanding, not only of non-Muslim minorities, but also of the history of the region more generally.
Data Replication Notice
The data from the 1848 and 1868 population census samples are to be used for replication purposes only. Using the 1848 and 1868 census samples for research requires the consent of the author.


