


Oral health plays an essential role in food consumption, mastication, swallowing and speaking(Reference Razak, Richard and Thankachan1). Among community-dwelling older adults, poor oral health is associated with higher rates of sarcopenia(Reference Tanaka, Takahashi and Hirano2), disability(Reference Tanaka, Takahashi and Hirano2) and poor nutritional status(Reference Toniazzo, Amorim and Muniz3). These disorders are major determinants of future health and are associated with increased morbidity and mortality(Reference Forouzanfar and Alexander4). Therefore, older people should be supported to achieve better oral health via their daily activities.
Recommendations for oral health promotion include smoking reduction, oral fluoride use, diet and nutrition improvement, and development of personal skills(Reference Watt and Sheiham5). In some epidemiological studies, oral health-related quality of life (OHRQoL) has been assessed using the Geriatric Oral Health Assessment Index (GOHAI), which reflects an individual’s oral health condition(Reference Naito, Suzukamo and Wakai6–Reference Naito, Suzukamo and Nakayama8). Among dietary factors of poor oral health, consumption of green tea(Reference Nanri, Yamada and Itoi9), fruits and vegetables(Reference Nanri, Yamada and Itoi10) reportedly have an inverse relationship with the prevalence of poor OHRQoL among older people. However, encouraging the consumption of fruits and vegetables as well as discouraging foods with high sugar content are important to ensure good oral health(Reference Coll, Lindsay and Meng11). Poor diet quality, including micronutrient deficiency (vitamin C, D or B12), are related to the onset and progression of dental caries and periodontitis, which are the major causes of tooth loss(Reference Chapple, Bouchard and Cagetti12,Reference van der Velden, Amaliya and Loos13) . Therefore, evaluating the association between oral health and the adherence to dietary guidelines is important, as it will help to increase knowledge on better dietary patterns.
In Japan, the food-based Japanese dietary guidelines for the promotion and teaching of good dietary patterns are called the ‘Japanese Food Guide Spinning Top’(Reference Yoshiike, Hayashi and Takemi14–Reference Kurotani, Akter and Kashino16). Using these guidelines, diet quality score was inversely related to all-cause mortality(Reference Kurotani, Akter and Kashino16). Some dietary patterns are inversely associated with poor oral health status (mainly oral function) in the older population(Reference Osawa, Arai and Takayama17,Reference Kotronia, Brown and Papacosta18) ; however, there are few studies on adherence to dietary guidelines and oral health, including subdomains such as psychosocial and pain and discomfort among community-dwelling older adults. It may provide knowledge to aid the understanding of individualised risk factors for oral health that are linked to the adherence to dietary guidelines. The objective of this cross-sectional study was to examine the association between the prevalence of poor OHRQoL and the score for adherence to the food-based Japanese dietary guidelines in older Japanese individuals. We hypothesised that a higher adherence to the food-based Japanese dietary guidelines is inversely associated with the prevalence of poor OHRQoL in older adults.
Material and methods
Study population
The Kyoto–Kameoka study started on 29 July 2011 and involved 13 294 individuals aged ≥ 65 years by baseline survey in a community-dwelling older population-based cohort; the details are described elsewhere(Reference Nanri, Yamada and Itoi9,Reference Nanri, Yamada and Itoi10,Reference Watanabe, Nanri and Sagayama19–Reference Yamada, Nanri and Watanabe23) . A health and nutrition status survey (additional survey), including GOHAI and FFQ, was conducted on 14 February 2012. Valid responses were obtained from 8319 participants. The baseline and additional surveys were collected by postal mail. Informed consent and the participants’ responses to the questionnaires were obtained simultaneously. Information on medical history, smoking and drinking status, dietary habits, physical activity, and socio-economic status was obtained during each survey. The Ethics Committee of the National Institutes of Biomedical Innovation, Health and Nutrition (NIBIOHN-76–2); Kyoto University of Advanced Science (No. 20–1); and Kyoto Prefectural University of Medicine (RBMR-E-363) approved our study protocol.
Of the 8319 participants, those with incomplete OHRQoL assessment responses (n 122), those with a self-reported ‘need for long-term care’ (n 127) and those with an extremely high or low energy intake (3 sd) on the basis of the mean energy intake of each sex group (n 86)(Reference Watanabe, Yoshida and Nanri21) were excluded. Finally, 7984 participants were included in this cross-sectional study.
Calculation of the score for adherence to the food-based Japanese dietary guidelines
To estimate dietary nutrient and food intake, participants were asked to report their intake frequency over the past year in a validated self-administered FFQ(Reference Watanabe, Nanri and Sagayama19,Reference Watanabe, Nanri and Yoshida20,Reference Imaeda, Goto and Sasakabe24,Reference Tokudome, Goto and Imaeda25) that consisted of forty-seven food and beverage items. Food and nutrient intake were calculated using the frequency of appearance of each food and beverage category in the questionnaire and the portion size of food consumed by each sex group(Reference Tokudome, Goto and Imaeda26) or by using a programme based on the Standard Tables of Food Composition in Japan (fifth revised edition)(27). To estimate the energy intake accurately, the calibrated energy intake was calculated using our previously developed equation that was based on the doubly labelled water method(Reference Watanabe, Nanri and Sagayama19).
The scores for adherence to the Japanese Food Guide Spinning Top(Reference Yoshiike, Hayashi and Takemi14–Reference Kurotani, Akter and Kashino16) were calculated. We previously reported the scoring method of these guidelines and details of the calculation are described elsewhere(Reference Kurotani, Akter and Kashino16). The Japanese Food Guide Spinning Top includes seven food and nutrient domains related to healthy dietary patterns, including grains, vegetables, fish and meat, milk, fruits, energy diets, and snacks and alcohol. Like in a previous study, we added the ratio of white to red meat as a component of the score(Reference Kurotani, Akter and Kashino16). Each domain is calculated using the food serving size and nutrient intake. The ratio of white to red meat was calculated using the sum of each estimated food intake. The recommended number of servings and total energy intake for each domain were identified according to sex, age and physical activity level. The adherence scores were calculated using the amount of food servings and nutrient intake that were in line with these recommended values. Each component of the score had a value between 0 and 10. The scores of each component are summed to obtain the total score that ranges from 0 (worst) to 80 (best).
Definition of poor oral health-related quality of life
OHRQoL was assessed using the GOHAI, which is a validated self-administered questionnaire consisting of twelve items(Reference Naito, Suzukamo and Wakai6–Reference Naito, Suzukamo and Nakayama8). The GOHAI includes three hypothetical domains of oral health: five items on physical function, five items on psychosocial function, and two items on pain and discomfort(Reference Naito, Suzukamo and Nakayama8). Using a five-point ordinal scale, participants were asked to respond to each question: their responses took into consideration the 3-month period before the study. The points ranged from 12 (worst OHRQoL) to 60 (best OHRQoL), and a poor OHRQoL was defined as ≤50 points(Reference Nanri, Yamada and Itoi9,Reference Nanri, Yamada and Itoi10) . There is a reported association between the GOHAI score and number of teeth and denture use, and the reliability of GOHAI has been confirmed in older Japanese people(Reference Naito, Suzukamo and Nakayama8). Additionally, we investigated the association between the GOHAI subdomains and adherence to the food-based Japanese dietary guidelines.
Statistical analysis
The participants were classified into quartiles (Qs) of scores for adherence to the food-based Japanese dietary guidelines. The continuous variables are expressed as means and standard deviations. The categorical variables are expressed as numbers with percentages. Multiple imputation on five data sets was performed using the multivariate imputation by the chained equation package from R statistical software to prevent logical errors or missing answers for covariates(Reference van Buuren and Groothuis-Oudshoorn28). Missing data were assumed to be missing at random. In addition, the participants’ characteristics were compared between participants with complete data and participants with incomplete data.
The nutrient density method using uncalibrated energy intake was employed to adjust dietary intake for energy intake per 4184 kJ(Reference Willett and Stampfer29). The values are expressed as medians in each Q group. The association between adherence score and dietary intake was confirmed using Spearman’s correlation analysis.
The number of participants with a poor OHRQoL is shown as number (%). To confirm the association between the prevalence of poor OHRQoL and adherence score, a multivariate logistic regression analysis adjusted for covariates was performed using the following models: model 1 was adjusted for age (continuous), sex (female or male) and population density (≥ 1000 or < 1000 people/km2); model 2 was similar to model 1, but it was also adjusted for BMI (continuous), moderate physical activity (yes or no), smoking status (never smoker, past smoker and current smoker), alcohol status (drinkers or non-drinkers), educational attainment (< 9, 10–12 or ≥ 13 years), medication use (yes or no), living alone (yes or no), socio-economic status (high or low), green tea consumption (frequency), coffee consumption (frequency) and history of disease (yes or no); model 3 was similar to model 2, but it was also adjusted for denture use (yes or no), poor mastication (yes or no), dry mouth (yes or no), choking accident (yes or no), regular dental check-up (yes or no) and daily tooth brushing (yes or no). The variance inflation factor ≤ 10 was used as an indicator to avoid multicollinearity(Reference Fox and Monette30). Models 1 and 2 were adjusted for variables with reference to covariates from previous studies(Reference Watanabe, Yoshida and Nanri21,Reference Watanabe, Yoshida and Yokoyama22) . Model 3 was adjusted for oral health-related variables because both OHRQoL and dietary intake are dependent on the oral health status(Reference Watanabe, Yoshida and Yokoyama22); these variables are factors of poor oral health progression and function and may induce poor diet quality(Reference Savoca, Arcury and Leng31). The prevalence rates of poor OHRQoL in the Qs are shown as OR with 95 % CI, with the first Q (lowest adherence score) being the reference. OR and the corresponding 95 % CI were estimated for a 10-point increase in adherence score. The linear trend P-value was calculated after considering the adherence score, as a continuous variable. It was necessary to exclude the effects of sex and denture use because it has been reported that diet quality is lower in men(Reference Kurotani, Akter and Kashino16) and participants who use dentures(Reference Nanri, Yamada and Itoi9,Reference Nanri, Yamada and Itoi10) have higher rates of poor oral health. Therefore, a subgroup analysis stratified by sex or denture use (yes or no) was performed. A multivariate least squares regression model, composed of the above-mentioned covariates, was used to adjust for confounders of the association between the subdomain score (evaluated using the GOHAI) and adherence score. In addition, the association between the prevalence of poor OHRQoL and the adherence score for each of the eight components of the Japanese Food Guide Spinning Top was evaluated. Furthermore, using a restricted cubic spline model, the curve of the relationship between adherence score, prevalence of poor OHRQoL and the subdomain score (from the GOHAI) was evaluated by considering three data points (5th, 50th and 95th percentiles) on the basis of the distribution of the recommended adherence score(Reference Lee, Shiroma and Kamada32). Considering that the data were sparse, we truncated the analysis at 30 points (1 % of distribution)(Reference Lee, Shiroma and Kamada32). We calculated the OR for the association between prevalence of poor OHRQoL and adherence score using 43·3 points (first Q value) as the reference in the restricted cubic spline model(Reference Lee, Shiroma and Kamada32).
A P-value < 0·05 was considered significant. All statistical analyses were computed using STATA MP, version 15.0 (StataCorp LP) and/or R statistical software 3.4.3 (R Core Team).
Results
The baseline characteristics of the study participants are shown in Table 1. The mean score for adherence to the food-based Japanese dietary guidelines was 54·3 (range, 8·5–76·2). Compared with participants with a lower adherence score, participants with a higher score were more likely to be women, live alone, have a history of dyslipidaemia and have a higher socio-economic status and educational attainment. They were less likely to be alcohol drinkers, current smokers and use dentures. Participants with missing values were older (higher age); however, there was no difference in sex between them and those with complete values (online Supplementary Table S1).
Table 1. Baseline characteristics of the study participants
(Mean values and standard deviations; numbers and percentages)
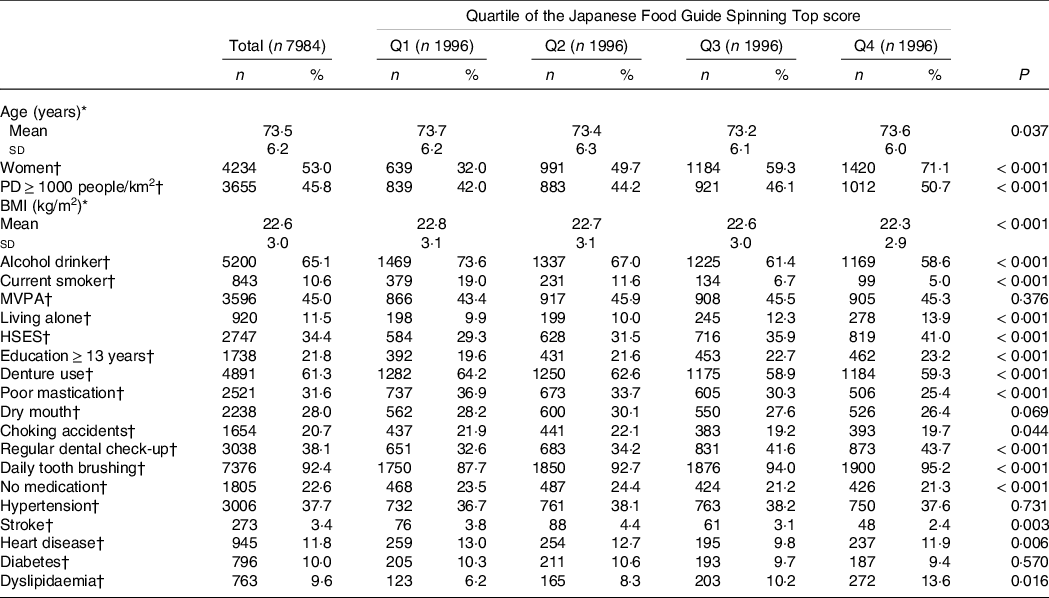
Multiple imputations were performed for participants with missing data, and missing variables were imputed: BMI (n 39; 0·5 %), alcohol status (n 305; 3·8 %), smoking status (n 358; 4·5 %), physical activity (n 543; 6·8 %), family structure (n 618; 7·7 %), socio-economic status (n 382; 4·8 %), educational attainment (n 926; 11·6 %), denture use (n 217; 2·7 %), poor mastication (n 197; 2·5 %), dry mouth (n 266; 3·3 %), choking accidents (n 181; 2·3 %), regular dental check-up (n 332; 4·2 %), daily tooth brushing (n 214; 2·7 %) and medications (n 632; 7·9 %). Q1, Q2, Q3 and Q4 include the Japanese Food Guide Spinning Top scores of < 49·3, 49·3–54·8, 54·9–60·1 and ≥ 60·2, respectively. PD, population density; MVPA, moderate to vigorous physical activity; HSES, high socio-economic status; .
* Continuous variables are expressed as mean with standard deviation and were analyzed using variance analysis.
† Categorical values are shown as numbers (percentage) and were analyzed using the Chi-square test. MVPA refers to those who had MVPA exercise habits from a questionnaire. Have you choked on your tea or soup recently? If a participant responded ‘Yes’ to this question, this was defined as ‘choking accidents’.
The association of adherence scores with nutrient and food intake is shown in Table 2. Adherence score was moderately correlated with vitamin C intake (r = 0·46), vegetables (r = 0·41), fruits (r = 0·56) and dairy products (r = 0·46). Participants with higher adherence scores tended to have higher fats, folates and Ca intake (r ≥ 0·30).
Table 2. Association between energy and nutrient intake and adherence to the Japanese Food Guide Spinning Top
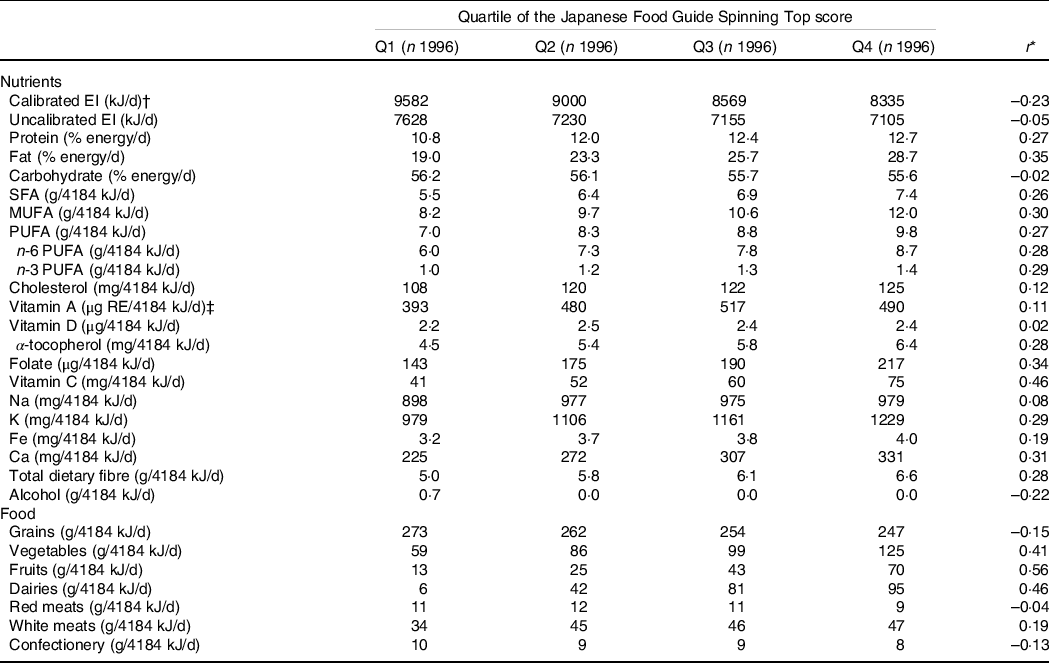
EI, energy intake. Energy intake conversion factor: 1 kJ = 0.239 kcal.
All values are presented as median or correlation coefficient. Nutrient intake was adjusted for energy intake via the nutrient density method by using uncalibrated energy intake. The values are expressed as median in each quartile group. Q1, Q2, Q3 and Q4 include the Japanese Food Guide Spinning Top scores of < 49·3, 49·3–54·8, 54·9–60·1 and ≥ 60·2, respectively.
* Spearman’s correlation analysis was used for the relationship between dietary intake and adherence score.
† Calibrated EI was calculated using the equation we developed.
‡ Sum of retinol, β-carotene/12, α-carotene/24 and cryptoxanthin/24.
The prevalence of poor OHRQoL was 36·0 % in Q1, 32·1 % in Q2, 27·9 % in Q3 and 25·1 % in Q4 (Table 3). In model 3, we found an inverse association between score for adherence to the food-based Japanese dietary guidelines and poor OHRQoL among all the participants (Q1: reference; Q2: OR, 0·87 (95 % CI: 0·75, 1·00); Q3: OR, 0·77 (95 % CI: 0·66, 0·90); Q4: OR, 0·72 (95 % CI: 0·62, 0·85); P for trend < 0·001), with adjustments for potential confounders. Moreover, the multivariable-adjusted OR (95 % CI) of poor OHRQoL for a 10-point increment was 0·85 (0·78, 0·92) in model 3. These relationships were similar to those found in the spline model (Fig. 1). Two subgroup analyses (stratified by sex and denture use) showed results similar to those in the multivariate-adjusted model (online Supplementary Table S2). In addition, there was a positive association of adherence score to scores for total, physical functioning, psychosocial functioning, and pain and discomfort, which were evaluated using the GOHAI subdomains (Fig. 2 and online Supplementary Table S3).
Table 3. Multivariable logistic regression analyses of the prevalence of poor oral health-related quality of life according to the score for adherence to the Japanese Food Guide Spinning Top
(Odd ratios and 95 % confidence intervals; mean values and standard deviations; numbers and percentages)
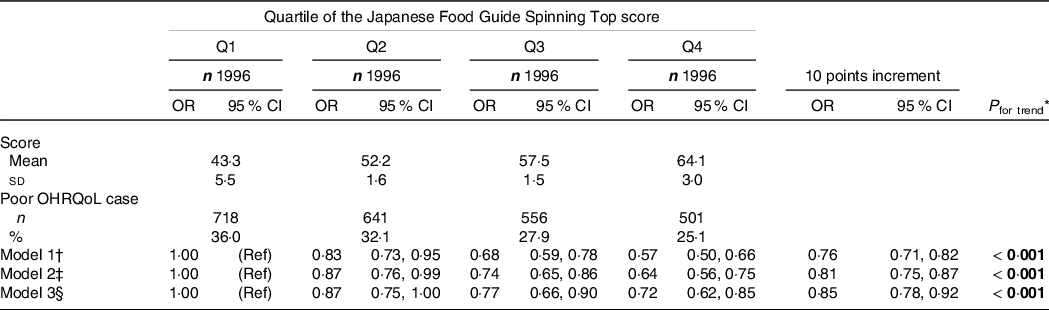
All values are expressed as mean (sd), number (%) or relative OR (95 % CI). All estimates were derived from the multivariable logistic regression model. Poor OHRQoL is defined as a score ≤ 50 on a validated GOHAI. Bold P-values are statistically significant (P < 0·05). Q1, Q2, Q3 and Q4 include the Japanese Food Guide Spinning Top scores of < 49·3, 49·3–54·8, 54·9–60·1 and ≥ 60·2, respectively. GOHAI, Geriatric Oral Health Assessment Index; OHRQoL, oral health-related quality of life; Ref, reference.
* Linear trend P-values were calculated using the likelihood ratio test and a continuous variable of adherence score.
† Model 1 was adjusted for age, sex and population density.
‡ Model 2 was model 1 plus adjustment for BMI, moderate physical activity, smoking status, alcohol status, education, medications, living alone, socio-economic status, green tea consumption, coffee consumption and history of disease (hypertension, diabetes mellitus, dyslipidaemia, heart disease and stroke).
§ Model 3 was model 2 plus mutual adjustment for denture use, poor mastication, dry mouth, choking accidents, regular dental check-up and daily tooth brushing.
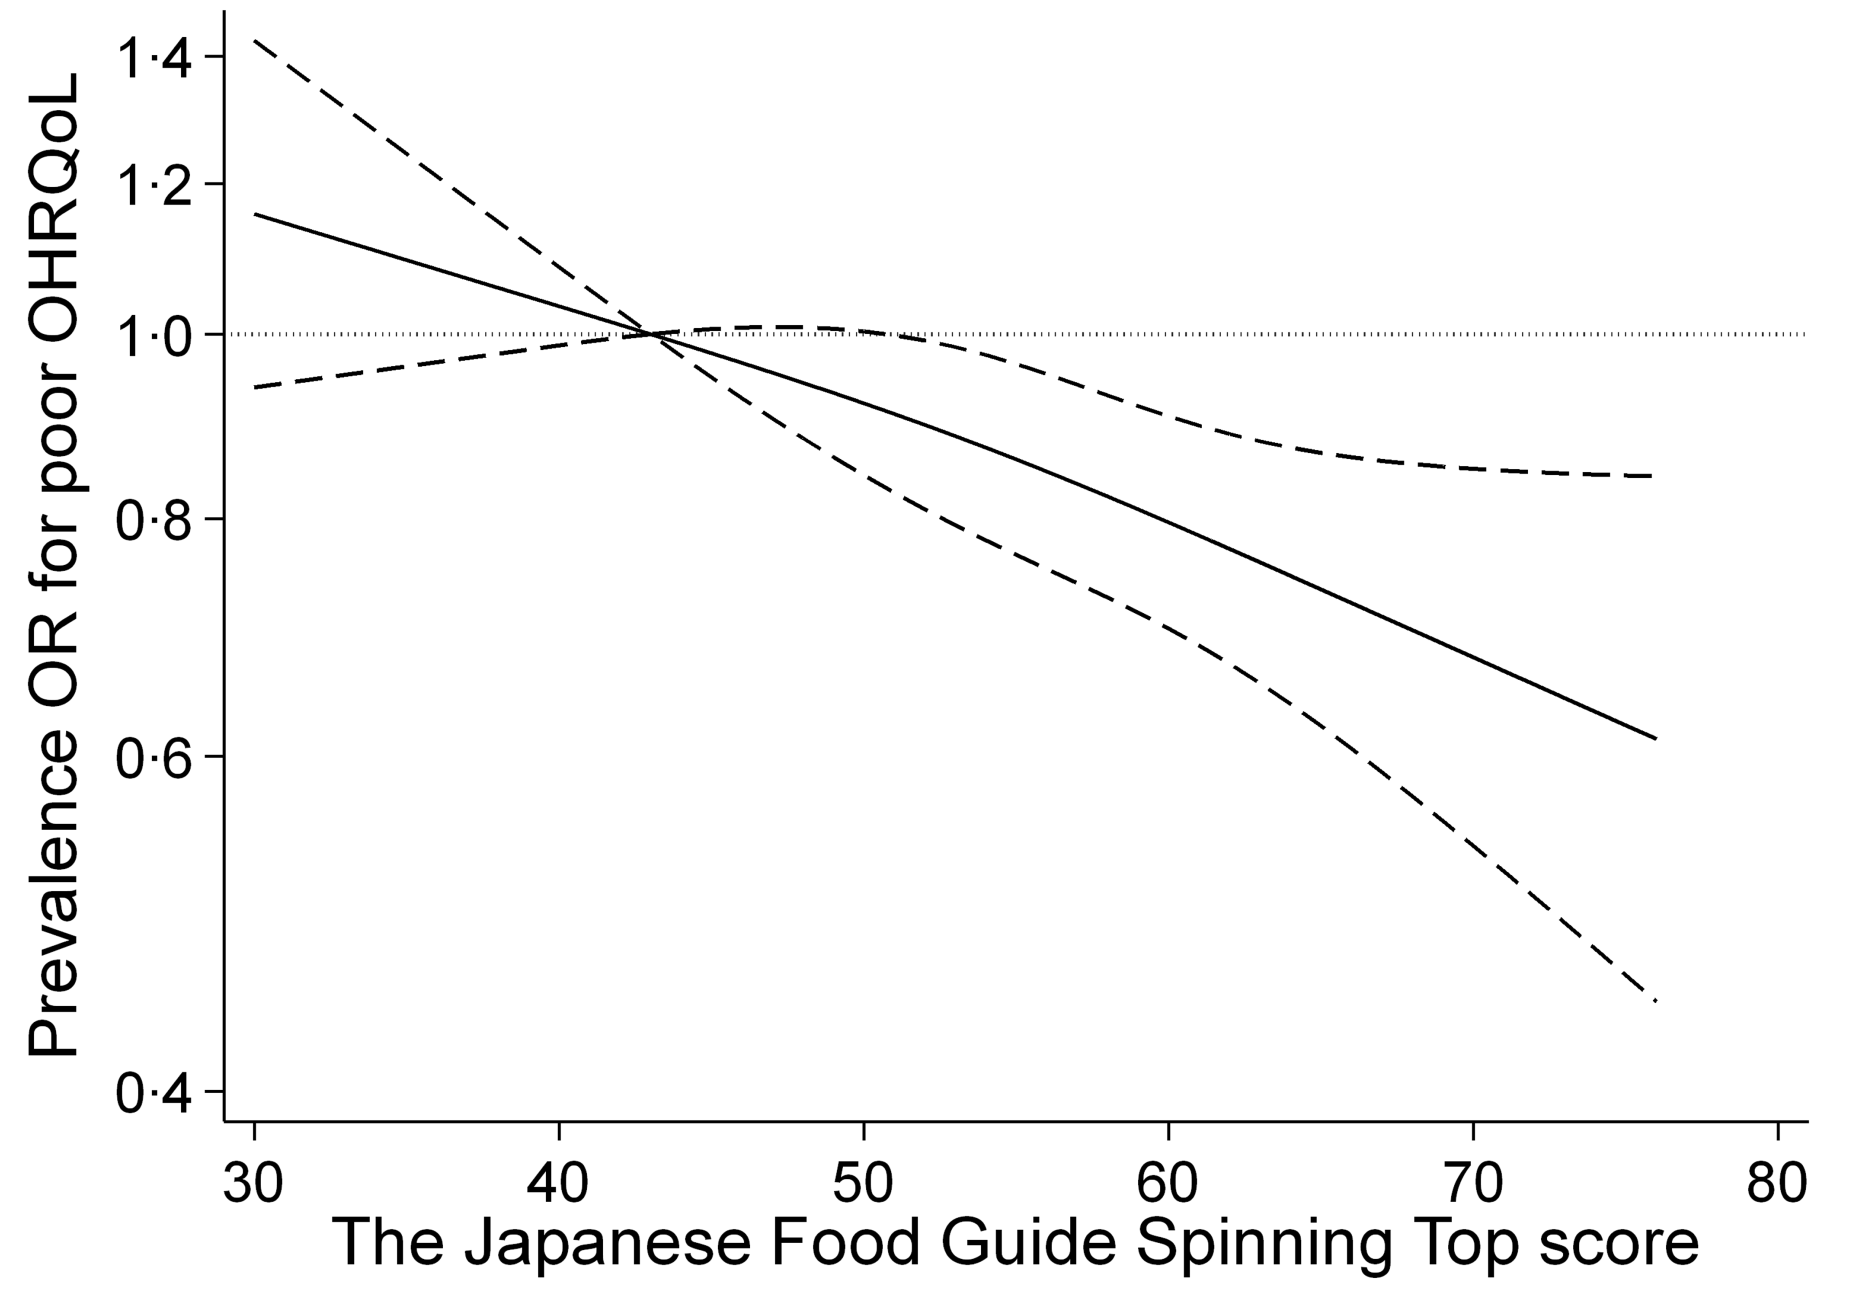
Fig. 1. Association between score for adherence to the food-based Japanese dietary guidelines and prevalence of poor oral health-related quality of life (OHRQoL) using a restricted cubic spline logistic regression model. Poor OHRQoL is defined as a score ≤ 50 on a validated Geriatric Oral Health Assessment Index (GOHAI). Solid lines represent OR, and dashed lines represent 95 % CI. We calculated OR for the prevalence of poor OHRQoL by using the first quartile value of 43·3 points as the reference. This analysis included 7902 participants. We estimated that P < 0·05 and P ≥ 0·05 when the 95 % CI of the OR did not exceed 1·00 and exceeded 1·00, respectively. Analyses were adjusted for age, sex, population density, BMI, physical activity, smoking status, alcohol intake status, educational attainment, medication use, living alone, socio-economic status, green tea consumption, coffee consumption, history of disease (hypertension, diabetes, dyslipidaemia, heart disease and stroke), denture use, poor mastication, dry mouth, choking accidents, regular dental check-up and daily tooth brushing.
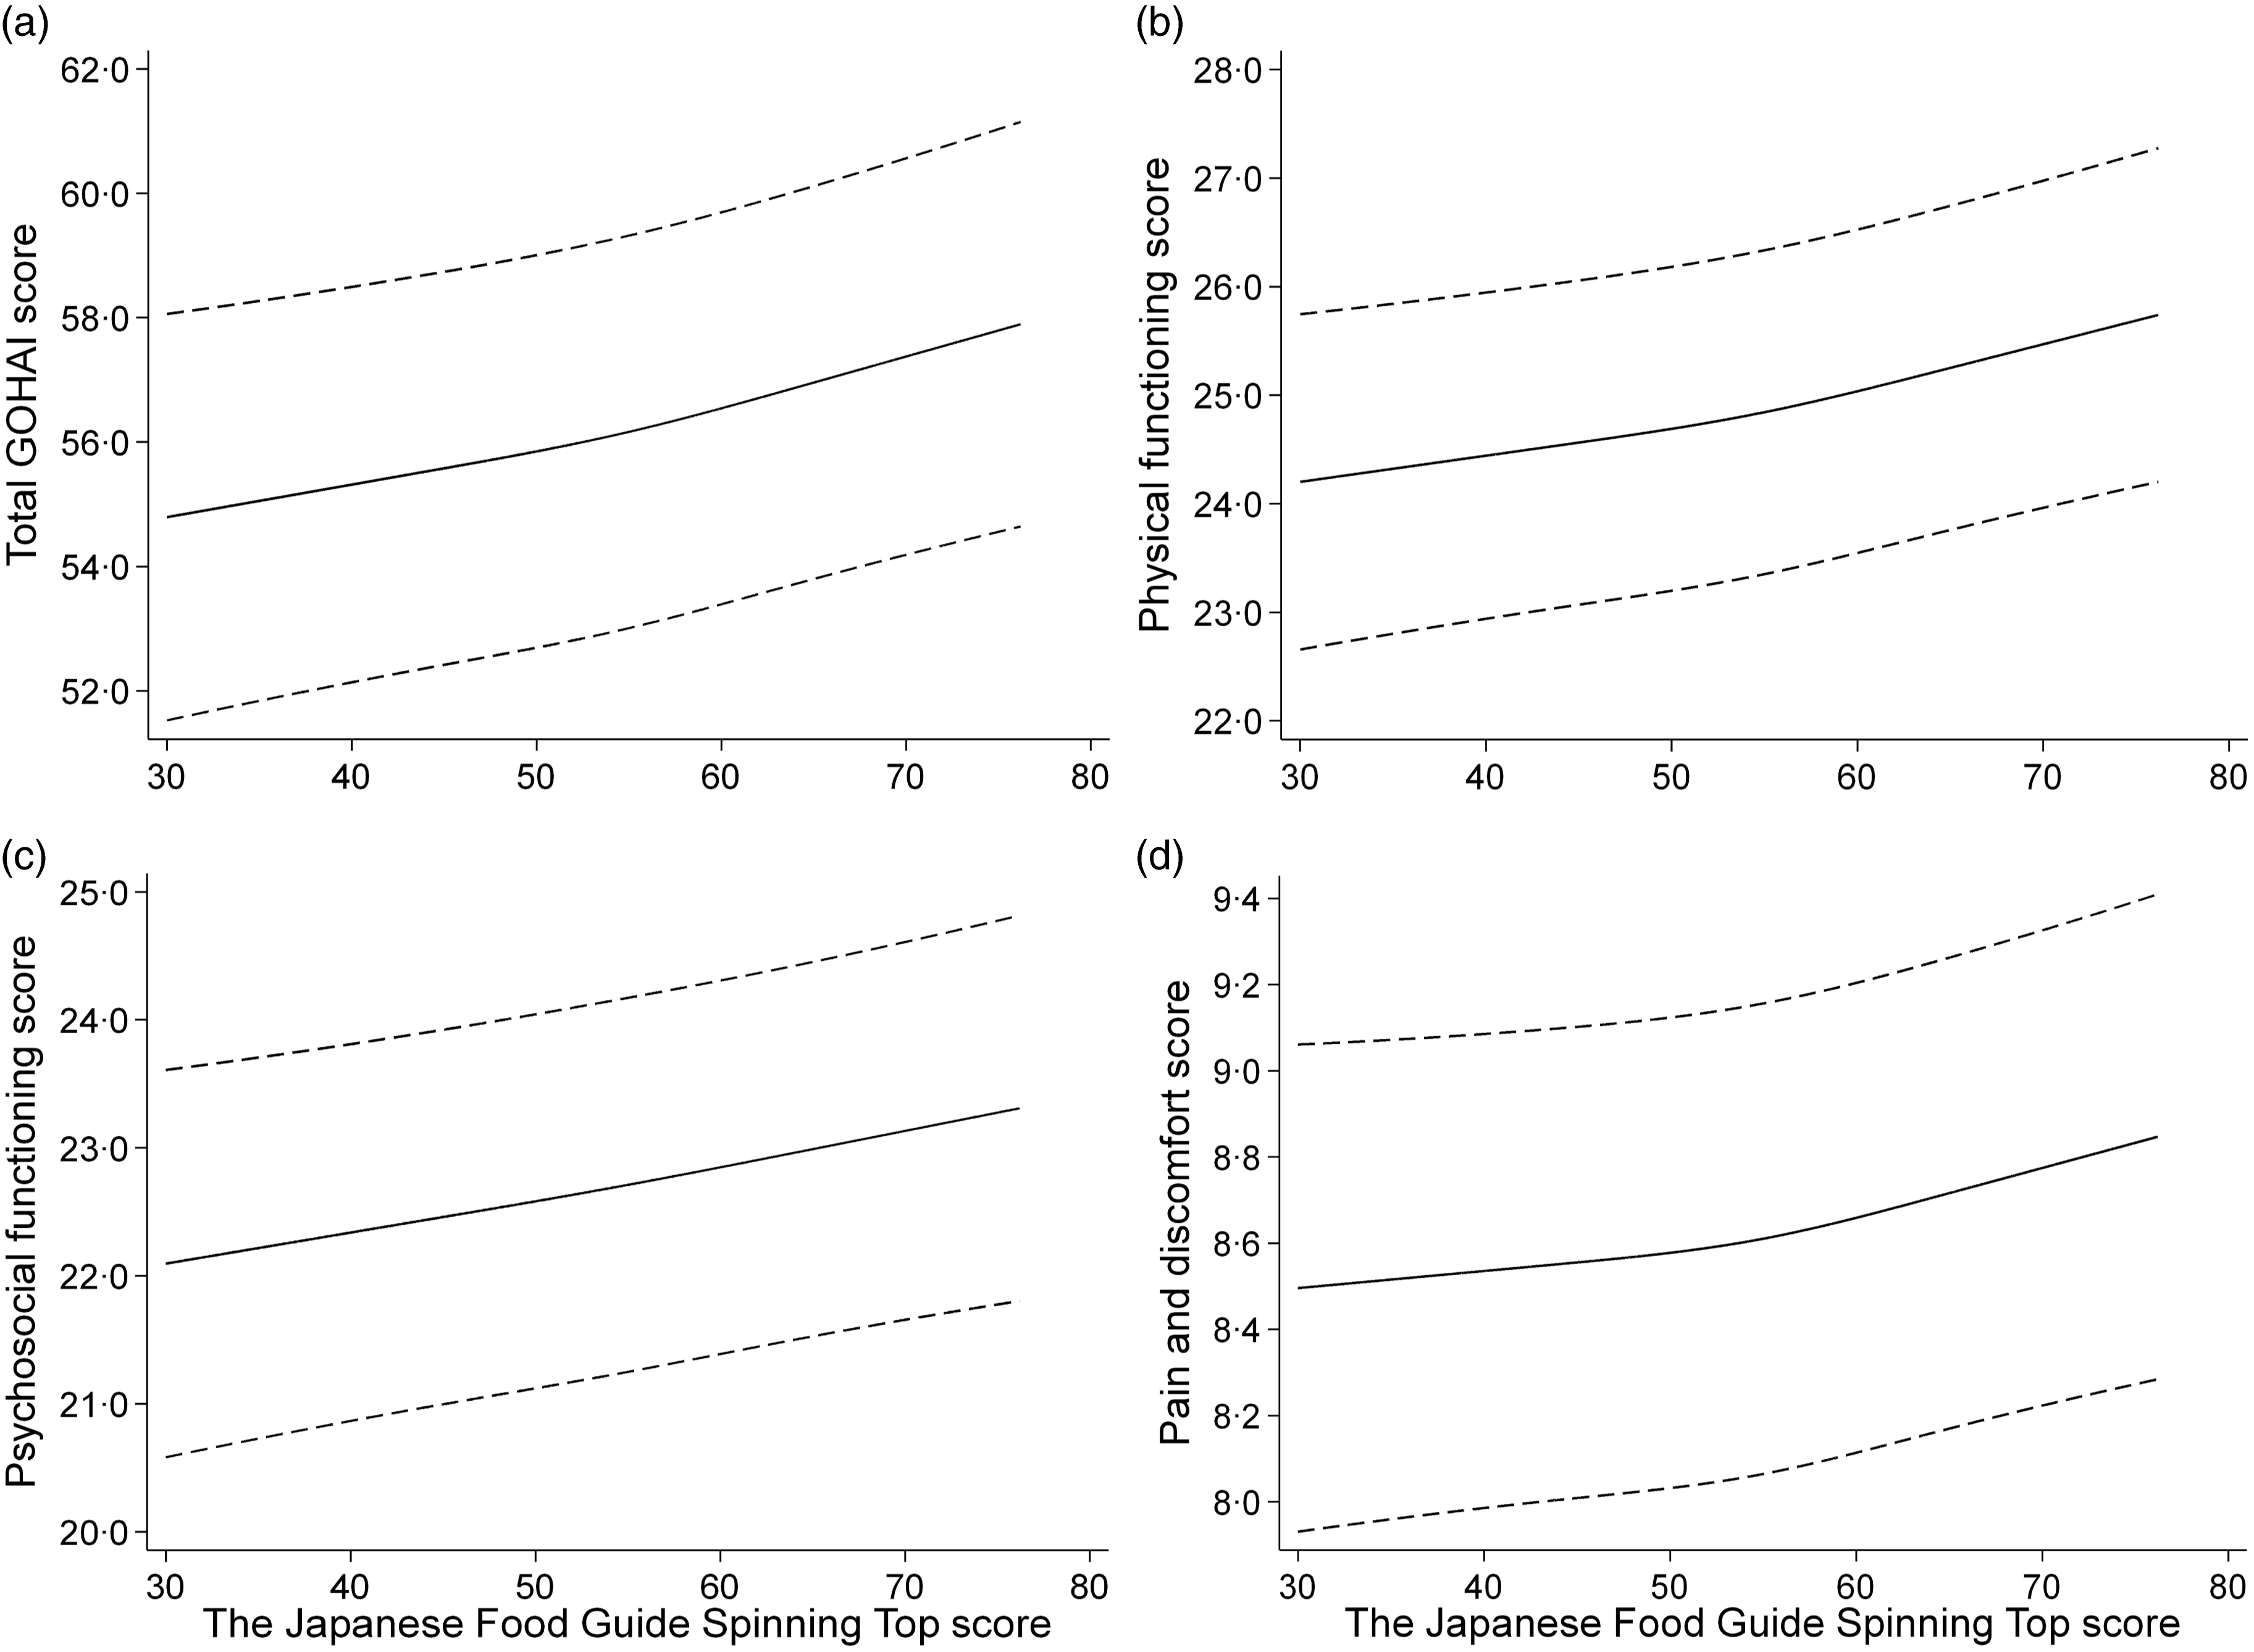
Fig. 2. Relationship between score for adherence to the food-based Japanese dietary guidelines and scores of the total and subdomains for the Geriatric Oral Health Assessment Index (GOHAI) by a restricted cubic spline model. Oral status was evaluated using the (a) total score, (b) physical functioning score, (c) psychosocial functioning, and (d) pain and discomfort via a validated GOHAI. Solid lines represent mean, and dashed lines represent 95 % CI. This analysis included 7902 participants. Analyses were adjusted for age, sex, population density, BMI, physical activity, smoking status, alcohol intake status, educational attainment, medication use, living alone, socio-economic status, green tea consumption, coffee consumption, history of disease (hypertension, diabetes, dyslipidaemia, heart disease and stroke), denture use, poor mastication, dry mouth, choking accidents, regular dental check-up and daily tooth brushing.
Associations between the prevalence of poor OHRQoL and the score for adherence to each component of the food-based Japanese dietary guidelines are shown in Table 4. In the multivariate logistic analyses, there was a significant inverse association of the participants with higher scores for adherence to the consumption recommendations for vegetables, fruits, and snacks and alcohol with the OR of poor OHRQoL compared with those in the bottom Q in Model 3. However, there was no significant association between poor OHRQoL and adherence score for other components.
Table 4. Multivariable logistic regression analyses of the prevalence of poor oral health-related quality of life according to the components of the score for adherence to the Japanese Food Guide Spinning Top
(Odd ratios and 95 % confidence intervals)
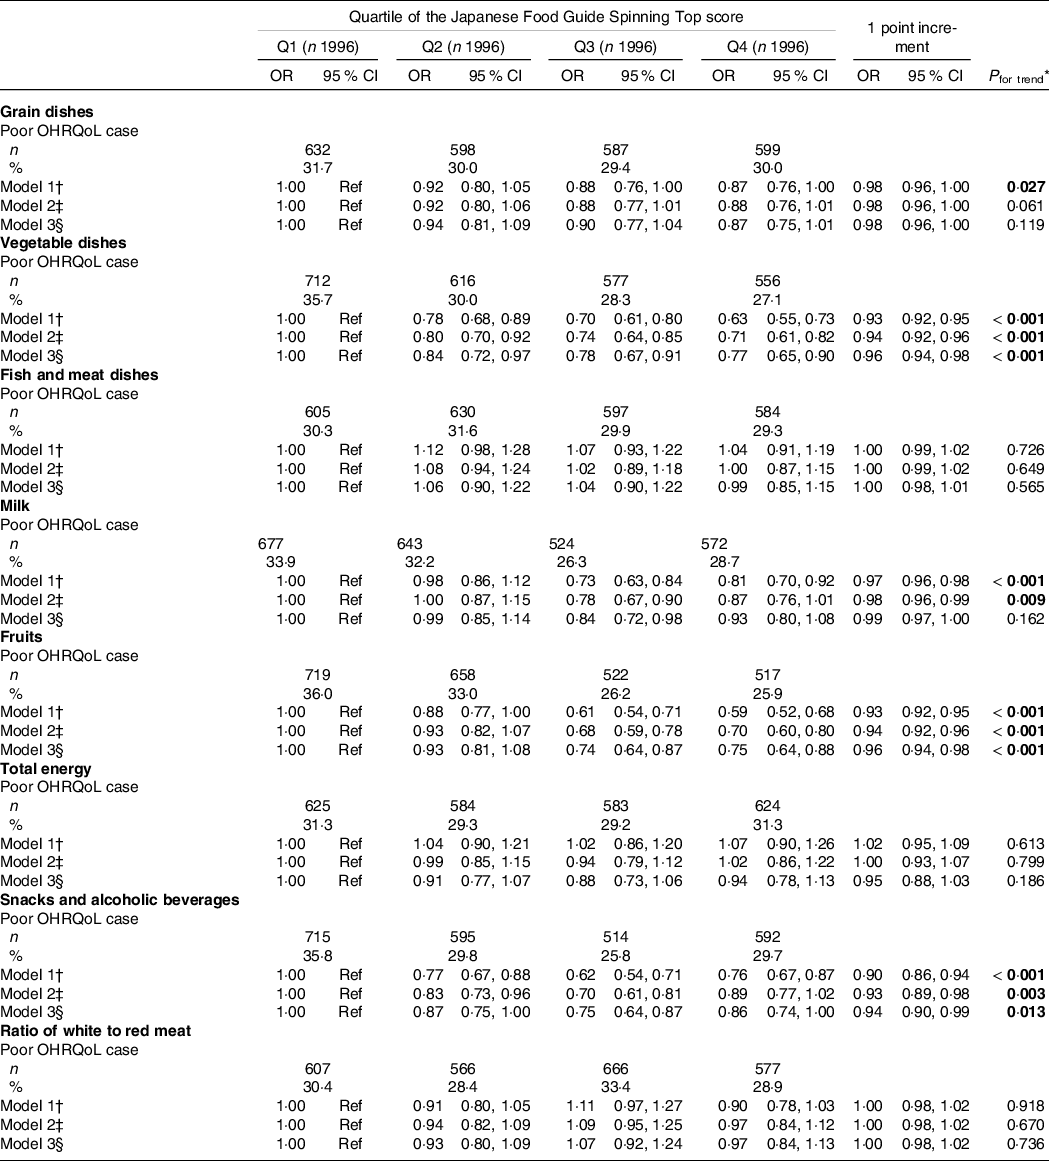
All values are expressed as numbers (%) or relative OR (95 % CI). All estimates were derived from the multivariable logistic regression model. Poor OHRQoL is defined as a score ≤ 50 on a validated GOHAI. Bold P-values are statistically significant (P < 0·05). The food score ranges in Q1, Q2, Q3 and Q4 are as follows: < 7·1, 7·1–8·9, 9·0–9·8 and ≥ 9·9 score for grain dishes, respectively; < 2·7, 2·7–4·3, 4·4–6·4 and ≥ 6·5 score for vegetable dishes, respectively; < 4·7, 4·7–7·7, 7·8–9·7 and ≥ 9·8 score for fish and meat dishes, respectively; < 0·6, 0·6–5·2, 5·3–7·7 and ≥ 7·8 score for milk, respectively; < 1·3, 1·3–3·1, 3·2–5·5 and ≥ 5·6 score for fruits, respectively; < 8·8, 8·8–9·3, 9·4–9·8 and ≥ 9·9 score for total energy intake, respectively; < 8·7, 8·7–9·5, 9·6–9·8 and ≥ 9·9 score for snacks and alcohol beverages, respectively; and < 5·8, 5·8–8·9, 9·0–9·8 and ≥ 9·9 score for white to red meat ratio, respectively. OHAI, Geriatric Oral Health Assessment Index; OHRQoL, oral health-related quality of life; Ref, reference.
* Linear trend P-values were calculated by using the likelihood ratio test and a continuous variable of adherence score.
† Model 1 was adjusted for age, sex and population density.
‡ Model 2 was model 1 plus adjustment for BMI, moderate physical activity, smoking status, alcohol status, education, medications, living alone, socio-economic status, green tea consumption, coffee consumption and history of disease (hypertension, diabetes mellitus, dyslipidaemia, heart disease and stroke).
§ Model 3 was model 2 plus mutual adjustment for denture use, poor mastication, dry mouth, choking accidents, regular dental check-up and daily tooth brushing.
Discussion
Our study showed an inverse association between the score for adherence to the food-based Japanese dietary guidelines and prevalence of poor OHRQoL. Participants with higher adherence scores for vegetables, fruits, and snacks and alcohol had a lower prevalence of poor OHRQoL. To the best of our knowledge, this is the first study to verify the association between OHRQoL (including subdomains such as psychosocial and pain and discomfort) and adherence to dietary guidelines in community-dwelling older adults. Our results may corroborate the essential role of adherence to dietary guidelines on oral health.
Our results showed that higher scores for adherence to the food-based Japanese dietary guidelines were inversely associated with the prevalence of poor OHRQoL even after adjustment for potential confounding variables such as oral hygiene and function (model 3). In addition, our results showed that scores for adherence to vegetable and fruit consumption recommendations of the food-based Japanese dietary guidelines were inversely associated with poor OHRQoL. We have previously shown that the consumption of green tea(Reference Nanri, Yamada and Itoi9), fruits and vegetables(Reference Nanri, Yamada and Itoi10) were inversely related to poor OHRQoL in older people. We speculated that because these types of food are rich in antioxidants, they may contribute to better oral health. The deficiencies of antioxidants such as vitamins A, C, and E, Cu, and Fe may attenuate the anti-inflammatory and immune responses of oral tissues(Reference Touger-Decker and Mobley33). However, our results did not substantially change after adjustment for intake of nutrients such as folates and vitamin C, which was positively correlated with adherence scores, indicating that its effect may be weak. In a previous clinical study, compared with non-vegetarians, vegetarians had better oral health, including less periodontal damage and fewer inflammation signs(Reference Staufenbiel, Weinspach and Forster34). In comparison with a non-vegan diet consumption, the consumption of a vegan diet (emphasising plant-based foods while minimising animal products) was associated with a lower ratio of the species associated with periodontal disease in the salivary microbiota(Reference Hansen, Kern and Bak35). These mechanisms by healthy dietary pattern may explain the effect of adherence to dietary guidelines on oral health, as shown in the present study. In addition, our results showed that adherence to the food-based Japanese dietary guidelines was positively associated with the scores of oral health subdomains such as psychosocial and pain and discomfort. Interventional and basic research is needed to elucidate these detailed mechanisms. Thus, the beneficial effects of adherence to the food-based Japanese dietary guidelines may be strongly related to overall diet quality rather than a specific nutrient intake.
This study showed an association between the score for adherence to snack and alcohol consumption recommendations of the food-based Japanese dietary guidelines and OHRQoL in older adults. The quantity of sugar derived from snacks and confectionery contributes to approximately 30 % of total sugar intake in Japanese adults(Reference Fujiwara, Murakami and Asakura36). The Third National Health and Nutrition Examination Survey has shown that a high consumption of sugar is associated with a greater prevalence of periodontal disease(Reference Lula, Ribeiro and Hugo37), because it may contribute to the chronic systemic inflammation observed in periodontal disease. It may be important to restrict sugar intake to maintain oral health(Reference Coll, Lindsay and Meng11). However, some types of sugars are also contained in fruits and vegetables(Reference Fujiwara, Murakami and Asakura36), and the effects of sugar derived from these fruits and vegetables on oral health are unclear. Swedish children who consumed invert sugar (a mixture of glucose and fructose) converted by enzymatic isomerisation using glucose isomerase to replace sucrose tended to have a lower caries increment for 2 years(Reference Frostell, Birkhed and Edwardsson38). A well-designed study is required to confirm whether different types of sugars have different effects on oral health in older adults because the previous study was conducted among children.
Older adults with dentures tend to avoid some types of food due to chewing difficulties, and they have been reported to have lower dietary quality than those without dentures(Reference Savoca, Arcury and Leng31). This study showed the effect of adherence score on OHRQoL in older adults both with and without denture use. Therefore, it is important to advise older adults on how to obtain an adequate diet from food that is easy to chew and swallow to improve diet quality among people with poor oral health(Reference Razak, Richard and Thankachan1). For example, chewing difficulty has been associated with vegetable consumption more than fruit consumption(Reference Murakami, Sasaki and Takahashi39); therefore, older adults with poor mastication may be advised to consume the required macro- and micronutrients from fruits rather than vegetables. Although a causal relationship between adherence score and poor OHRQoL has not been established, dietary intervention by adherence to dietary guidelines for various foods may be the most reasonable and cost-effective method for reducing the risk of poor OHRQoL. Therefore, a well-designed prospective study that further evaluates the essential role of adherence to dietary guidelines on oral health is required.
Our study has several strengths. This study used population-based data from both older men and older women. In addition, the OHRQoL assessment questionnaire and dietary questionnaire have been widely used and validated. However, there are several limitations to the present study. First, a cross-sectional design was used. Although our results indicated the effect of adherence to the food-based Japanese dietary guidelines on OHRQoL, it is just as plausible that OHRQoL drives diet quality. Therefore, no temporal and direct causal relationship between the prevalence of poor OHRQoL and adherence to the food-based Japanese dietary guidelines can be inferred, and it is necessary to re-evaluate these results in a well-designed prospective study. Second, the participants may have been more aware of health issues than the general population because there was survival bias due to the inclusion of those who survived at the time of analysis. Third, a self-administered questionnaire was used to assess the adherence to the food-based Japanese dietary guidelines and prevalence of poor OHRQoL. A possible misclassification of the population at risk may have occurred because self-reporting bias cannot be avoided. Finally, although we adjusted for several participant characteristics and lifestyle-related factors, it may have been inadequate to adjust for all potential confounding factors, particularly oral health-related factors. The number of natural teeth and information about fillings and crown and tooth extraction could not be obtained for this study, because the oral examinations were not performed by dental professionals. Of the recommended factors for dental caries and periodontal disease prevention among older adults(Reference Coll, Lindsay and Meng11), the models were adjusted for smoking, dry mouth and daily tooth brushing, but they could not be adjusted for oral health-related variables such as assessment of periodontitis and dental caries, supplemental fluoridation use, and daily dental flossing. In Japan, the 8020 campaign was launched in 1989; its aim was to retain more than 20 natural teeth until the age of 80 years to ensure satisfactory mastication abilities(Reference Zaitsu, Saito and Kawaguchi40). This objective has been attained for more than 50 % of the people that were included in the Japan Dental Diseases Survey in 2016(Reference Zaitsu, Saito and Kawaguchi40,41) . Although the concentration of fluoride in drinking water is limited to a maximum of 0·8 mg/l in Japan(Reference Takefuji42), the market share of fluoride dentifrice has increased dramatically from 12 % (1985) to 91 % (2015)(Reference Zaitsu, Saito and Kawaguchi40). It is needed to evaluate parameters such as oral examinations by dental professionals and supplemental fluoridation use. However, even after adjusting for various participant characteristics, the significant associations observed in this study were not changed substantially. In addition, our results were similar after participants with diseases such as stroke, heart disease, diabetes and hyperlipidaemia were excluded.
Oral health is a fundamental component of physical and mental well-being and contributes to the quality of life and systemic health of older adults(Reference Hyde, Dupuis and Mariri43). The Japanese Food Guide Spinning Top is useful for nutritional guidance and education to attract individuals with little interest in diet because it may be easily put into practice in life by presenting a quantitative reference for the daily diet in a straightforward fashion(Reference Yoshiike, Hayashi and Takemi14). Given that overall diet quality scores have been proven to be better predictors of health than any individual dietary component(Reference Buckland, Agudo and Travier44), our results may provide useful insights for the improvement and maintenance of oral health by adherence to the food-based Japanese dietary guidelines in older adults.
Conclusions
Our results suggest that a higher score for adherence to the food-based Japanese dietary guidelines is inversely associated with the prevalence of poor OHRQoL in community-dwelling older adults. Our findings could have useful public health and clinical relevance for diet and oral health. Future studies are required to further evaluate if there is a causal association.
Acknowledgements
The authors would like to thank all members of the Kyoto–Kameoka study group for their valuable contributions. The authors acknowledge several administrative staff of Kameoka City and Kyoto Prefecture. The authors wish to express their gratitude to all participants for their cooperation in this study. The authors also thank Shinkan Tokudome, who was a former director of the National Institute of Nutrition and Health, for providing useful information on the FFQ. The authors would also like to thank Mayu Sugita, Yuki Okabe, Yoshizu Nozawa, Miho Ono, Tomonori Koizumi and Hisamine Kobayashi of Ajinomoto Co., Inc. for providing funds for this study. The authors would like to thank Editage (www.editage.jp) for the English language editing.
The Kyoto–Kameoka study was conducted with JSPS KAKENHI and was supported by a research grant provided to Misaka Kimura (24240091), Yosuke Yamada (15H05363) and Daiki Watanabe (21K17699); by a grant and administrative support from the Kyoto Prefecture Community-based Integrated Elderly Care Systems Promotion Organization since 2011; by Kameoka City under the programme of the Long-term Care Insurance and Planning Division of the Health and Welfare Bureau for the Elderly, Ministry of Health, Labour and Welfare; and by the WHO Collaborating Centre on Community Safety Promotion. The authors acknowledge several administrative staff of Kameoka City and Kyoto Prefecture. Ajinomoto Co., Inc. provided funding to Y.Y. to conduct this study. However, this study is not related to any particular company and does not endorse any particular product.
Study conception and design: D. W., K. K., T. Y., Y. Y. and M. K.; data analyses and interpretation: D. W., K. K., T. Y., C. G., T. K., M. Y. and Y. Y.; drafting of the manuscript: D. W., K. K., T. Y., H. N., H. F. and Y. Y.; revision of the manuscript: D. W., K. K., T. Y. and Y. Y.; data collection: T. Y., Y. W., H. D., A. I., K. I-T., T. K., M. Y., H. F., Y. Y. and M. K.; approval of the manuscript: all authors.
There are no conflicts of interest.
Supplementary material
For supplementary material/s referred to in this article, please visit https://doi.org/10.1017/S0007114521003329


 Open access