


Introduction
Clays are fine-grained, natural soil materials that possess a range of peculiar chemical, mineralogic, and granulometric properties, as well as some plasticity in terms of mechanical properties when mixed with an appropriate amount of water. The structure, the colloid size of the particles, and their constitution give rise to the desired rheological characteristics and sorption capacities. Clays often contain minerals such as quartz, feldspar, carbonates, sulfates, and iron, aluminum, and titanium oxides. These minerals can affect the chemical (e.g. stability and purity), physical (e.g. texture, moisture content, and particle size), and toxicological requirements specified for each clay application (Morekhure-Mphahlele et al., Reference Morekhure-Mphahlele, Focke and Grote2017). In this context, the characterization of clays is essential as the ideal combination of composition and structure can lead to optimal performance for the target application (Bouna et al., Reference Bouna, Ait El Fakir, Benlhachemi, Draoui, Ezahri, Bakiz, Villain, Guinneton and Elalem2020).
The toxicological issue mentioned is linked directly to the application of clays in the pharmaceutical industry. The most common clays for pharmacological applications are kaolinite (Al2Si2O5), talc, smectites, palygorskite, and sepiolite (Massaro et al., Reference Massaro, Colletti, Lazzara and Riela2018). Kaolin (Al2H4O9Si2) with iron oxide was studied by Long et al. (Reference Long, Zhang, Huang, Chang, Hu, Yang, Mao and Yang2018) with a view to controlling bleeding and improving wound-healing performance. Those authors characterized its crystal structure, morphology, coagulation, adsorption, and toxicity by means of kaolin zeta potential, platelet aggregation, XRD, SEM, Fourier-transform infrared spectroscopy (FTIR), cytotoxicity, and hemolysis assays. Kaolinite is applied in gastrointestinal protectors, antidiarrheal products, dermatological protectors, local anesthetics, cosmetic creams, powders, anti-inflammatories, and emulsions (Carretero & Pozo, Reference Carretero and Pozo2010).
Among the range of possibilities cited by the pharmaceutical industry, the potential application of clays as cosmetic products, i.e. in which the material is placed in contact with the outside of the human body, was the focus of the current work. The motivation was linked to the high demand for raw materials in the global cosmetics market; western Europe and North America have the largest share of the world market for cosmetics ingredients, valued at > €30 billion annually. Europe was the world’s largest cosmetics market in 2019 when the price of cosmetics containing these ingredients reached €80 billion (Cosmetic Europe, 2019).
The present work focused on clay extracted from South America, especially kaolinite. Estimates of kaolinite production in the State of Amazonas, in the region of Manaus, Brazil, suggest a production of 500,000 tons/year of kaolin, with a useful production potential of $60 million and a life expectancy of 50 years (Reis et al., Reference Reis, Almeida, Riker and Ferreira2006). Official policy, however, allocates kaolin reserves to white ceramics, paint, and varnish manufacture, and to the electro-electronics industry (Reis et al., Reference Reis, Almeida, Riker and Ferreira2006). There is, therefore, a potential for trade in the cosmetics industry that has not yet been explored fully. Products composed of kaolinite are common in the global market: Aloe Vera and kaolinite have been combined to create peel-off mask gel compositions (Beringhs et al., Reference Beringhs, Rosa, Stulzer, Budal and Sonaglio2013); the potential of emulsions made with kaolin and an ethanolic extract of the Litchi chinensis leaf to inhibit UVB-induced photodamage was investigated by Thiesen et al. (Reference Thiesen, Bretzke, Bittencourt, Silva, Bresolin, Santin and Couto2020).
The literature on kaolinite in the Manaus region deals with mineralogic characterization and transformations (Chauvel et al., Reference Chauvel, Lucas and Boulet1987; Cornu et al., Reference Cornu, Lucas, Lebon, Ambrosi, Luizão, Rouiller, Bonnay and Neal1999; Horbe et al., Reference Horbe, Horbe and Suguio2004). The kaolinitic mineralogy of Manaus comprises kaolinite with low isomorphic substitution by iron and mixture with quartz, gibbsite, and goethite. As expected, the kaolinite from Manaus has a clay-mineral structure (1:1 layer type) with low isomorphic substitution and low cation-exchange capacity (Silva et al., Reference Silva, Lages and Santana2017). In addition, kaolin from the Manaus region is a poorly ordered clay mineral, retaining 2.21% of water (Couceiro & Santana, Reference Couceiro and Santana1999) and having low cation adsorption (Souza & Santana, Reference Souza and Santana2014). This set of properties seems suitable for pharmaceutical applications and has motivated this study to evaluate its potential for the cosmetics industry.
Here, the physical and chemical properties of four samples of clay minerals extracted from the State of Amazonas were studied. The new contributions compared to previous works are based on a broad characterization of clays from the largest biome in the world, carefully evaluating their properties from a pharmacological point of view.
Materials and Methods
Materials
The clays were collected at four locations in Amazonas, Brazil (Fig. 1), at 1–2 m of soil depth. The geographical coordinates were identified on a GPS device (GPS Data-Smart):
• Ponta Negra clay 1 (red): collected at Manaus, Amazonas, in the Ponta Negra region (3°02′53.6" S, 60°05′22.4" W). Code: APN-1.
• Ponta Negra clay 2 (gray): collected at Manaus, Amazonas, in the Ponta Negra region (3°03′26.5" S, 60°06′20.0" W). Code: APN-2.
• Kaolin AM (white): collected at Careiro, Amazonas, (3°49′10.0" S, 60°21′40.4" W). Code: Kaolin.
• Black clay AM (black): collected at Itacoatiara, Amazonas, (3°08′58.9" S, 58°6′13.5" W). Code: AN-Am.

Fig. 1 Locations and colors of the clay samples
Sieve Analysis
Initially, the sample material was oven dried for 24 h at 105°C. Then the material was passed through a tower of sieves consisting of 11 screens with the following mesh sizes (in mm): (1) 2.00; (2) 1.41; (3) 1.00; (4) 0.59; (5) 0.42; (6) 0.35; (7) 0.25; (8) 0.18; (9) 0.125; (10) 0.075; (11) (pan). The set of sieves was vibrated for 2 h until the material passed through all the sieves and reached the bottom. Then the amount retained on each sieve was weighed and the values were noted and tabulated for each sample. The standard for particle-size analysis was ASTM D6913/D6913M (2017).
Moisture Analysis
The humidity content was calculated by Eq. 1:
Approximately 16 g of each wet material was placed in an oven at 105°C for 24 h. Then the material was placed in a desiccator to cool. An analytical balance with a resolution of 0.0001 g (TW223L, Shimadzu, Tokyo, Japan) was used according to ASTM D2216 (2019) protocols.
X-ray Fluorescence Analysis
Three samples (1.5 g) of each material were packed in an Eppendorf tube, and each sample was run 18 times. Prior to WD-XRF testing, 0.4 g of boric acid was added and mixed with the sample material. Subsequently, tablets with uniform granulometry were prepared by uniaxial pressing at 98 kPa. The mixture comprised 1000 g of the sample homogenized with 4000 g of high-purity H3BO3 in an agate mortar. All samples were analyzed in triplicate.
Analyses were performed using an XRF instrument (Rigaku, supermini model, Wilmington, Delaware, USA) using wave dispersion (WD-XRF) and a palladium tube, with an exposure time of 200 s at a power of 200 W. All elements were identified by their Kα and/or Kß energies (Ma & Allen, Reference Ma and Allen2004). Equipment calibrations were carried out using LIF 200, PET, and RX25 crystals with scintillation (SC) and proportional (PC) counter detectors. Geological reference standards such as GBW 3125, 7105, and 7113 were also used for equipment calibration.
Each element was quantified using patterns of external salts of known purity diluted in boric acid. Quantifications were performed based on their intensities (cps/uA) using the ZSX-spectrometer Status program (Rigaku Corporation, 2008), considering the recommendations of the ASTM E1621 (2013) and ASTM C114 (2013) standards. At least six predetermined concentrations submitted to the same analysis conditions were considered.
X-ray Diffraction Analysis
Kaolin samples Ponta Negra clay 1 (APN-1), Ponta Negra clay 2 (APN-2), Black clay AM (AN-Am), and Kaolin AM were evaluated. The clays were ground in an agate mortar before pressing in the sample holder. A diffractometer (Empyrean, Malvern Panalytical, Malvern, UK) with CuKα radiation (λ = 0.1541838 nm), and an angular range of 5–85°2θ, with acceleration voltage and current of 40 kV and 40 mA, respectively, was used. The step size and the time per step were 0.02°2θ and 2 s, respectively. The X-ray photons were detected by an area detector (PIXcel3D-Medipix3 1 × 1).
The diffractograms obtained were indexed against the patterns of the Inorganic Crystal Structure Database – ICSD. All patterns were submitted to the Rietveld method and the GSAS-EXPGUI program package (Larson & Von Dreele, Reference Larson and Von Dreele2004) to refine the structural parameters and, thus, obtain the crystalline cell for the synthesized phase, lattice parameters, crystallite size, and micro tension, and to quantify the current phases. An 8th-order Chebyshev polynomial was chosen. The pseudo-Voigt function convoluted with an asymmetric function of Finger, Cox, and Jephcoat was used to adjust the profile (Larson & Von Dreele, Reference Larson and Von Dreele2004), based on Stephens' phenomenological model, which considers anisotropic line broadening from microstrains (Paiva-Santos, Reference Paiva-Santos2001). The Crystallographic Information File (CIF), corresponding to the identified phases, was used to refine the sample. Due to the instrumental contribution, broadening corrections were made by refining a pattern of lanthanum hexaboride (LaB_6) obtained under the same sample conditions.
The broadening of the peaks was analyzed by the single-line method to calculate the crystallite size and lattice microtension (Ferreira et al., Reference Ferreira, Rovani, de Lima and Pereira2015; Michielon De Souza et al., Reference Michielon de Souza, Ordozgoith da Frota, Trichês, Ghosh, Chaudhuri, dos Santos, Gusmao, de Figueiredo Pereira, Couto Siqueira, Daum Machado and Cardoso de Lima2016; Yadav et al., Reference Yadav, Mukhopadhyay, Tiwari and Srivastava2005). The average size of the crystallites was calculated using the Scherrer formula (Muniz et al., Reference Muniz, Miranda, Morilla dos Santos and Sasaki2016), as follows:

and the microtension was estimated by the Stokes and Wilson (Reference Stokes and Wilson1944) equation as follows:
In these Eqs. (2 and 3), λ is the wavelength used in diffraction measurements, and θ is the Bragg angle, while ß_L and ß_G are the Lorentzian and Gaussian contributions, respectively. Through the pseudo-Voigt function they can be calculated using the maximum width up to half-height (Γ), and the mixture coefficient parameter (η) can be obtained directly from the analysis using the Rietveld method (Michielon De Souza et al., Reference Michielon de Souza, Ordozgoith da Frota, Trichês, Ghosh, Chaudhuri, dos Santos, Gusmao, de Figueiredo Pereira, Couto Siqueira, Daum Machado and Cardoso de Lima2016), as follows:


All samples were submitted to a conventional X-ray diffractometer with a copper source (Cu), and the results were tabulated and transformed into a ‘.txt’ format for analysis. Origin™ software was used along with the crystallinity analysis taken from XRD patterns. Three points were considered: baseline, number of peaks, and integration interval. The Adjacent-Averaging method performs normalization and smoothing of the data, considering five points. Data were scored from 0 to 100% to improve visualization and accuracy. The baseline was the parameter for all calculations; thus, it was modeled to fit the peaks and obtain the areas of the crystalline peaks. The ‘peak analysis’ feature was used, and each peak was labeled. Then, the integration region was defined based on where each peak began and ended. Crystallinity was obtained by the percentage ratio between the area of crystalline peaks and the total area.
The presence of minerals was identified by visualizing the highest-intensity peaks with a mineral file obtained from the American Mineralogist Crystal Structure Database (http://rruff.geo.arizona.edu/AMS/amcsd.php). The main procedures were based on ASTM C1365 (2006) protocols.
Fourier-Transform Infrared Spectroscopy Analysis
Samples of 10–20 mg were characterized using an FTIR spectrophotometer (IRAffinity-1S, Shimadzu, Tokyo, Japan) according to ASTM E1252-98 (2021). The analysis was performed on the attenuated total reflectance (ATR) module (%T as a function of the wavenumber in cm–1). The spectra were obtained in the MIR region from 4000 to 500 cm–1 and from 1550 to 1850 cm–1.
Thermal Analysis
The TGA/DTA/DSC analysis was performed using a Mettler Toledo device (Columbus, Ohio, USA) from 30 to 1200°C with an increment of 10°C/min. N2 at a flow rate of 50 mL/min was used according to ASTM E1131 (2020).
Scanning Electron Microscopy Analysis
Samples were prepared using a solution consisting of 10 mL of ethyl alcohol and 100 mg of material to be analyzed mixed in a 10 mL beaker. The solution was stirred until the clay was dispersed completely, and a homogeneous solution was formed. Subsequently, the solution was applied to the sample holders (stubs) using a graduated pipette. Samples were dried at room temperature. The sample was then sputter coated with Au alloy using a DII-29010SCTR (Jeol, Tokyo, Japan) instrument for 4 min. The microstructural analysis was conducted using a JSM-IT500HR microscope (Jeol), according to ASTM E986 (2004).
Particle-Size Distribution
After manual homogenization, the sample was mixed in 20 mL of distilled water (samples B, C, D, F). One drop was placed on the slide using a pipette and spread with a glass slide. Three drops of Tween 80 were used for complete dispersion for samples A, E, and H.
Optical microscopy analysis was performed to obtain two-field images of the sample at magnifications of 50, 100, 200, and 500 × using dark field incident light mode. Samples dispersed in water were characterized at magnifications of 50, 100, and 200 × . A laser diffraction particle-size analyzer (MAZ3000, Malvern Panalytical, Malvern, UK) was used with distilled water to disperse the particles, considering a refractive index of 1.56, absorption of 0.1, stirring and pumping at 1750 rpm. Samples C and D were kept for 3 and 1 min, respectively, in ultrasound (100%) before testing.
Mie's mathematical model was used, considering that the particles were not opaque and had a spherical shape. This model finds the diffraction and diffusion of light in the particle and the medium. The analysis was performed following ASTM D4464 (2015).
Microbiological Analysis
The microorganisms were detected by placing the samples in an autoclave for 3 h at a pressure of 120 kPa. Then, the samples were sent to a continuous air circulation oven for 24 h at 105°C. Subsequently, the sample containers were placed in an autoclave at a pressure of 150 kPa for 15 min. Then they were dried for 30 min using an ultraviolet chamber. The samples were packed into appropriate containers and placed in a desiccator. These procedures followed Brazilian Resolutions 481/99 (BRAZIL, 1999) and (PHARMACOPEIA, 2008) and Favero et al. (Reference Favero, dos Santos, Weiss-Angeli, Gomes, Veras, Dani, Mexias and Bergmann2019).
Results
Sieve Analysis
The sieve distribution of clays collected in Amazonas is shown in Table 1. Kaolin, AN-Am, APN-1, and APN-2 have mass fractions of < 20% above the 200-mesh sieve (0.075 mm). The mass fraction that passed through the 0.420 mm sieve ranged from 68 to 97%, which shows that the material collected from this region is composed of fine particles.
Table 1 Particle-size distribution
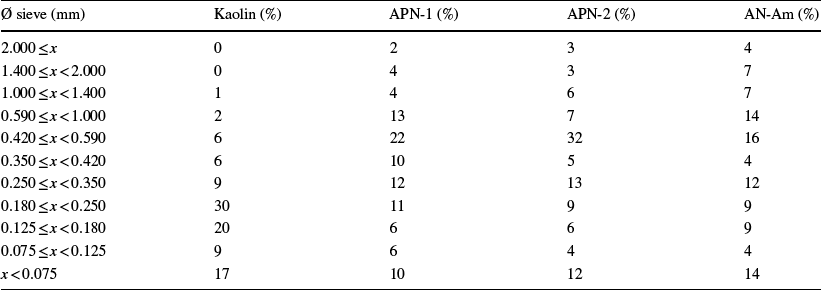
Commercial products are generally composed of a fine-grained powder (no more than 0.5% of particles were > 75 μm) and aggregates ranging from 50 to 300 μm; however, fine particles should be < 2 μm (López-Galindo et al., Reference López-Galindo, Viseras and Cerezo2007).
Moisture Analysis
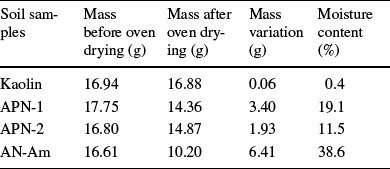
The moisture percentages in kaolin, APN-1, APN-2, and AN-Am clays are listed in Table 2. The moisture content of kaolin is substantially less (0.40%) than the others, possibly because its source is relatively well protected from the natural moisture of the soils. The AN-Am sample, collected in Itacoatiara city, has the greatest moisture content (38.6%), followed by APN-1 and APN-2, collected near the Negro River in Manaus.
Table 2 Moisture content in the investigated clays
X-ray Fluorescence Analysis
The data obtained using the X-ray fluorescence by wave dispersion (WD-XRF) technique are shown in Table 3. Seventeen (17) different elements were observed, with emphasis on Al, Si, Cl, K, Ca, Ti, Cr, Fe, Zn, P, and S. The compositional, technical, and safety specifications of clays for use as pharmaceutical and cosmetic products show that the permissible limits for elements traditionally considered toxic (As, Sb, Cd, Co, Cu, Pb, Ni, Zn, Hg, Se, Te, TL, Ba, etc.), and other less dangerous elements (Li, Rb, Sr, Cr, Mo, V, Zr), must be strictly controlled, as reported by López-Galindo et al. (Reference López-Galindo, Viseras and Cerezo2007). All clays are within the permitted limits, except for Cr, for which the recommended limit of 50 ppm is met by the kaolin sample only.
Table 3 X-ray fluorescence analysis
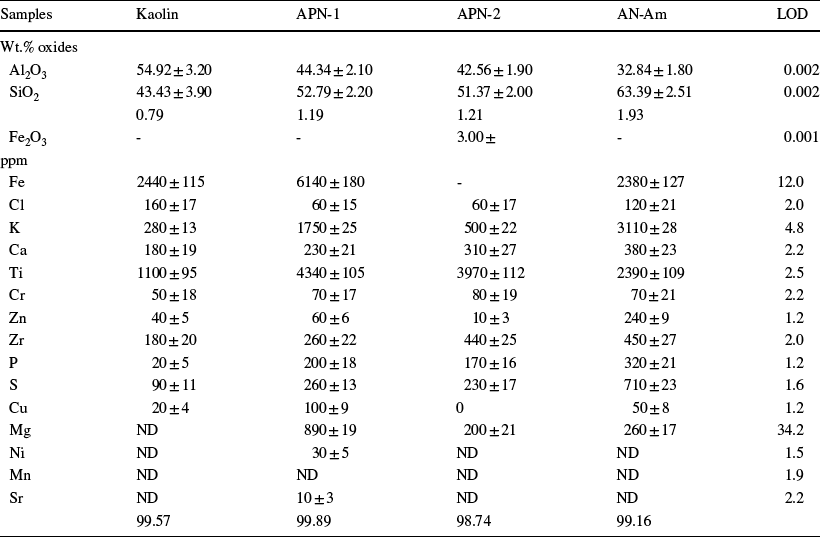
ND = Not detected, average ± std, in triplicate
The results were recalculated with respect to the loss on ignition (LOI) at 1000°C
Elements present at lower concentrations, such as Cu, Mg, Ni, Mn, and Sr, were observed in a few samples. Kaolin contains no Mg, Ni, Mn, or Sr. The AN-Am sample contains no Ni, Mn, or Sr, and APN-2 contains no Cu, Ni, Mn, or Sr. APN-1 does not contain Mn. This implies that these clays must possess unique properties that would be suitable for various cosmetics applications.
The presence of Al or Si was expected as all phases observed by XRD contain these elements. However, the Si/Al ratio for the three types of kaolinites is as follows: Kaolin < APN-1 ≈ APN-2 < AN-Am. All elements observed have already been reported, to a greater or lesser extent, as associated with the soils where the samples were obtained (Horbe et al., Reference Horbe, Horbe and Suguio2004).
X-ray Diffraction Analysis
The XRD results are shown in Fig. 2. The dominant phase in the clays belongs to the triclinic crystalline system and P1 space group (No. 1), known as the 1A kaolinite mineral. Other than for CI and kaolin samples, it was also possible to identify the existence of a special clay, which is commercially rare, known as kaolinite 2M, which has a partial dickite-type structure with monoclinic symmetry and C1c1 space group (No. 9) (Vieira Coelho et al., Reference Vieira Coelho, Santos and Santos2007). A quartz phase, belonging to the trigonal crystalline system and space group P3121 (No. 152), is present in the clays. A gibbsite phase was also identified in the APN-1 and kaolin samples. Gibbsite has a monoclinic crystalline system with a P121/n (No. 14) space group 1.
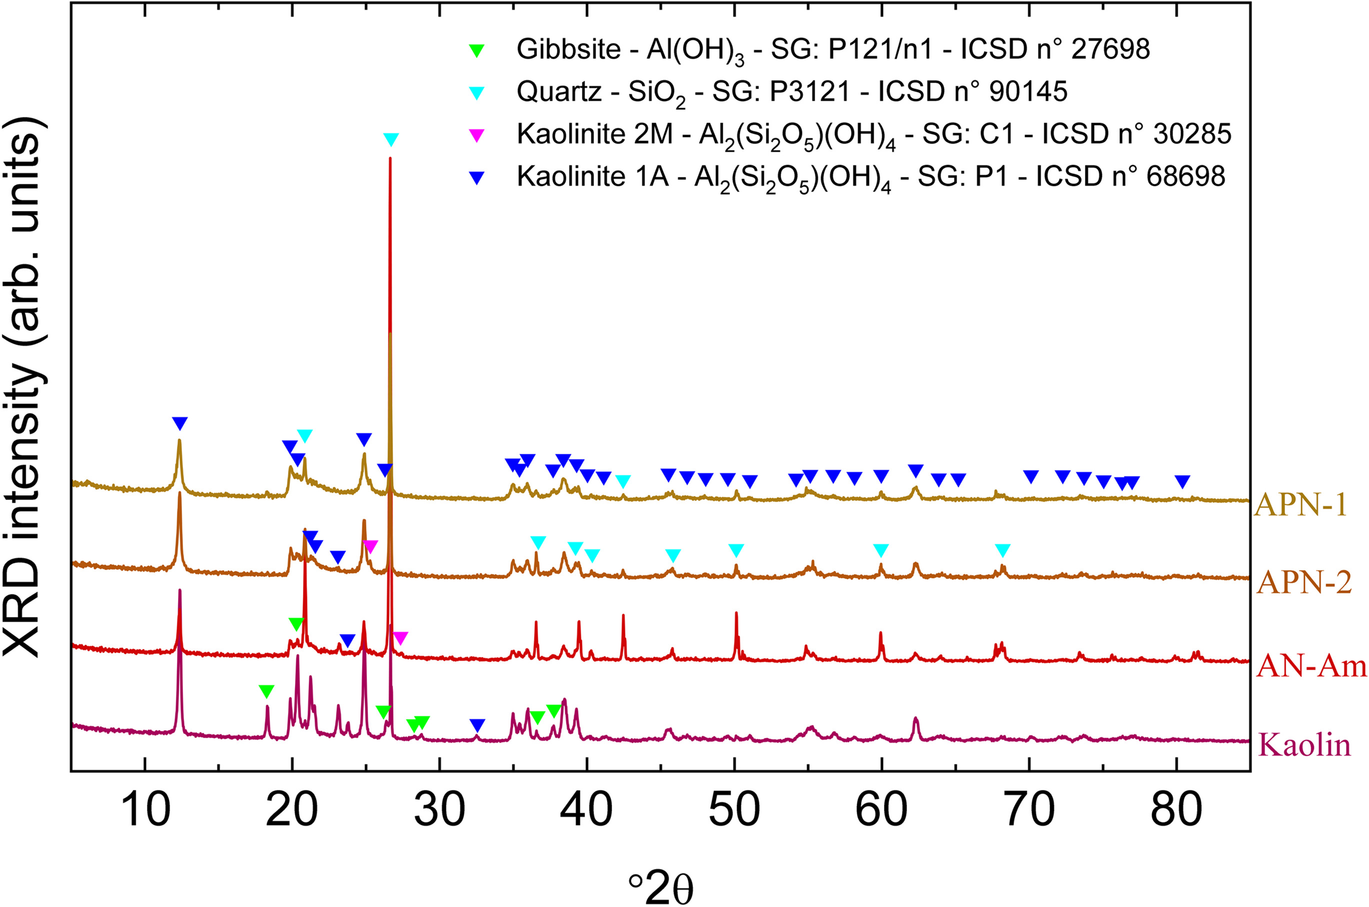
Fig. 2 Phase identification of kaolin, APN-1, APN-2, and AN-Am
All samples underwent refinement using the Rietveld method. Minimum residual and statistical parameters,
 and Rwp, show proper adjustments (Fig. 3) (Toby, Reference Toby2006). The deconvolution of the existing phases in the samples and their respective mass percentages are shown in Fig. 3. The network parameters of the unit cell of the phases were obtained after refinement and are listed in Table 4.

Fig. 3 Refinement using the Rietveld method along with statistical parameters of refinement quality (χ2 and Rwp) and phase deconvolution of samples a kaolin, b APN-1, c APN-2, and d AN-Am
Table 4 Parameters obtained after the Rietveld refinement method
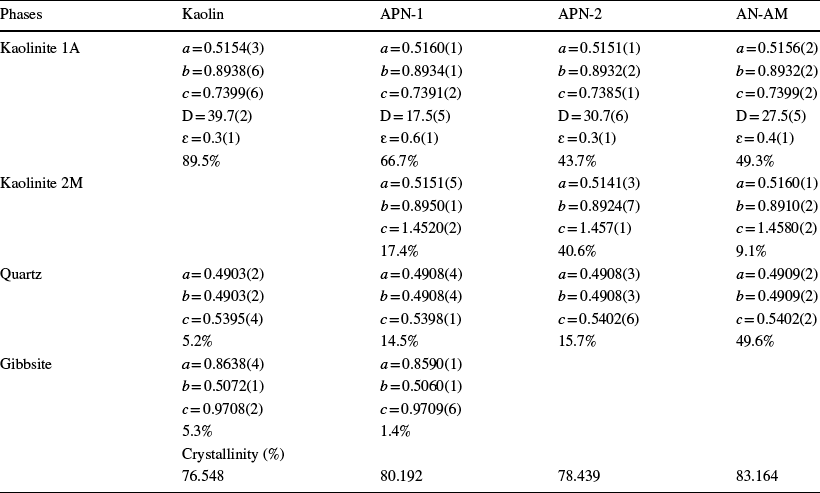
D = < D > (nm), ɛ = < ɛ > (%), and a, b, c = lattice parameters
The mean value of crystallite size and microtension was calculated for the dominant phase of the samples, i.e. kaolinite 1A (Table 4). The phase has crystallite sizes with nanometric dimensions and microtension with values between 0.3 and 1.0%. Microtension is associated directly with the density of defects in the sample (Melquiádes et al., Reference Melquíades, de Oliveira, Rebelo, Chaudhuri, Leite, Trichês and Michielon de Souza2019; Soares de Oliveira et al., Reference Soares de Oliveira, de Oliveira Melquiades, da Costa Pinto, Trichês and Michielon de Souza2020). Materials with nanometric dimensions may have differentiated properties compared to bulk materials and be of interest for possible use in various technological applications (Das et al., Reference Das, Sen and Debnath2015; Zhao et al., Reference Zhao, Cai, Tang, Tong and Liu2014). The values obtained for the crystallinity calculations of the evaluated materials are listed in Table 4. These results are similar to those of Couceiro and Santana (Reference Couceiro and Santana1999) and Silva et al. (Reference Silva, Lages and Santana2017).
X-ray diffraction shows the existence of practically homogeneous clays formed by clay minerals with low cation exchange capacity values, with results similar to those obtained by Souza and Santana (Reference Souza and Santana2014). In this way, these samples, when manipulated for the production of cosmetics and commercialization, offer a low risk of contamination (Mattioli et al., Reference Mattioli, Giardini, Roselli and Desideri2016).
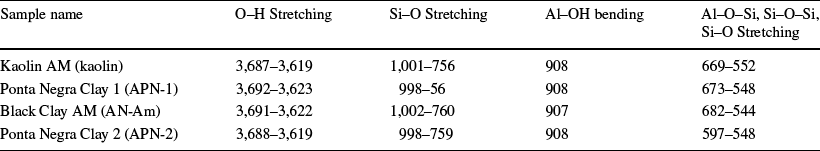
Fourier-Transform Infrared Spectroscopy Analysis
For clarity, the combined spectra for the samples are shown in Fig. 4 and Table 5. The FTIR spectra of clay mineral samples revealed kaolinites with crystalline structure defects (Silva et al., Reference Silva, Lages and Santana2017). The FTIR spectra generally show O–H stretch bands of medium to strong intensities between 3700 and 3300 cm–1. Si–O stretching bands occurred between 1095 and 1009 cm–1 in the clay minerals, and Si–O–Si bands of quartz and Al–O fold were at 1200–700 cm–1. SiO2 had a strong band at ~ 1100 cm–1, bending bands at 600–150 cm–1, and medium SiO2 bands at ~ 470 cm–1. O–H metal bands were seen in folded mode between 950 and 600 cm–1. Water absorbs below 800 cm–1, and strong infrared transitions of metal-to-metal groups occurred at 800–200 cm–1 (Ihekweme et al., Reference Ihekweme, Shondo, Orisekeh, Kalu-Uka, Nwuzor and Onwualu2020).

Fig. 4 FTIR spectra of samples kaolin, APN-1, APN-2, and AN-Am
Table 5 Frequencies and absorbance for various stretching and bending bands (cm–1)
Thermal Analysis
The results are shown for differential scanning calorimetry (DSC-Fig. 5a), thermogravimetric analysis (TGA-Fig. 5b) and differential thermal analysis (DTA-Fig. 5c) of kaolin, APN-1, PN-2) and AN-Am.
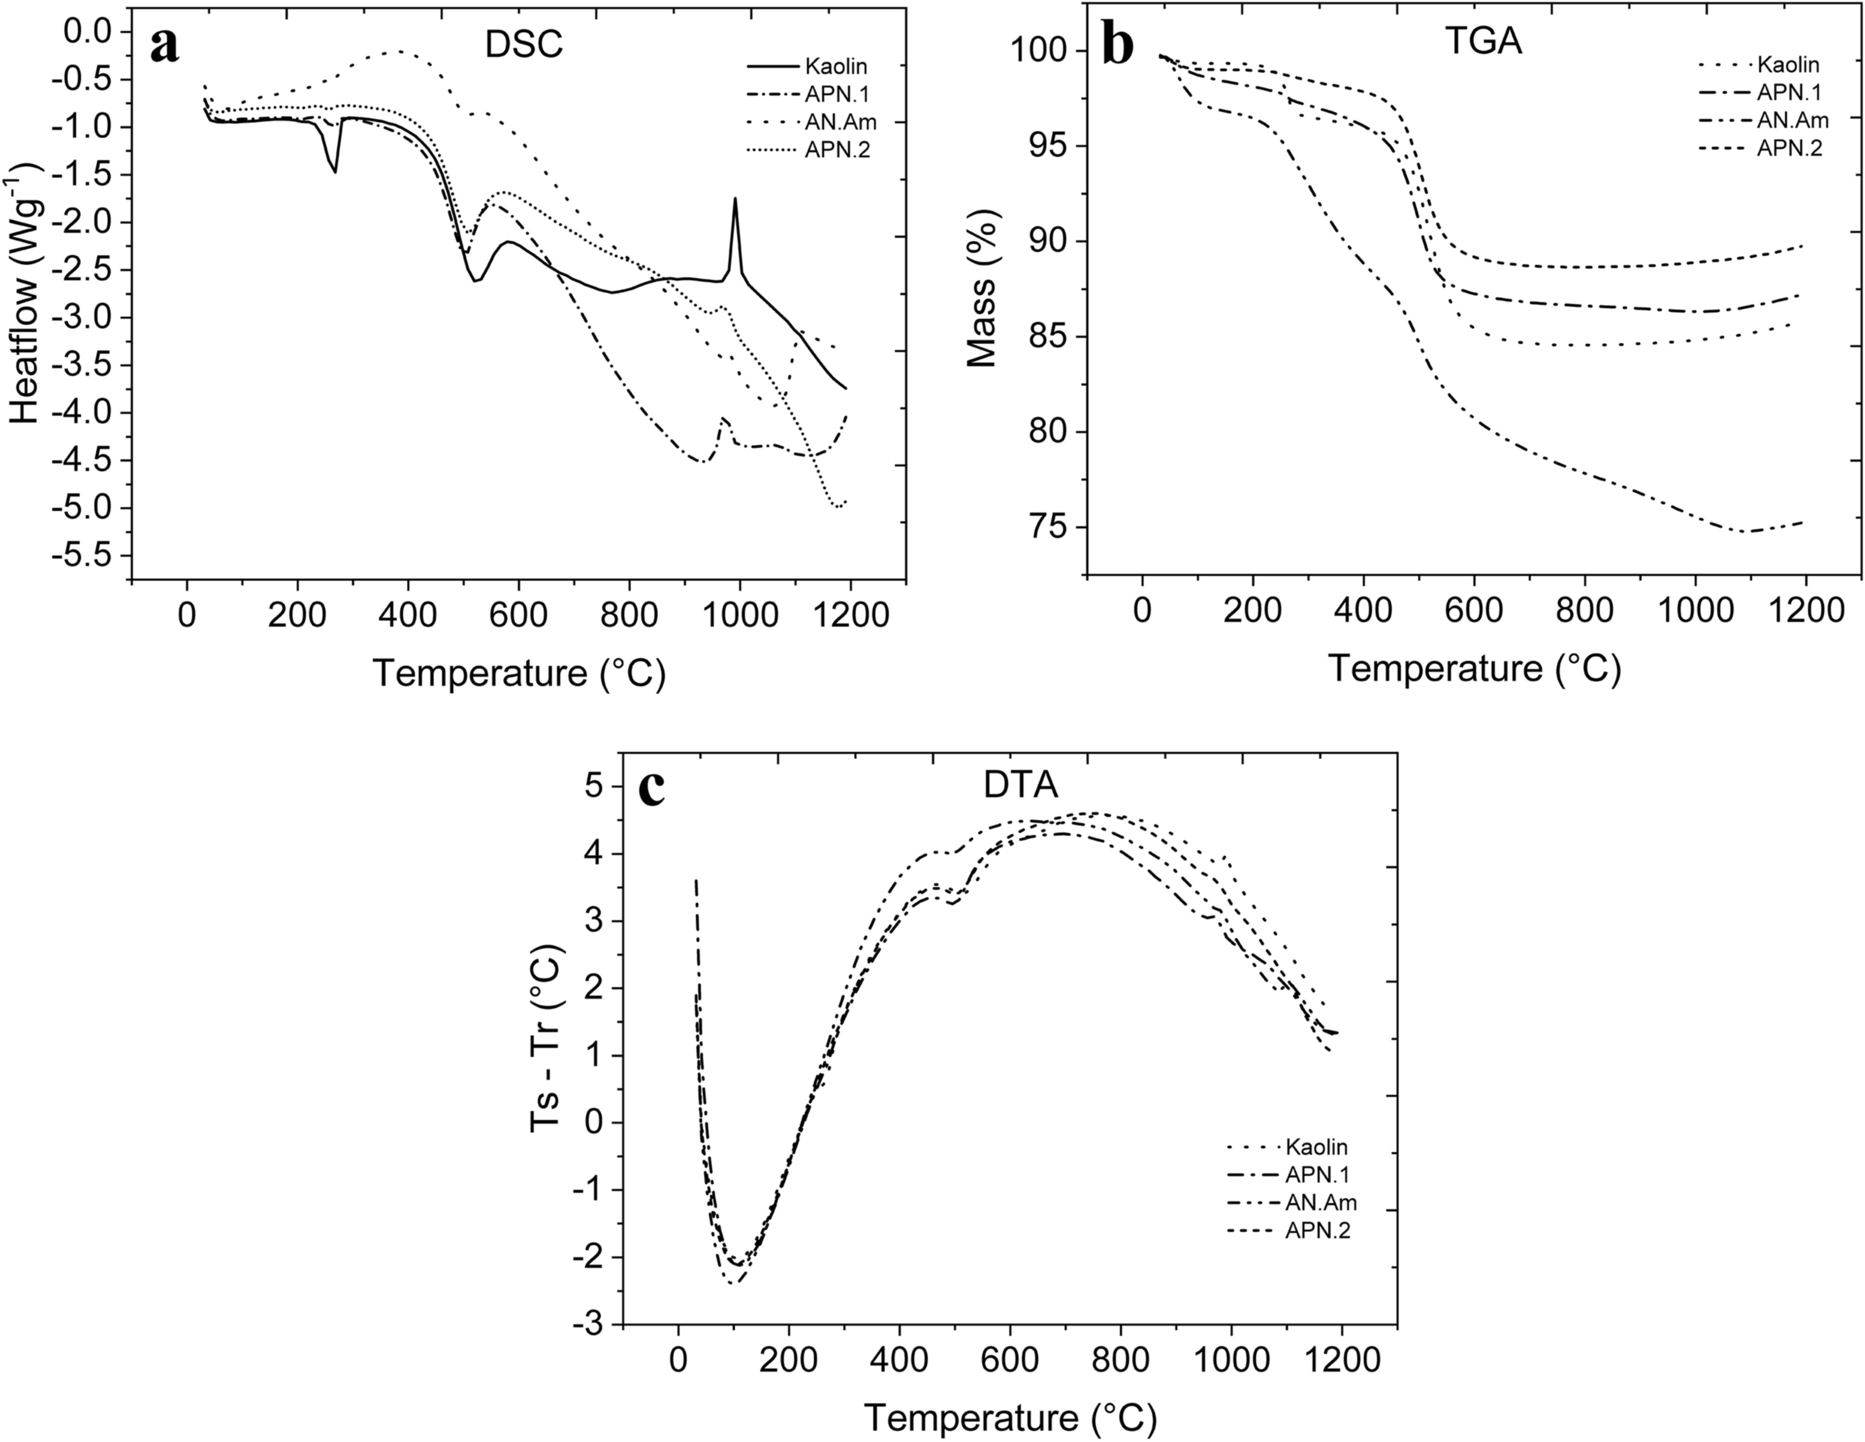
Fig. 5 a DSC, b TGA, and c DTA curves of the studied clays
The thermal behavior of the various clay samples was quite similar. The first endothermic peak occurred near 100°C (DTA curve), where free water was lost between the particles. At ~ 220°C (DSC curve), the endothermic peak occurred due to the combustion of organic matter and water loss from the hydroxides attributed to the gibbsite.
The presence of hydroxides requires additional energy for their decomposition. The highest-intensity endothermic peak occurred at ~ 500°C, due to the loss of hydroxyl in the kaolinite group. Above 500°C, the crystallinity disappeared with the water loss and metakaolinite began to form; this is amorphous and metastable. The graph does not show the vitrification phase which should start at ~ 900°C with spinel formation; neither does it show mullite nucleation, which should have begun at 970°C (Macedo et al., Reference Macedo, Menezes, Neves and Ferreira2008).
The TGA analysis showed the loss of mass with increasing temperature. Note that the most significant mass loss was due to the dehydroxylation of kaolinite at ~ 500°C, and the total value of the mass loss was ~ 14% (kaolin sample), 13% (APN-1), 10% (APN-2), and 25% (AN-Am). These values are consistent for kaolin clays and corroborate the values found in the XRF analysis (e.g. Macedo et al., Reference Macedo, Menezes, Neves and Ferreira2008).
Scanning Electron Microscopy Analysis
The microstructural analysis of kaolin (a–b), APN-1 (c–d), AN-Am (e–f), and APN-2 (g–h) (Fig. 6) revealed a hexagonal shape for kaolinite in the kaolin sample (Fig. 6a) and the presence of a nanocrystallite (Fig. 6b), similar to that reported by Lebedeva and Fogden (Reference Lebedeva and Fogden2011). The presence of pseudo-hexagonal lamellae in APN-1 (Fig. 6c–d) is a characteristic of kaolinite minerals (Otieno et al., Reference Otieno, Kengara, Kemmegne-Mbouguen, Langmi, Kowenje and Mokaya2019). Likewise, the AN-Am sample exhibited pseudo-hexagonal lamellae (Fig. 6e). The lamellae are slightly bent with a concave shape (Fig. 6f). This morphology is probably due to the loss of tension in the crystalline structure of the lamellae (Neto et al., Reference Neto, Kimura, Adeodato, Neto, Nascimento and Lona2017). The Ponta Negra (APN-2) sample also contained pseudo-hexagonal lamellae characteristic of kaolinite (Otieno et al., Reference Otieno, Kengara, Kemmegne-Mbouguen, Langmi, Kowenje and Mokaya2019).

Fig. 6 SEM images of: a-b kaolin, c-d APN-1, e-f AN-Am, and g-h APN-2 clays
The use of kaolin in semi-solid cosmetics and medicinal formulations in the form of peloids has been reported in the literature. According to Viseras et al. (Reference Viseras, Carazo, Borrego-Sánchez, García-Villén, Sánchez-Espejo, Cerezo and Aguzzi2019), this structure allows pharmacological functions, being applied in pelotherapy, wound healing, regenerative medicine, antimicrobial activity, and dermo-cosmetics. Only a few clay minerals with lamellar structures, including kaolin, can be used as excipients in formulations of various solid, liquid, or semi-solid dosages in pharmaceutical and cosmetics products (Kim et al., Reference Kim, Choi, Elzatahry, Vinu, Choy and Choy2016). Regarding textural findings, despite presenting some mineralogical differences, Amazonian clays can be recommended as raw materials for cosmetics applications.
Particle-Size Distribution
Particle-size analysis of kaolin, APN-1, AN-Am, and APN-2 samples (Fig. 7a) revealed a normal particle-size distribution generally, except for the kaolin sample. Peaks in the particle-size range of 6.4 to 100.2 μm corresponded to a volume ratio of 6.9 to 8.6. Kaolin shows a bimodal curve with a peak grain size of 5.8 μm and a volume ratio of 7.3. This peak indicates a smaller particle size compared to the monomodal samples.
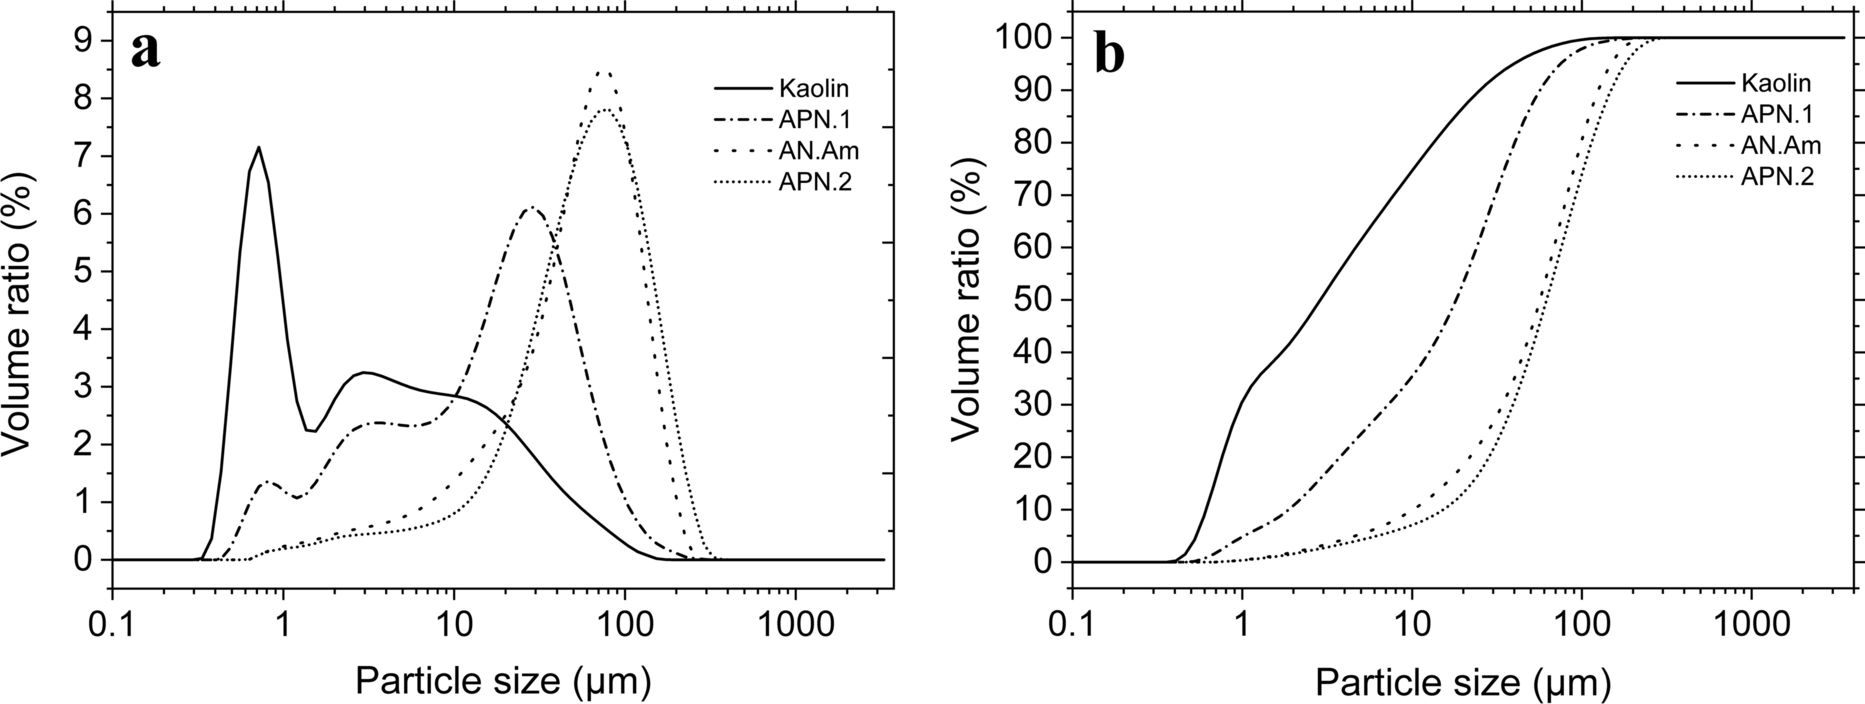
Fig. 7 a particle-size distribution, and b accumulated volume of kaolinite for APN-1, AN-Am, and APN-2 minerals
Figure 7b shows the particle size curves based on accumulated volume. These curves were obtained based on the effective diameter (d10). The diameter on the particle-size distribution curve corresponding to 10% finer is defined as the effective size. Effective diameters (d10) were: kaolin 0.61 μm, APN-1 2.27 μm, AN-Am 9.36 μm, and APN-2 10.64 μm.
Between 1.6 and 10.7%, all particles were < 2 μm, except for kaolin. From 11.6% to 42.5%, all particle sizes were between 2 and 20 μm; and from 46.8% to 86.8%, > 20 μm, which indicated that the minerals other than kaolin have a small ‘clay fraction’ (particles < 2 μm). The results suggest that kaolin can be used as an emulsifying, pelletizing, granulating, and suspending agent in pharmaceutical formulations (Awad et al., Reference Awad, López-Galindo, Setti, El-Rahmany and Iborra2017).
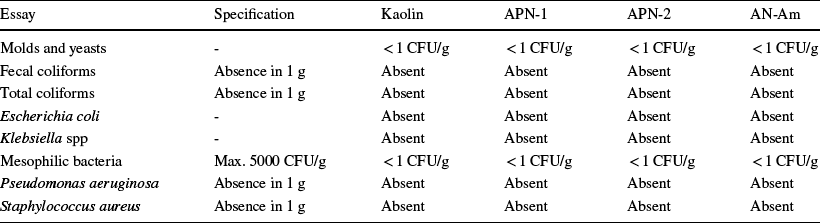
Microbiological Analyses
Tests were run for mesophilic bacteria, molds, and yeasts, fecal coliforms, total coliforms, Escherichia coli, Pseudomonas aeruginosa, and Staphylococcus aureus. Klebsiella spp is a pathogen, as it is usually involved in several infections, especially in the hospital environment. Its presence is prohibited for products that may be in contact with human skin (Favero et al., Reference Favero, dos Santos, Weiss-Angeli, Gomes, Veras, Dani, Mexias and Bergmann2019). As shown in Table 6, all samples comply with the legislation for use in products for cosmetics applications.
Table 6 Results of microbiological tests
Conclusions
The results indicated that the Amazonian clays offer promise for application in cosmetics materials, such as emulsifying, pelletizing, granulating, and suspending agents. Permissible limits for primary and toxic heavy metals were met for possible application in cosmetics, especially kaolin clay exhibiting a Cr content of < 50 ppm. The dominant phase of the clays belonged to a crystalline triclinic system and the P1 space group, known as kaolinite 1A. Other than for the kaolin samples, the existence of a special, commercially rare kaolinite, called kaolinite 2M, was also found, which is part of a dickite-type structure with a monoclinic structure within the C1c1 space group. A quartz phase, belonging to the P3121 space group, was also noted in the clays. In addition, a gibbsite phase was identified in the APN-1 and kaolin samples. Gibbsite is monoclinic in the P121/n1 space group. Based on the crystallographic information file, the clays contained adequate amounts of quartz and iron. The samples revealed a particle-size distribution with a small clay-fraction content, except for the kaolin sample. The samples showed significant plasticity, as demonstrated in the microstructural analysis, mainly for samples APN-1 and APN-2 collected at Manaus. This behavior highlights a possible application in the production of composite materials. Based on microbiological studies, the clays are promising for application in cosmetics products as they meet Brazilian regulations, i.e. Resolution 481/99.
Acknowledgements
The authors thank the Brazilian Research Agency (CNPq) for financial support.
Data Availability
All data generated or analysed during this study are included in this published article.
Declarations
Conflict of Interest
The authors declare that they have no conflict of interest.


