

In developing countries, access to reliable energy infrastructure directly constrains industrial output, often being cited by managers as the most severe limitation to business development (Zhang, Parker, and Kirkpatrick, Reference Zhang, Parker and Kirkpatrick2008, Detheir, Hirn, and Straub, Reference Dethier, Hirn and Straub2010, Allcott, Collard-Wexler, and O'Connell, Reference Allcott, Collard-Wexler and O'Connell2014). Firms may have difficulty connecting to the power grid, or when they do, face shortages or fluctuations in voltage and frequency that make accessing electricity unreliable (Alby, Dethier, and Straub, Reference Alby, Dethier and Straub2011). This unreliability has both direct and indirect effects on productivity. While lack of access to electricity and unreliable electricity directly impair the production process, even scheduled blackouts decrease productivity by forcing firms to shift investment away from activities that would otherwise be profit enhancing (Reinikka and Svensson, Reference Reinikka and Svensson2002). Thus, even with the opportunity to smooth electricity supply through self-generation, productivity suffers. This is a serious concern of both firm owners and policymakers in developing countries, as electricity is a crucial input to manufacturing productivity, which directly impacts overall economic growth.
The provision of electricity is a particular challenge for the countries of Southeast Asia. Recent growth in the region has created an extraordinary demand for energy (Roberts, Cull, and Day, Reference Roberts, Cull and Day2003, Jaffe, Reference Jaffe2004), yet there remain geographic and political constraints to efficient energy supply (Sovacool, Reference Sovacool2009). Indonesia in particular is faced with a “power paradox” – abundant stores of natural resources suitable as electricity-generating supply, yet a relatively low electricity-generating capacityFootnote 1 (Association of Southeast Asian Nations (ASEAN), 2012). Thus there exists a paradox, inasmuch as Indonesia has the natural resources to generate electricity, without the ability to produce and distribute it. Coupled with long a history of underinvestment in electricity infrastructure by the government, the energy supply in Indonesia is costly and unreliable, even relative to neighboring countries (Tharakan, Reference Tharakan2015).
Even though electricity reliability is a central concern in developing countries such as Indonesia, the vast majority of studies examining determinants of manufacturing firm productivity in the developing context explores the effects of exporting (Van Biesebroeck, Reference Van Biesebroeck2005, De Loecker, Reference De Loecker2007, Wagner, Reference Wagner2007), and spillovers (Kokko, Ruben, and Zejan, Reference Kokko, Ruben and Zejan1996, Javorcik, Reference Javorcik2004, Bwalya, Reference Bwalya2006, Baltabaev, Reference Baltabaev2014, Merlevede, Schoors, and Spatareanu, Reference Merlevede, Schoors and Spatareanu2014), or focus on country-level energy consumption and growth (Narayan and Smyth, Reference Narayan and Smyth2008, Ozturk, Reference Ozturk2010, Ozturk, Aslan, and Kalyoncu, Reference Ozturk, Aslan and Kalyoncu2010, Payne, Reference Payne2010). This paper is closest in spirit, therefore, to the handful of studies examining the impact of electrification in developing countries using more detailed measures. Past work, for instance, looks at grid-level (Alby, Dethier, and Straub, Reference Alby, Dethier and Straub2011, Dinkelman, Reference Dinkelman2011, Lipscomb, Mobarak, and Barham, Reference Lipscomb, Mobarak and Barham2013), state/province level (Fisher-Vanden, Mansur, and Wang, Reference Fisher-Vanden, Mansur and Wang2012, Rud, Reference Rud2012) or household-level measures of electrification (Grogan and Sadanand, Reference Grogan and Sadanand2013, Van de Walle, et al., Reference Van de Walle, Ravallion, Mendiratta and Koolwal2013).
It is important to use firm-level measures, however, as the other measures cannot capture the ability of firms to self-generate. Including self-generation is important, given that self-generation represents a significant portion of total electricity consumption in most developing economies (Alby, Dethier, and Straub, Reference Alby, Dethier and Straub2011).
Second, while unreliability is important to study, it is difficult to measure. Prior work often relies on surveys asking managers how their firms suffer from lack of access to electricity (Anas, Lee, and Murray, Reference Anas, Lee and Murray1996). Without direct measures of electricity demanded versus grid supply, or the quality of electricity provided versus desired, unreliability must otherwise be operationalized in other ways.
Finally, another issue is empirically separating the supply and demand for electricity. Measures of electrification may reflect both a change to the demand as well as a change to the supply of electricity, as firms demand more electricity as they grow, and the supply of electricity increases as countries build their infrastructure. Thus, analyses attempting to measure how the availability of electricity affects firms must be careful in deciphering whether measures of electricity represent changes in supply or demand.
This paper examines the impact of electrification and unreliability on productivity for the population of manufacturing firms in Indonesia from 1985–2010. Capitalizing on the features of the Indonesian context, I use a firm-level measure of electrification and unreliability. In Indonesia, publicly provided electricity is far less expensive than self-generated electricity (Kristov, Reference Kristov1995, Rachmatullah, Lu Aye, and Fuller, Reference Rachmatullah, Lu and Fuller2007). Assuming that firms with a larger proportion of self-generated electricity must experience greater electricity unreliability, firms' electricity access is deemed unreliable if a firm self-generates more than fifteen percent of the electricity they consume. This cut-off is based on existing evidence from other countries on the average proportion of self-generation for firms facing unreliable electricity (discussed in depth in Footnote 3).
Further, to disentangle the supply-and-demand effects of electrification, a unique instrument for electrification – district-level solar irradiance – is used as a proxy for demand-side factors. This is similar in spirit to Dinkelman (Reference Dinkelman2011), who used a geographic variable as an instrument for time-varying electrification projects. Solar irradiance is a measure of how much solar power a given geographic location receives, and it is the primary source of radiant energy to the earth (NASA, 2008). Specifically, solar irradiance is a measure of the solar power emitted by the sun hitting a horizontal surface on the earth at a given location at a given time (Lean, Beer, and Bradley, Reference Lean, Beer and Bradley1995). The idea here is that geographic areas with lower levels of solar irradiance have less natural provision of light and electricity and therefore have a greater demand for electricity. This serves as an exogenous shift in electricity demand, allowing remaining results to reflect the impact of changes in supply only.
The results of fixed effects and instrumental variables analyses reflect the adoption cost of technology for firms (Arrow, Reference Arrow1962, Hall and Khan, Reference Hall and Khan2003), as employees learn new skills, new forms of organizational structure are implemented, and new investments are made into new complementary assets (Rosenberg, Reference Rosenberg1972, Helpman and Trajtenberg, Reference Helpman and Trajtenberg1994, Helpman, Reference Helpman1998, Bessen, Reference Bessen2002). Thus, similar to previous work examining the impact of general purpose technology, results show that initial electrification leads to a fall in productivity, with this reductive effect decreasing over time (Jovanovic and Rousseau, Reference Jovanovic and Rousseau2005).
In terms of unreliability, results show that firms are unable to compensate for the productivity-reducing effects of electricity unreliability. Controlling for a myriad of fixed effects at the firm, industry, and province level, electricity unreliability negatively affects productivity, both initially and over time. Further, results indicate that smaller firms are more susceptible to the productivity-reducing effects of electricity unreliability relative to their larger counterparts. This is important to understand, as small and medium size enterprises represent an integral part of developing economy growth (Dethier and Straub Reference Dethier, Hirn and Straub2010).
This paper makes several contributions. First, it provides some of the first evidence of the long-term effects of electricity unreliability on firm productivity. While conventional wisdom may suggest that unreliability will negatively affect productivity and moreso for smaller firms, the results here are supported by two rigorous empirical approaches. Further, results show that given the cost of self-generation can be forty times that of government-supplied electricity (ASEAN 2012), the value of reliable electricity for firms exceeds the cost of government-supplied electricity by approximately this magnitude.
Furthermore, the results provide insight into the importance of complementary assets in the adoption of electricity use. While the integration of a general-purpose technology such as electricity may seem unambiguously beneficial for firms in theory, results here indicate that managers would be well advised to be aware that initial adoption costs may be productivity-reducing. In light of this, preparation for the integration of general-purpose technology by investing in complementary fixed and intangible assets, such as machinery and training for employees, should help smooth the negative effects to productivity of technology adoption. However, this reductive effect decreases over time, such that the cumulative effect of electrification on productivity is positive. From the policy perspective, if productivity enhancement is the goal, this paper suggests that governments should not only offer public goods such as general-purpose technologies to firms, but also help firms set up the internal infrastructure needed to adopt technology. Thus, governments should view lack of access to electricity as a constraint to firm productivity, and also the absence of internal adoption capacity, at least in the short run.
This paper proceeds as follows. Section II discusses the institutional background of electricity provision in Indonesia. Section III, IV and V describe the industrial data, the empirical approach used to analyse the data and results of the empirics, respectively. Section VI concludes.
Institutional Environment
Electricity provision in Indonesia began with the Dutch, as the first electricity generators were built in the 19th century to accommodate tea and sugar factories (Kristov, Reference Kristov1995). Shortly thereafter, the Dutch began to provide electricity to the public as well. After Indonesia proclaimed its independence from the Dutch in 1945, the newly independent government established a state-owned electricity company, PT Perusahaan Listrik Negara (PLN), to help provide electricity to the public. From its inception, PLN enjoyed a monopoly in electricity generation, transmission and distribution and retail sales of electricity, generated mostly from oil and coal natural resources. While firms could generate their electricity for their own use, PLN remained the primary electricity provider until the mid 1980s (Kristov, Reference Kristov1995, Pintz and Korn, Reference Pintz and Korn2005).
During the mid 1980s, however, PLN planned to expand electricity provision through new legislation allowing greater private provision, as well as by making significant new investments in their own provision. The Electricity Law of 1985, for instance, permitted Independent Power Producers (IPPs) to enter the market by selling electricity directly to PLN (Kristov, Reference Kristov1995). All of these plans were brought to a halt by the Asian financial crisis of 1997, during which PLN's vast quantity of dollar-denominated debt became unserviceable due to the dramatic currency depreciation of the Indonesian rupiah. Thus PLN transitioned from a marginally profitable company into one with critical financial problems, severely limiting its ability to implement these expansion plans (Pintz and Korn, Reference Pintz and Korn2005, Rachmatullah, Lu Aye, and Fuller, Reference Rachmatullah, Lu and Fuller2007).
In the post-crisis years, there were additional attempts to revitalize electricity investment. For instance, the government planned a restructuring of the electricity sector aimed at separating the commercial, social, and regulatory functions of PLN post-crisis to increase efficiency (Pintz and Korn, Reference Pintz and Korn2005). Further, the government passed the Electricity Law No. 20 in 2002 to facilitate the liberalization and privatization of the sector. These plans were also thwarted, however, in 2004 when the Constitutional Court ruled to return the electricity sector to government ownership. As a result, despite the intention by the government to address the energy investment problems, from 1997–2004 there was little change in investment in new power projects in Indonesia, and progress towards liberalization was essentially reversed (Pintz and Korn, Reference Pintz and Korn2005).
Since then, the Indonesian government has implemented many new policies and programs to attract private investment into the electricity sector (ASEAN 2012). These include new public-private partnerships, strengthening of the regulatory framework, and federal-level support for a greater role of regional governments in electricity regulation. And yet, while electricity provision has steadily improved in Indonesia in the past decade, there still exist provinces where on average. fewer than half of households had access to electricity as of 2011 (see Table 1). For instance, in both Papua Barat and East Nusa Tengarra, the percentage of households with access to electricity in the household is below fifty percent. Furthermore, from an absolute perspective, while average electrification in Indonesia is approximately 80%, this still implies that approximately 50 million Indonesians had no access to electricity in 2014. Furthermore, though electricity provision has improved, generation capacity (the ability to produce electricity from resources) consistently lags behind electricity demand (ASEAN, 2012). As a result, power shortages remain common even in areas where the electricity grid is relatively well developed (e.g., Java, Bali). This leads to frequent interruptions in PLN service and/or fluctuations in voltage (Rachmatullah, Lu Aye, and Fuller, Reference Rachmatullah, Lu and Fuller2007).
Table 1. Province-level Electrification Ratios (% of households with electricity) in Indonesia 2011
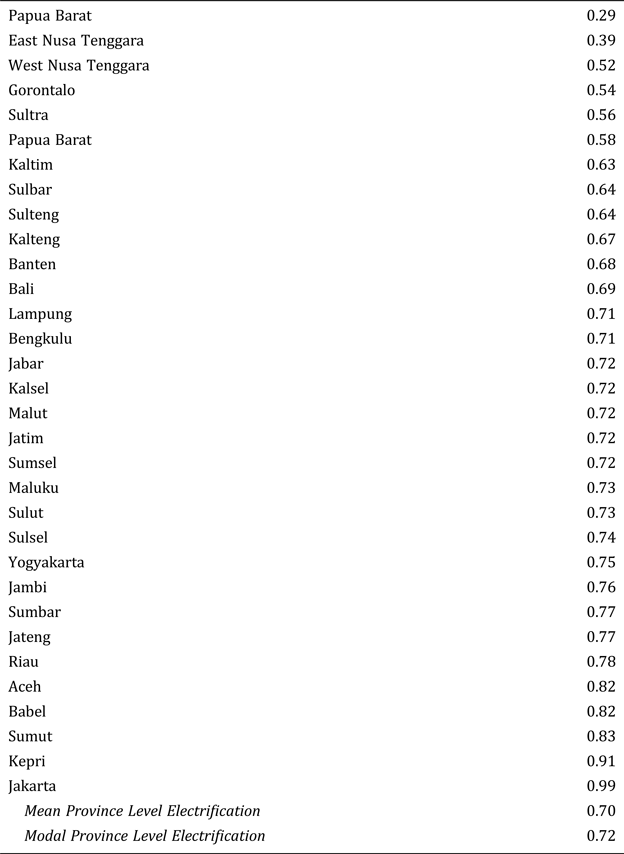
This table shows the proportion of households with access to electricity in the household for each Indonesian province as of 2011. Source: PT Perusahaan Listrik Negara (PLN) Plans for Renewable Energy Development, The 2nd Clean Power Asia Conference and Expo 2012.
As a response to unreliability, industrial self-generation and use (also called captive power) is widely found and accounts for at least one third of total generation capacity in Indonesia (Pintz and Korn, Reference Pintz and Korn2005). The magnitude of captive capacity (the power supply generated by a firm for its own use (Kristov, Reference Kristov1995)) in Indonesia has several undesirable economic consequences for firms. First, as mentioned earlier, it means that industrial firms are diverting a large portion of investment funds away from productive investment to install power (Anas, Lee, and Murray, Reference Anas, Lee and Murray1996). Second, captive power increases reliance on the foreign supply of energy resources, as the majority of captive power requires diesel fuel, and Indonesia's diesel-refining capacity is constrained (ASEAN, 2012). Thus, Indonesia's electricity problems make the economy more dependent on foreign imports, when Indonesia could be self-sufficient if provision by PLN became more widespread and reliable. Altogether, at firm level and from a social perspective, the electricity shortage and unreliability create a significant economic loss.
Data
The empirical analysis is based on data from the Republic of Indonesia's Badan Pusat Statistik (BPS), the Central Bureau of Statistics. The principal dataset is the Survei Tahunan Perushahaan Industri Pengolahan (SI), the annual manufacturing survey. The analysis here comprises the entire population of Indonesian manufacturers from 1985–2010 with 20 or more employees. Depending on the year, the SI includes as many as 160 variables, including industrial classification (5-digit ISIC code), ownership information, investment information, and input information for approximately 20,000 factories annually. This data has the structure of an unbalanced panel and the information provided tracks plants over time, including both entering and exiting plants.Footnote 2
Measures of Firm-Level Electrification and Unreliability
Electrification is measured in two main ways. One measure examines when each manufacturing plant first acquires electricity (the intensive margin). This can be observed when the plant has reported zero electricity use in the year prior to a nonzero value in the year after electrification. Thus, electrification is measured as an indicator equal to one for the first nonzero electricity year and zero otherwise. To further capture electrification, the actual quantity of electricity (thousands kWh) consumed is used.
Perhaps more interestingly, I capitalize on the institutional features of the Indonesian context to construct a firm-level measure of electricity unreliability. This measure is based on one major assumption; firms with a higher proportion of self-generated electricity to total electricity consumption must have less-reliable electricity, as self-generation is prohibitively more expensive than PLN electricity (ASEAN 2012). Therefore, firms with a greater proportion of self-generated electricity must be forced to self-generate to support production, as this is a much more expensive input relative to PLN-provided electricity. To eliminate the possibility that the observed self-generation is for produced for sale, the analysis is limited to only those firms that do not sell electricity yet are located in districts with access to public electricity. Thus, this measure captures electricity generated only as a response to unreliable PLN provision of electricity, not lack of access or self-generation for sale. I consider firms with unreliable electricity to be those that self-generated more than 15 percent of the electricity consumed in that year.Footnote 3 Results using less-conservative measures of unreliability (using a larger percentage of self-generation) yield similar signs, yet larger magnitudes. Thus, this represents a conservative measure of unreliability.
Measure of Productivity
The variables used to estimate firm-level productivity include the following: measures of output, labor, and capital inputs (electricity and materials). The main measure for output is real value added – the value of output adjusted for the real cost of all intermediate inputs. This is calculated by deflating the total annual sales revenues of a firm with an industry-level price deflator constructed by the Bank of Indonesia. The deflator will control for changes in output prices over time resulting from inflation. Labor is measured using the wage bill, with firms distinguishing between production and nonproduction workers. Electricity and fuels are measured in the real value of their quantities consumed. All of the inputs enter the value-added production function in log levels.
Several assumptions are made regarding the data. Because the deflator controls for inflation, and those changes occur because of industry-level demand shocks, it is assumed that firms are price takers because comparable quantities across time and between firms can be used. This is a reasonable assumption; there are hundreds of firms in each industry on average, so price-taking behavior seems reasonable. I acknowledge the concern that may arise from imperfect competition if more granular definitions of industries are used. Without firm-level prices or quantities, however, this concern cannot be directly addressed. Instead, an interaction terms of an industry indicator with a year indicator is used to capture within-industry variation that changes over time, such as industry concentration and competitiveness. At the very least, this will control for the changing within-industry competitive environment.
Perhaps the most pressing issue in productivity estimation is how to deal with the presence of an anticipated unobserved productivity shock that may be correlated with the firm's choice of variable inputs. Firm-level production functions are therefore estimated using the two-step control-function approach developed in Levinsohn and Petrin (Reference Levinsohn and Petrin2003). They showed that under the assumption of monotonicity of demand function in terms of firm productivity, raw materials can serve as a proxy for the unanticipated unobserved shock. In the first step, the inverted raw materials demand function is substituted for the unobserved productivity shock in the production function, serving as a proxy. Labor is then estimated using semiparametric techniques. In the second step, survival probabilities are estimated and entered into a nonlinear least squares routine using GMM estimation, overcoming the problem of selective attrition in unbalanced panels. The inclusion of a proxy that controls for the part of the error term correlated with inputs ensures that the variation in inputs related to productivity will be removed.Footnote 4
The production function for firm i at time t is specified as:
 $${\rm y}_{{\rm it}} {\rm = \alpha + \beta} _{\rm k} {\rm k}_{{\rm it}} {\rm + \beta} _{\rm s} {\rm l}_{{\rm it}}{\!}^{\rm s} {\rm + \beta} _{\rm u} {\rm l}_{{\rm it}}{\!}^{\rm u} {\rm + \beta} _{\rm a} {\rm a}_{{\rm it}} {\rm + \varepsilon} _{{\rm it}} $$
where yit denotes value added, kit denotes capital, lit s denotes production labor quantities, lit u denotes nonproduction labor quantities, and a denotes the age of the firm.Footnote 5 All variables are expressed in logs. In the estimation, the total kilowatt hours of electricity consumed by the firm is used as the intermediate input in the control function step. In addition, value added is used as an alternate measure for firm-level productivity for robustness for each analysis.
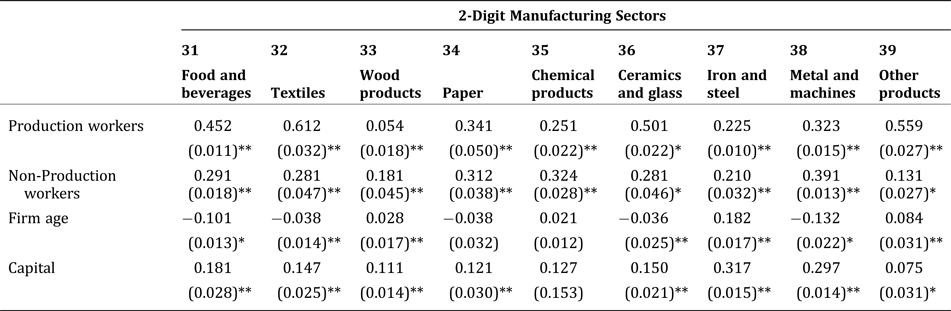
To provide evidence that this methodology is sound, Equation 1 is estimated separately for all firms belonging to each 2-digit ISIC code. Table 1 of Appendix A displays the results. All four variables are significant for nearly every industry, and the magnitudes of the coefficient estimates seem sensible. For instance, the estimates show that Metal and Machines (ISIC 38) are less labor intensive and more capital intensive than Food and Beverages (ISIC 31) and Textiles (ISIC 31), as would be expected.
Descriptive Statistics
Tables 2 and 3 present means and standard deviation of key variables used in the main analysis. All variables are measured from the population data, so results need not be weighted. Table 2 provides descriptive statistics of baseline variables for the full sample of firms. It is evident here that in terms of sector distribution, location, and ownership, there is little variation among Indonesian industrial firms. Almost half of the firms belong to two sectors (food and beverages, and textiles), approximately 80% of firms are located in Java, and few firms are either government or foreign owned. Firms in the population range widely, however, in terms of size and productivity. In terms of electrification, approximately 36% of firms acquire electricity at some point in the panel, while 53% always use electricity, and 4% did not use electricity during the period 1985–2010.
Table 2. Descriptive Statistics of Firms in Population of Indonesian Manufacturers 1985–2010

Note: Solar irradiance is measured in Kwh/m2/day and aggregated to the district level. Exporter is the percentage of firms that export a non-zero amount of their products. Foreign ownership and state ownership are the average percentage of the firm that is foreign and state owned, respectively. Acquirers are those firms that within the period 1985–2005 transition from no use of electricity, to use of electricity. Always using electricity are those firms with electricity use in each period in the sample, and never using electricity are those firms which never use electricity. For sector and geographic distribution statistics, these represent the proportion of each type of firm in each sector/province.
Table 3. Descriptive Statistics of Firms in Population of Indonesian Manufacturers 1985–2010 Based on Electrification Status
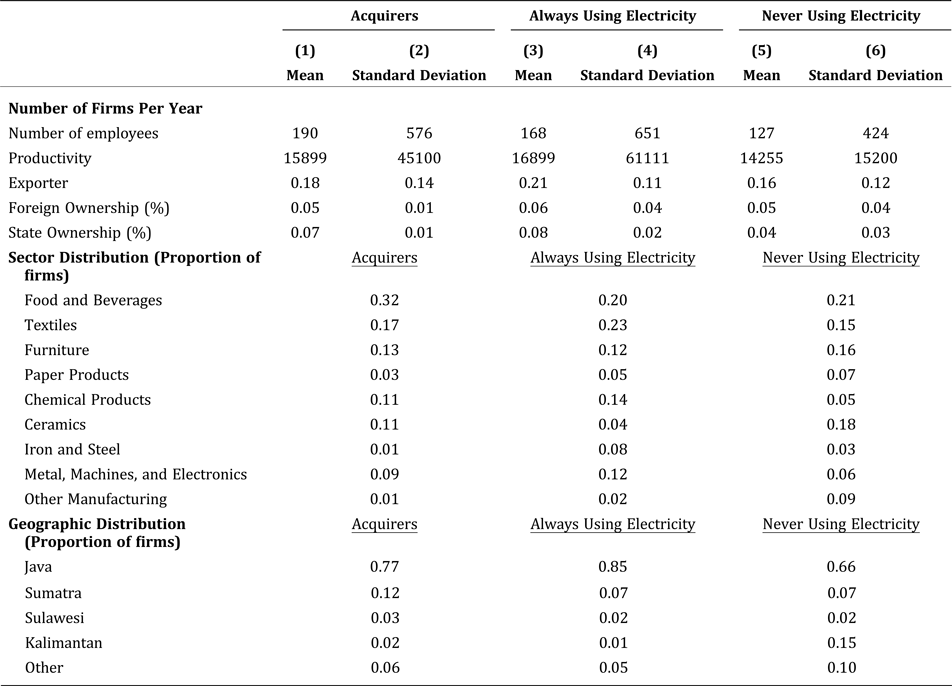
Note: Exporter is the percentage of firms that export a nonzero amount of their products. Foreign ownership and state ownership are the average percentage of the firm that is foreign and state owned, respectively. Acquirers are those firms that within the period 1985–2005 transition from no use of electricity, to use of electricity. Always using electricity are those firms with electricity use in each period in the sample, and never using electricity are those firms which never use electricity. For sector and geographic distribution statistics, these represent the proportion of each type of firm in each sector/province.
A closer look at the differences between these three delineations of electrification use among firms suggests that those firms that used no electricity over the sample period are different than the other firms in several respects. Table 3 presents the descriptive statistics of Table 2, separated by firms according to electrification status. Acquirers tended to be the largest and the most productive, while a larger portion of those that always used electricity are located in Java. The largest difference in magnitudes exists between those firms that never used electricity and those that either acquired or had electricity throughout the entire period. Column 5 of Table 3 indicates that those firms that never used electricity are smaller, less productive, and represent a smaller fraction of textile, chemical products, and metal manufacturers.
Empirical Methodology
In the baseline regression, an OLS model examines the relationship between electrification and unreliability on firm level productivity in the next year. Next, the large number of observations in the data allows me to pursue a fixed-effects approach with a myriad of interaction effects to control for omitted variables. Firm, year, industry and province fixed effects are also included, as well as a range of interacted fixed effects with year indicators to control for cross-sectional changes over time, such as changes to industry competitiveness. Interacted terms of electrification with both industry and province fixed effects are included to control for the differential impact of electrification by industry and province.
An instrumental variables approach is also implemented to proxy for an exogenous shift (to firm electricity use) in electricity demand (electrification). In particular, geographic solar irradiance on the district level is used to proxy for electricity demand. Solar irradiance is a measure of the solar power emitted by the sun hitting a horizontal surface on the earth at a given location at a given time (Lean, Beer, and Bradley, Reference Lean, Beer and Bradley1995). District-level solar irradiance data in units of average Kwh/m2/day was collected from the NASA Surface Meteorology and Solar Energy dataset (Chandler, Whitlock, and Stackhouse, Reference Chandler, Whitlock and Stackhouse2004) and matched by the author to the district level using geomapping.
Data is made measured by NASA per longitude and latitude each day, and made available at each latitude and longitude aggregated to the monthly level over a 22-year period. However, while ideally the solar irradiance at each firm would be used, because the smallest geographic unit of measurement for the manufacturing data is the district, the NASA data is then aggregated by the author to the district level by using the latitude and longitude of the two diagonal corners of each district. Further, because manufacturing data is given on the annual level, monthly data is then averaged to the annual level. Thus, the resulting measure is at the district-annual level and does not vary over time. For robustness, the median, minimum, and maximum solar irradiance values each year are also used as instruments. Parameter estimates change in magnitude as a result, but not substantially. These additional estimates can be made available by the author.
This instrument relies on the assumption that geographic areas with lower levels of solar irradiance will have a greater demand for electricity. A main concern regarding this assumption is that irradiance levels may be positively correlated with energy demand, as higher-irradiance districts have a higher demand for cooling/air conditioning. Meaning, higher-level irradiance may mean areas where demand for air conditioning is high because they are warmer. This is contrast to the main assumption for the instrumental variables approach, that higher-irradiance level areas produce lower demand for electricity.
This assumption is substantiated, however, with the stylized fact that the demand for lighting is far greater than the demand for air conditioning in developing countries (McNeil and Letschert, Reference McNeil and Letschert2008). In particular only approximately 2.7 percent of households in Indonesia in 1997 had air conditioners to begin with (Pintz and Korn, Reference Pintz and Korn2005), thus it is unlikely that demand from air conditioners could even represent a realistic response to higher levels of solar irradiance. Thus, it is unlikely that air conditioning demand would be the main driver for electrification quantities. This assumption is further validated by the first stage F-test of this instrument, suggesting that our instrument is relevant and negatively related to electrification.
Figure 1 shows the resulting solar district level solar irradiance map for Indonesia. The map illustrates that there is a great deal of cross-district variation in solar irradiance. This is beneficial for the empirical analysis as this variance will help proxy for variance in electricity demand. The instrumental variables analysis would be compromised without this variation, as variation in electricity demand is needed to estimate the relationship between electrification and productivity from a statistical standpoint. Thus, the variation suggests that the instrument may be used to proxy for energy demand.
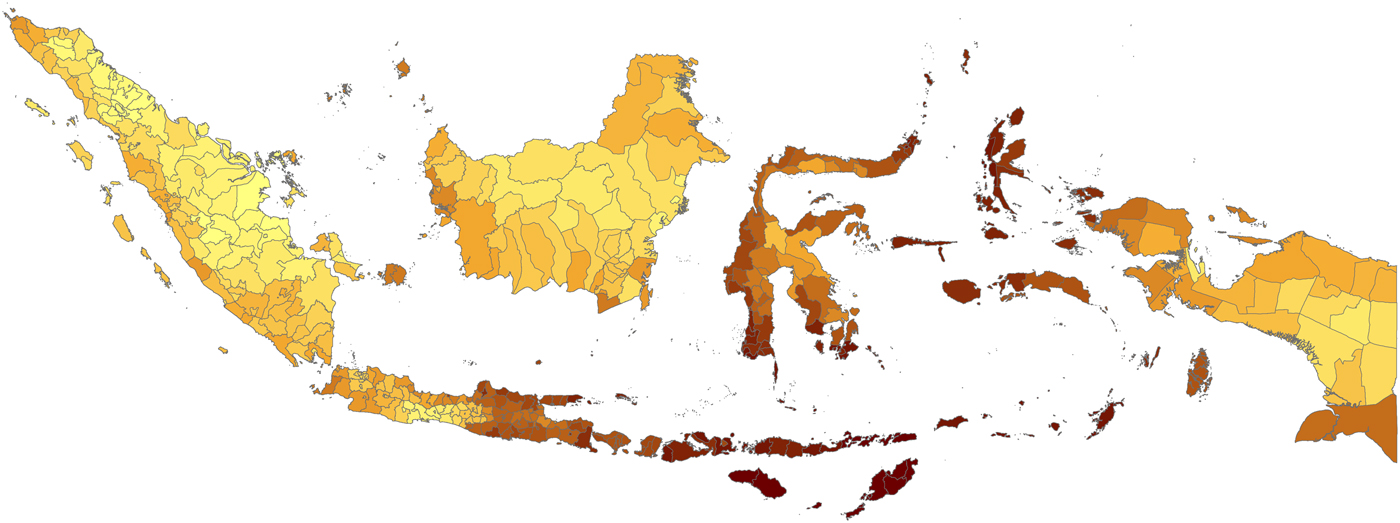
Figure 1. Indonesian District-level Solar Irradiance*
Results
The results examining the impact of electrification and electricity unreliability on productivity are provided in Tables 4–7. In Tables 4–6, columns 1 and 3 report the results using productivity as the dependent variable, while the alternating columns show results using value added as the dependent variable for robustness. Tables 4 and 5 report the influence of electrification on productivity, while Table 6 examines the effect of unreliability on electricity. Table 7 reports the results of fixed-effects analysis of unreliability on productivity, splitting the sample between small and large firms (<189 employees and greater than 189 employees – below and above the population mean, respectively).Footnote 6
Table 4. The Effect of Electrification on Productivity (Extensive Margin)
Note: ***Significant at the 1% level, **Significant at the 5 percent level, *Significant at the 10% level. Standard errors in parentheses clustered at the firm level. Total factor productivity is measured using the methodology developed by Levinsohn and Petrin. Value added is the real value of output adjusted for the real cost of all intermediate inputs. Value added and output deflated using four digit industry wholesale prices. Electrification is an indicator equal to one for years' postelectrification and zero before and instrument with district level solar irradiance. Log values of value added used to address outliers. Firm-level controls include: ln (number of employees), government investment, and foreign investment (both in 000 rupiah).
Table 5. The Effect of Electrification on Productivity (Intensive Margin)

Note: ***Significant at the 1% level, **Significant at the 5 percent level, *Significant at the 10% level. Standard errors in parentheses clustered at the firm level. Total factor productivity is measured using the methodology developed by Levinsohn and Petrin. Value added is the real value of output adjusted for the real cost of all intermediate inputs. Value added and output deflated using four-digit industry wholesale prices. Electrification is measured in 000 kwH and instrumented with district level solar irradiance. Log values of value added used to address outliers. Firm -evel controls include: ln (number of employees), percentage output exported, government investment, and foreign investment (both in 000 rupiah).
Table 6. The Effect of Electrification on Unreliability
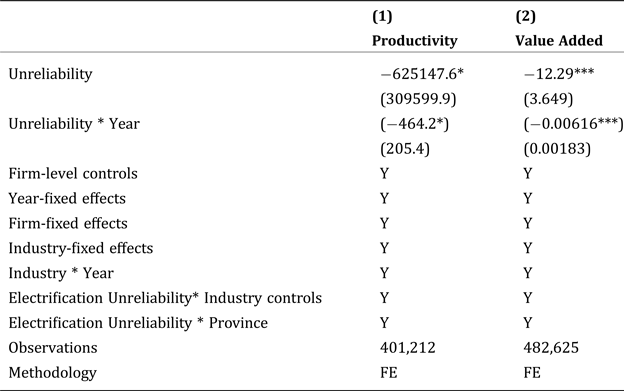
Note: ***Significant at the 1% level, **Significant at the 5% level, *Significant at the 10% level. Standard errors in parentheses clustered at the firm level. Total factor productivity is measured using the methodology developed by Levinsohn and Petrin. Value added is the real value of output adjusted for the real cost of all intermediate inputs. Value added and output deflated using four-digit industry wholesale prices. Unreliability is measured as an indicator equal to one for self-generated electricity comprising greater than 15% of total electricity consumption in that firm-year. Log values of value added used to address outliers. Firm-level controls include: ln (number of employees), percentage output exported, government investment, and foreign investment (both in 000 rupiah).
Table 7. The Effect of Unreliability on Productivity – Small and Large Firms
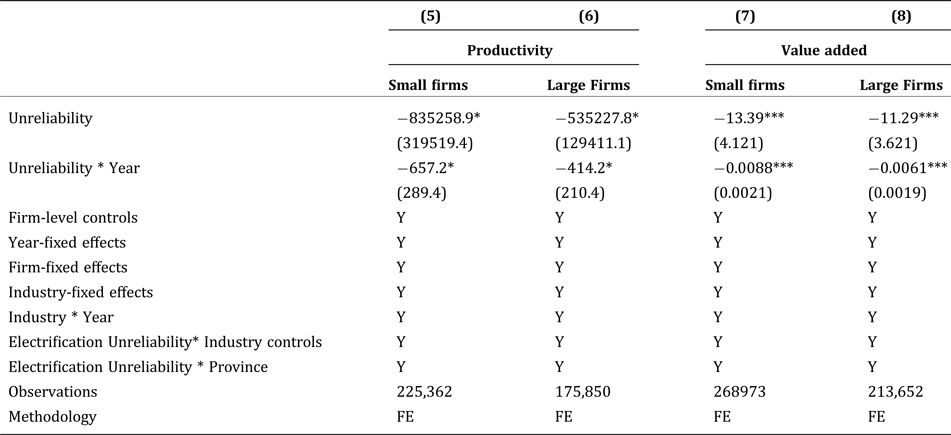
Note: ***Significant at the % level, **Significant at the 5% level, *Significant at the 10% level. Standard errors in parentheses clustered at the firm level. Total factor productivity is measured using the methodology developed by Levinsohn and Petrin. Value added is the real value of output adjusted for the real cost of all intermediate inputs. Value added and output deflated using four digit industry wholesale prices. Electrification instrumented with district level solar irradiance. Log values of value added used to address outliers. Firm-level controls include: percentage output exported, and government investment and foreign investment (both in 000 rupiah). Small firms are those with a below-average number of employees (189), while large firms have an above-average number employees.
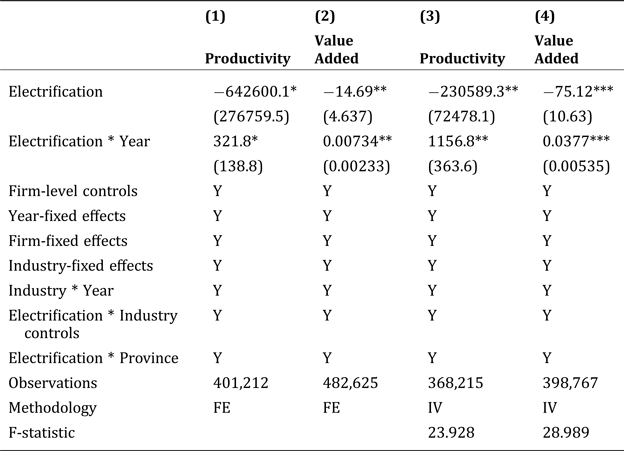
In Table 4, the independent variable of interest is electrification year, an indicator equal to one for those years after a firm begins to report nonzero electricity use. Columns 1 and 2 report the fixed-effects regression results. Here, as the initial impact of electrification on productivity is negative, the results of each empirical methodology (fixed effects, and instrumental variables regression) provide evidence that electrification comes with adoption costs to productivity. The reductive influence, however, decreases over time, as the interaction effect of electrification and the year fixed effect is positive in each specification. Columns 3 and 4 report the results instrumenting for electrification with solar irradiance. The instrumental variables results are similar in magnitude and direction to the fixed-effects results, showing a negative influence that reduces over time. Further, the F-test provides support for the relevance of the regression, as the statistic is greater than 10 (for all instrumental variables regressions). This provides support for the estimates provided by the instrument. However, given the less-than-ideal nature of the instrument measure and the general skepticism with which instruments should be viewed (Deaton Reference Deaton2009), the preferred estimate likely falls in the small range within the fixed effects and instrumented results. As the most important element here is providing primary empirical evidence on the impact of electrification on firm productivity, the magnitudes' precision are secondary. The instrument helps substantiate the relationship unearthed by the fixed-effects estimates – that electrification initially negatively affects firm productivity, and this decreases over time. Further, unreliability (as discussed in greater detail later in the paper) negatively affects firms initially and over time.
Similarly, Table 5 reports the results of the analyses examining the impact of electrification on productivity using electrification quantity rather than electrification year. Columns 1 and 2 show the results for the fixed-effect regression, while columns 3 and 4 show those for the instrumental variables regression, again instrumenting for electrification with solar irradiance. The results mirror those of Table 4; the initial impact of electrification is negative, yet decreases over time. Results are robust to the empirical methodology employed and the variety of fixed and interaction effects used, regarding omitted variables.
Table 6 presents the results of the impact of unreliability on productivity. Here, fixed-effects analysis is employed only as solar irradiance is correlated with electrification, while the relationship between solar irradiance and unreliability is unclear. Regression results show that unreliability negatively affects productivity, both immediately and over time. Columns 1 and 2 show that the direct effect of unreliability is negative, and this effect is amplified over time. This result remains robust using value added as the outcome value, as Table 6 shows.
Smaller firms may have greater exposure to the productivity-reducing effects of electricity unreliability, as they have neither the same capacity as their larger counterparts, nor the scale economies for dealing with the high initial costs of self-generation (Anas, Lee, and Murray, Reference Anas, Lee and Murray1996, Foster and Steinbuks, Reference Foster and Steinbuks2009). To more closely examine whether unreliability has a different effect on firm outcomes for smaller or larger firms, Table 7 shows the results of a split sample analysis for firms with both less than and greater than the average number of employees. Both OLS and fixed-effects regression results show that the magnitude of the impact of unreliability on productivity and value added is larger for smaller firms. That is, smaller firms are more susceptible to performance-reducing effects of electricity unreliability than larger firms.
Concluding remarks
While infrastructure plays a central role in development, prior work has not provided a substantial amount of empirical evidence quantifying the microeffects of electricity provision and unreliability on industrial firms. The challenges in this task are finding access to microlevel panel data for a large set of industrial firms, developing a reasonable firm-level measure of unreliability, and addressing the endogeneity issues that immediately arise when analysing the causal relationship of input access to firm-level performance. By using population data of the set of industrial firms in Indonesia, providing an intuitive measure of unreliability based on the institutional setting, and using district-level solar irradiance to instrument for electricity demand, this paper aims to address these concerns and provide evidence of the impact of electrification and unreliability on industrial firms.
The results of the analysis provide evidence of an adoption cost story of electrification; adopting a new technology may initially be productivity reducing, as firms must first adapt their human capital, machinery, processes and even organizational structure to accommodate the new input. However, the results also show that the reductive effect of electrification decreases over time, suggesting that eventually, electrification positively influences productivity. This is similar whether measuring electrification as a before-and-after electricity is adopted, or measuring electrification using electrification quantity. Results also provide evidence for the reductive influence of unreliability on industrial firms. Namely, firms with less reliable electricity are subject to a significant reduction in productivity and value added. This effect is also larger for smaller firms.
Additional research should examine the underlying mechanisms through which the expansion of electricity access can affect industrialization beyond productivity. Does electricity availability and reliability affect firm location or expansion choices? Furthermore, analyzing more firm-specific characteristics that may enhance electricity adoption, such as absorptive capacity, can further help provide prescriptive guidelines for policymakers regarding which firm's electricity programs should be targeted.
The results provide nuanced implications from a policy perspective. First and foremost, electricity provision is important for the productivity of industrial firms. Perhaps surprisingly, the evidence of adoption costs suggests that while electrification is important for productivity, resources directed at the adaptation of firms to the technology transition can expedite the positive impact of electricity access on productivity that policymakers hope for. Thus, policymakers should support not only programs funding electrification but also those targeting the development of complementary skills and assets prior to adoption.
Furthermore, policymakers should be concerned with both electrification and unreliability. Here, evidence is provided that firms are unable to successfully smooth electricity unreliability by showing that productivity suffers as a result of unreliability. Furthermore, this effect is more severe for smaller firms. As small- and medium-sized firms are the engine of growth in developing countries (Tybout, Reference Tybout2000, Acemoglu, Aghion, and Zilibotti, Reference Acemoglu, Aghion and Zilibotti2006), policymakers would be well advised to develop programs specifically addressing the unreliability of electricity for smaller industrial firms.
Appendix A Production Function Estimates
Appendix A. Estimates of the Production Function, by 2-digit Industrial Classification Code for Indonesian Manufacturers 1985–2010


 Open access