


Greater consumption of fruits and vegetables (F&V) and whole grains is associated with reduced risk of chronic diseases( Reference Boeing, Bechthold and Bub 1 – Reference Aune, Keum and Giovannucci 5 ). Increased intakes of different components present in these food groups, like fibre( Reference Ötles and Ozgoz 6 ), micronutrients( Reference Woodside, McCall and McGartland 7 ) and polyphenols( Reference Rodriguez-Mateos, Vauzour and Krueger 8 ), have been identified as being partly responsible for beneficial effects. However, results from the UK National Diet and Nutrition Survey (NDNS) rolling programme( 9 – Reference Bates, Lennox and Prentice 11 ) reveal that consumption of F&V and whole grains is below the recommended intake in at least 70 % of the UK adult population( 9 – Reference Mann, Pearce and McKevith 12 ). Dietary polyphenols are a diverse range of phytochemicals containing one or more aromatic rings attached to a hydroxyl group. The term ‘polyphenol’ commonly encompasses phenolic acids, flavonoids, stilbenes and lignans, which are derived from a wide range of plant foods including fruits, vegetables and cereals. However, beverages such as tea, coffee, red wine and fruit juices represent the main dietary sources( Reference Manach, Scalbert and Morand 13 ). Epidemiological studies have shown a negative relationship between consumption of polyphenols and CVD( Reference Hooper, Kroon and Rimm 14 – Reference van Dam, Naidoo and Landberg 18 ), cancer( Reference Neuhouser 19 – Reference Yuan 22 ) and type 2 diabetes( Reference van Dam, Naidoo and Landberg 18 , Reference Wedick, Pan and Cassidy 23 – Reference Jacques, Cassidy and Rogers 26 ). Multiple mechanisms have been identified that may contribute to any direct causal relationship between dietary polyphenols and prevention of chronic diseases, including modulating inflammatory pathways, exerting effects on oxidative signalling and enzyme activity and regulation of gene expression( Reference Rodriguez-Mateos, Vauzour and Krueger 8 ).
Previous reports in UK population, using either 24 h recall( Reference Zamora-Ros, Knaze and Lujan-Barroso 27 – Reference Yahya, Day and Lawton 31 ) or food diaries( Reference Zamora-Ros, Knaze and Lujan-Barroso 27 – Reference Yahya, Day and Lawton 31 ), suggest that habitual polyphenol intake is in the range of 800–1600 mg/d, depending on the population studied. However, the use of different dietary assessment methods, food polyphenol composition databases and gaps in polyphenol composition data for certain foods limit the reliability of current intake estimates in various countries.( Reference Pinto and Santos 32 ) Food diaries may provide a relatively accurate estimate of polyphenol intake and are more suitable for dietary intervention studies with smaller study population, but they reflect short-term intake rather than habitual consumption patterns, which could be particularly misleading for seasonally available foods( Reference Naska, Lagiou and Lagiou 33 ). Research groups have designed and validated FFQ to estimate dietary flavonoid intake in different populations( Reference Somerset and Papier 34 , Reference Theodoratou, Kyle and Cetnarskyj 35 ), which may provide more reliable habitual intake estimations for specific population. However, these remain unavoidably susceptible to bias due to the self-reporting errors, portion size quantification and estimation errors resulting from the lack of data on polyphenol content in food( Reference Zamora-Ros, Touillaud and Rothwell 36 ). Whichever dietary assessment method is selected, the resulting intake data will only be accurate if the polyphenol composition of food database is fit for purpose. At present, the most commonly used food polyphenol composition databases are Phenol-Explorer( Reference Neveu, Perez-Jimenez and Vos 37 – Reference Rothwell, Perez-Jimenez and Neveu 39 ), which provides information on the content of 502 polyphenols (of the four classes) in 459 food items including aglycones, glycosides and esters and the USDA databases( 40 – Reference Bhagwat, Haytowitz and Holden (Ret.) 42 ) which includes thirty-five flavonoids (aglycones only) in 506 food items, respectively. Urinary excretion of polyphenols has been shown to be a suitable biomarker for the intake of polyphenols( Reference Mennen, Sapinho and Ito 43 , Reference Perez-Jimenez, Hubert and Hooper 44 ), F&V( Reference Nielsen, Freese and Kleemola 45 , Reference Krogholm, Haraldsdo and Knuthsen 46 ), polyphenol-rich beverages( Reference Ito, Gonthier and Manach 47 , Reference Mullen, Borges and Lean 48 ) and polyphenol-rich food( Reference Mennen, Sapinho and Ito 49 , Reference Edmands, Ferrari and Rothwell 50 ). The presence of polyphenol metabolites in urine is closely related to the quantity consumed and the overall metabolism in the body. However, different polyphenols can produce common metabolites, so the biomarker selected must reflect the specific intake of the parent polyphenol in question to accurately estimate the intake of individual phenolic compounds( Reference Spencer, Abd El Mohsen and Minihane 51 ).
Dietary guidelines in the UK are population-based recommendations for maintenance of health and well-being, and to reduce risk of chronic diseases. No dietary recommendations exist for polyphenols, although the advantages and disadvantages of this approach have been debated( Reference Williamson and Holst 52 – Reference Williamson 54 ). A dietary pattern consistent with current dietary guidelines (DG) could reasonably be assumed to be richer in polyphenols than the average UK dietary pattern due to increased intake of F&V and whole grains. However, not all fruits and vegetables are polyphenol rich( Reference Perez-Jimenez, Neveu and Vos 55 ), and in fact the majority of dietary polyphenols in the UK are provided by tea, coffee and cocoa intake( Reference Zamora-Ros, Knaze and Rothwell 30 ). The aim of this study was to compare dietary polyphenol intake in a free-living study population randomised to either following UK DG or consuming a representative, more traditional UK diet. The hypothesis was that adherence to UK DG would result in an increase in total dietary polyphenol intake compared with a diet that was more representative of the UK adult population. The primary outcome variable was total polyphenol intake, adjusted for energy intake, assessed by a 4-d food diary (4-DFD). Secondary outcome variables included intake of classes, subclasses and individual phenolic acids/polyphenols. Data were also compared with FFQ( Reference Jennings, Welch and Fairweather-Tait 15 ) and biomarkers of polyphenol intake (24 h excretion of representative urinary metabolites).
Methods
Study design
The Cardiovascular risk REduction Study: Supported by an Integrated Dietary Approach (CRESSIDA) was a 12-week parallel-designed, randomised, controlled trial funded by the Food Standards Agency/Department of Health (UK) (N02047) and sponsored by King’s College London. This study was conducted according to the guidelines laid down in the Declaration of Helsinki, and all procedures involving human subjects were approved by the St Thomas’ Hospital Research Ethics Committee (10/H0802/24)( Reference Reidlinger, Darzi and Hall 56 ). Written informed consent was obtained from all subjects. This trial was registered at current controlled trial (http://www.controlled-trials.com/ISRCTN) as ISRCTN92382106. The primary aim of the original study( Reference Reidlinger, Darzi and Hall 56 ) was to assess the effects on CVD risk factors when following a diet based on UK DG in comparison to a representative UK diet (control). A sample size of 78/group had 90 % power to detect a 4 mmHg effect of diet on daytime systolic ambulatory blood pressure (α = 0·05); this sample size was also large enough to detect a 5 % change in the ratio of total cholesterol: HDL-cholesterol and a 1 % unit change in flow-mediated dilatation of the brachial artery with sufficient statistical power. The results of these primary outcomes have been published previously( Reference Reidlinger, Darzi and Hall 56 ).
The data presented here comprise a secondary analysis of dietary intake data from both the DG and control groups at baseline and endpoint of the 12-week dietary intervention period, to determine whether adherence to UK DG results in an increase in polyphenol intake.
Participants
Healthy men and women (BMI ≥18·5 and ≤35 kg/m2) were recruited from the London area (August 2010–July 2012) by newspaper (London Metro) and electronic advertisement (King’s College London email and website). Participants between the age of 40–70 years were chosen because risk increases markedly with age and an upper age limit of 70 years was selected because absolute annual risk of CVD exceeds 2 % beyond that age in the majority of people, and a higher proportion are receiving medication on daily basis. A full list of inclusion and exclusion criteria have been reported previously( Reference Reidlinger, Darzi and Hall 56 ). For randomisation, a purpose-designed clinical database was used (MedSciNet AB), which undertook the minimisation randomisation, balancing the treatment arms for the minimisation variables of sex, age and ethnicity( Reference Reidlinger, Darzi and Hall 56 ). Participants received dietary advice in person at baseline and at week 4, and by phone at weeks 6 and 8. Dietary assessment included two FFQ and two 4-DFD administered at baseline and endpoint and two 24-h recalls administered at weeks 4 and 8. Urine samples were collected at four time points: baseline, week 4, week 8 and endpoint.
Dietary advice
Participants randomised to the DG group were advised to increase the intake of F&V to 5 portions/d; intake of whole grains to >50 % of cereal intake; to consume 2 portions of fish/week (one of which should be oily); to replace full fat with reduced fat dairy products; to replace fats rich in SFA with spreads/oils low in SFA and high in MUFA; to restrict salt intake to <6 g/d (<100 mmol/d) and to reduce intake of free sugars. The control diet comprised a nutritionally balanced, traditional UK diet, formulated with familiar foods (full cream milk, cheese, butter, meat and meat-products, non-wholegrain cereals), reflecting typical UK intake of F&V (three portions/d), with a higher content of SFA (14 % energy), unrestricted intake of salt and sugar and low intake of oily fish. The study included provision of spread, oil, whole grain pasta, rice and cereal bars, minimally processed wholegrain breakfast cereal (oats, muesli, etc.), almonds and macadamia nuts and tinned oily fish to the intervention group and spread, oil and refined cereals as pantry items to the control group. Participants of both groups were instructed to refrain from taking nutritional supplements during the study( Reference Reidlinger 57 ).
4-d food diary
Dietary intake of polyphenols was quantified from 4-DFD, at baseline and endpoint of the 12-week intervention. A polyphenol food composition database was generated using Phenol-Explorer( Reference Neveu, Perez-Jimenez and Vos 37 – Reference Rothwell, Perez-Jimenez and Neveu 39 ) and USDA database( 40 – Reference Bhagwat, Haytowitz and Holden (Ret.) 42 ) and extended using polyphenol retention factors and recipes provided by participants. If a recipe was not provided by a participant, a standard recipe was obtained from the UK food tables( Reference Finglas, Roe and Pinchen 58 ), a UK food industry recipe book( Reference Campbell, Foskett and Rippington 59 ), the BBC Good Food website( 60 ) or additional websites specialised in UK recipes and other countries’ typical cuisines. In total, 118 recipes were obtained from participants, ninety-three from UK food tables, twenty from a UK food industry recipe book, seventy-eight from the BBC Good Food website and ninety-four from other websites. Polyphenol intake was estimated for four classes of polyphenols: flavonoids, phenolic acids, lignans and stilbenes. An additional group of polyphenols were included under the name ‘other polyphenols’; since Phenol-Explorer grouped a series of compounds including alkylmethoxyphenols, alkylphenols, curcuminoids, furanocoumarins and tyrosols. The flavonoid intake was analysed in eight subclasses: anthocyanins, dihydrochalcones, flavanols (flavan-3-ols monomers and theaflavins), proanthocyanidins, flavanones, flavones, flavonols and isoflavones, for each subclass a range of 2–11 of the most representative individual compounds were selected. For phenolic acids, subclass two groups were analysed: hydroxybenzoic acids and hydroxycinnamic acids, for each group a range of 4–6 of the most representative individual compounds were selected. For lignans subclass, four individual compounds were analysed: pinoresinol, lariciresinol, secoisolariciresinol and matairesinol. For stilbenes subclass, resveratrol was selected and analysed. A total of fifty-two individual polyphenols were analysed and 1141 food items were included in the final database.
FFQ
Dietary intake of flavonoids was quantified from FFQ (EPIC-Norfolk FFQ version 6)( Reference Bingham, Gill and Welch 61 ) at baseline and endpoint of the 12-week intervention. Flavonoid intake was estimated from six subclasses and the most representative compounds for each: flavanones (hesperetin, naringenin, eriodictyol), anthocyanins (cyanidin, delphinidin, malvidin, pelargonidin, peonidin, petunidin), flavones (apigenin, luteolin), flavonols (quercetin, kaempferol, myricetin, isorhamnetin), flavan-3-ols (catechin, epicatechin, gallocatechin, epigallocatechin, epicatechin-3-gallate, epigallocatechin-3-gallate) and polymers (theaflavins, thearubigins and proanthocyanidins). In total, thirty-two individual flavonoids were analysed using a database created and kindly provided by Dr Amy Jennings and Professor Aedin Cassidy from the University of East Anglia( Reference Jennings, Welch and Fairweather-Tait 15 ) and modified for the requirements of the FFQ analysis, so that the flavonoid content of 130 food items was analysed. FFQ registers the frequency of consumption of specific foods, of standard portion size, in a month. There were nine answer options that varied from ‘never or less than once in a month’ to ‘six or more per day’. To calculate the total intake of subclasses of flavonoids, frequencies were converted to daily portions and multiplied by flavonoid content in each specific food item; the results were summed for each subclass and for each participant.
Liquid chromatography-tandem MS
24-h urine collections were made as previously described( Reference Reidlinger, Darzi and Hall 56 ), using boric acid as preservative( Reference Achaintre, Buleté and Cren-Olivé 62 ) and aliquots stored at –80°C until analysis. Completeness of urine collection was measured using recovery of para-aminobenzoic acid, according to a standard protocol( Reference Bingham and Cummings 63 ). Liquid chromatography-tandem MS analysis was only performed on endpoint urine samples collected at week 12 of the intervention to coincide with the dietary assessment by 4-DFD. A previously published protocol for polyphenol analysis in urine( Reference Ito, Gonthier and Manach 47 ) was adapted and developed for the quantification of ten aglycone metabolites of polyphenols. A subsample of the CRESSIDA study was selected for the analysis; the selection was based on the intake of F&V reported in the endpoint FFQ, subsample included participants in the control group reporting the lowest intake of F&V and participants in the intervention group reporting the highest intake of F&V were analysed. Quantification of endpoint samples allowed the comparison between groups at the end of the dietary intervention; the aim was to detect greater amounts of polyphenols excreted in urine by participants who reported consuming the most polyphenols by FFQ compared with participants who reported consuming the least and to determine the agreement with food diary data. One or two of the most representative aglycones of different polyphenol subclasses was selected for quantification. A total of ten phenolic compounds were analysed: phloretin (dihydrochalcones), epicatechin (flavan-3-ols), hesperetin and eriodictyol (flavanones), luteolin (flavones), quercetin (flavonols), daidzein (isoflavones), gallic and vanillic acid (phenolic acids) and enterolactone as a product of microbial metabolism of lignans in colon. The phenolic compounds selected for quantification have been suggested as suitable biomarkers of polyphenol intake( Reference Perez-Jimenez, Neveu and Vos 55 ), with a high recovery and good correlation with F&V intake when estimated by FFQ, 24 h recalls or food diaries( Reference Edmands, Ferrari and Rothwell 50 ). The major food sources of the ten phenolic compounds are F&V and wholegrain products, or represent the main metabolites of parent glucosides present in the previously mentioned foods.
Purified standards phloretin, epicatechin, eriodictyol, hesperetin, luteolin, daidzein, gallic and vanillic acids were obtained from Santa Cruz Biotechnology, and quercetin, enterolactone and catechin-2,3,4-13C3 from Sigma-Aldrich. Stock solutions were prepared for all the purified phenolic compounds, 2 mg of each of the ten purified compounds was diluted in 1 ml of methanol or dimethyl sulphoxide, according to supplier specifications and 1 mg of catechin-2,3,4-13C3 (internal standard) in 1 ml of methanol. Stock solutions were stored at –40 or –80°C (internal standard). Enzyme β-glucuronidase/sulphatase (0·05 g) type H-5 from Helix pomatia (Sigma-Aldrich) was diluted in 1 ml of 0·2 % sodium chloride solution to create a working solution of 50 000 units/ml; the enzyme solution was stored at –40°C. Urine samples (250 μl) were processed for hydrolysis of glucuronide and sulphated metabolites using a modified version of Ito et al. ( Reference Ito, Gonthier and Manach 47 ). Urine samples were acidified with acetic acid (20 μl, 0·58 m) and incubated with 1300 units of β-glucuronidase/sulphatase and 300 ng of internal standard at 37°C, 120 rpm for 1·5 h. A liquid–liquid extraction with ethyl acetate was performed twice (400 and 300 μl). The two organic layers were pooled and evaporated to dryness under N2 then stored at –80°C for 1–4 d until their reconstitution with 100 μl of 40 % methanol immediately before injection. Analysis of urine samples was performed on a HPLC system Hewlett-Packard series 1100 binary pump, coupled with a triple quadrupole mass spectrometer, Micromass Quattro LC (Micromass Limited), operating in negative electrospray ionisation (ES–) mode, equipped with a Zorbax SB-C18 column (2·1 × 50, 3·5 mm; Agilent). Ionisation and fragmentation were optimised for each polyphenol by direct infusion of a standard solution, and specific values for collision energy parameters were identified for each polyphenol. Peak for each polyphenol identity was established by the parent and daughter ion pair peak and retention time. Solvents A (water with 0·1 % v/v formic acid) and B (acetonitrile with 0·1 % v/v formic acid) were run in a 95/5 % proportion at a flow rate of 0·2 ml/min with the following gradient: 0–1 min, 5 % solvent B; 1–4 min, increase solvent B from 5 to 10 %; 4–5 min, increase solvent B from 10 to 90 %, 5–5·2 min, decrease solvent B from 90 to 5 %, 5·2–15 min isocratic for 9·8 min. Peak areas were plotted against the internal standard response. A good linearity (r 2 0·970–0·990) was observed for all the polyphenols quantified except for luteolin (r 2 0·922). Samples were run in the same batch and chromatograms were processed automatically by MassLynx Mass Spectrometry Software (MASSLYNX™ version 3.5) using the same processing integrate parameters, peak-to-peak amplitude and peak detection. Intra-assay co-efficients of variability were phloretin 7·5 %, epicatechin 6 %, hesperetin 21·9 %, eriodictyol 9·6 %, luteolin 9·8 %, quercetin 10·8 %, daidzein 3·1 %, gallic acid 21·4 %, vanillic acid 14·4 % and enterolactone 5·1 %. Final quantities of phenolics compounds were estimated after adjusting the urinary volume. Calibration curves were prepared by spiking HPLC-grade water with 2·5, 5, 12·5, 25, 50, 100, 150, 200 and 250 μl of mixed polyphenols working solution and 100 μl of internal standard working solution, the calibration curve range was 5–500 ng/ml. Spiked HPLC-grade water samples were treated with enzyme and extracted with ethyl acetate as were the urine samples, and spiked samples were injected in duplicate at each concentration level. Limits of quantification were established using the spiked samples for calibration curves; minimum detected values were 5 ng/ml for phloretin, epicatechin, eriodictyol, hesperetin, luteolin, daidzein, gallic acid and vanillic acid and 10 ng/ml for quercetin and enterolactone.
Statistical analysis
Statistical analysis was performed using Statistical Package for the Social Sciences version 21. 4-DFD intake data( Reference Rhee, Sampson and Cho 64 ) were expressed as weight of intake (g)/d per 10 MJ energy intake, to adjust for the variability in total food intake between individuals over the 4 d, whereas FFQ data were expressed simply as weight of intake (g)/d. Normality of data distribution was evaluated visually by inspection of the histograms and normal Q–Q plots. Non-normally distributed variables were natural log transformed before statistical analysis by parametric methods, or analysed by non-parametric methods where log transformation failed to yield a normal distribution. Independent-samples t tests were conducted to compare groups at baseline to verify whether the polyphenol intake of each treatment group was similar before the dietary intervention. In cases where the data were normally distributed, one-way ANOVA was conducted, with sex as a fixed factor and baseline value as covariate (ANCOVA) was conducted to find differences between groups at endpoint. In instances where the data could not be transformed to a normal distribution, a Mann–Whitney U test was conducted to find the differences between groups at endpoint. Correlation analyses on urinary and dietary polyphenols were conducted by two-tailed Spearman’s correlations.
Results
A total of 165 healthy men and women aged 40–70 years were recruited, and 162 completed the CRESSIDA study (sixty-four males, ninety-seven females) (Fig. 1). Dietary intake of polyphenols was quantified from 322 × 4-DFD (n 161) and from 322 FFQ (n 161) (EPIC-Norfolk FFQ version 6)( Reference Bingham, Gill and Welch 61 ) at baseline and endpoint of the 12-week intervention, one participant randomised to the DG group did not complete the collection of food diaries and, therefore, was eliminated from the analysis. Urinary excretion of polyphenols was analysed in a subsample (n 91) of the CRESSIDA study: forty-five samples from participants in the control group reporting the lowest intake of F&V, and forty-six samples from participants in the intervention group reporting the highest intake of F&V.
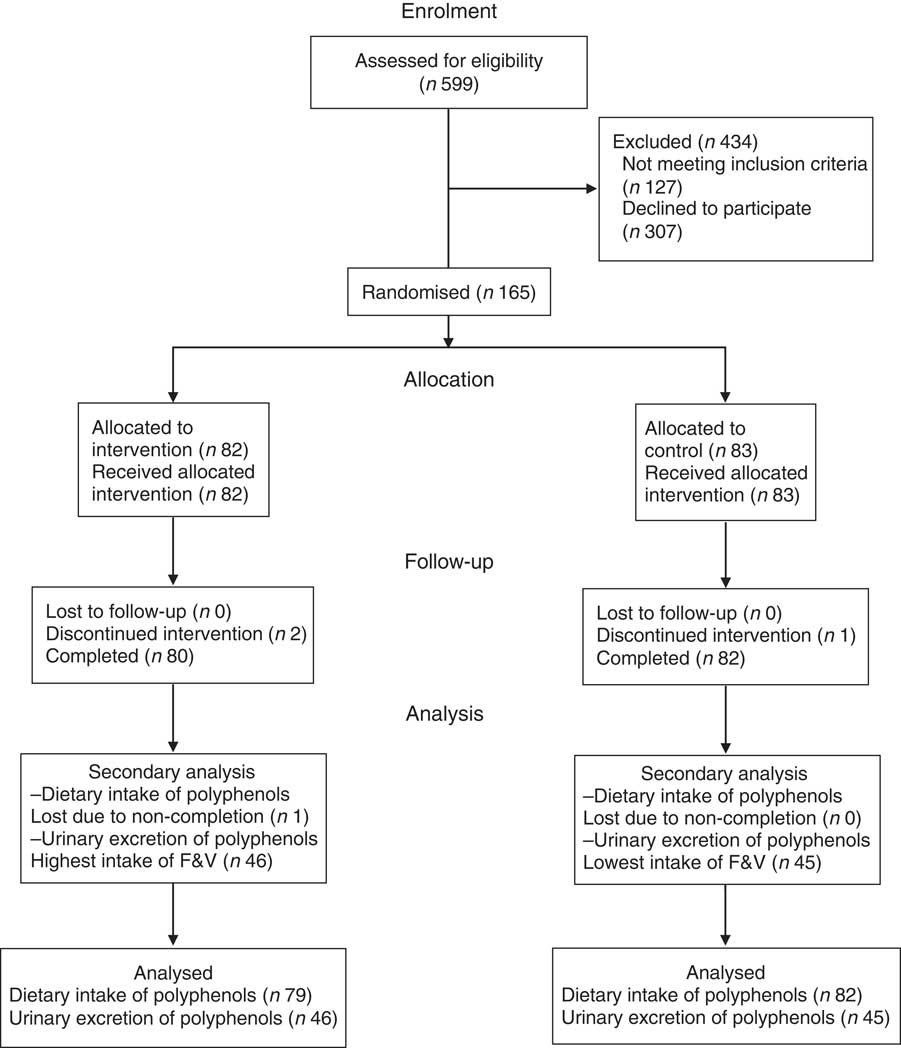
Fig. 1 Flow of participants through the Cardiovascular risk REduction Study: Supported by an Integrated Dietary Approach study. F&V, fruits and vegetables.
Characteristics of the whole CRESSIDA study population at baseline are shown in Table 1. Mean BMI was significantly higher in the control group. Intakes of wholegrain cereals, fruits and vegetables and dietary fibre were higher in the study population at baseline than those reported in a larger, representative UK population sample( Reference Bates, Lennox and Prentice 11 , Reference Reidlinger, Darzi and Hall 56 ). As reported previously, at endpoint, the urinary K excretion was 9 mmol/d high in the DG group, indicating higher consumption of F&V. Reported wholegrain cereal intake was 81 g/d at endpoint in the DG group (mainly wheat, oats and rice) compared with the 32 g/d in the control group, as confirmed by the high plasma alkylresorcinol concentrations, reflecting intake of whole grains mainly from wheat, barley and rye( Reference Reidlinger, Darzi and Hall 56 ).
Table 1 Baseline characteristics of the Cardiovascular risk REduction Study: Supported by an Integrated Dietary Approach study population by randomised group (Numbers, mean values and standard deviations)
SBP, systolic blood pressure; DBP, diastolic blood pressure.
* Statistical comparisons between groups at baseline by independent t test or independent-samples Mann–Whitney U test.
4-d food diary
Median total polyphenol intake at baseline in the whole study population (with lower and upper limits of IQR) was 1183 mg/d (745, 1613), or 1282 mg/d per 10 MJ energy intake (896, 1838). As shown in Table 2, baseline intake of total polyphenols was significantly higher in the DG group compared with the control group due to the high intake of total flavonoids, the main contributor being total proanthocyanidins.
Table 2 Daily intake of polyphenols estimated by a 4-d food diary and adjusted for energy intake following dietary guidelines and control diets (Medians and interquartile ranges (IQR); geometric mean values and 95 % confidence intervals)
* Statistically significant differences between groups at baseline by independent t test (total polyphenols) or independent-samples Mann–Whitney U test (all other comparisons); intake was higher in the dietary guidelines group than the control group (P <0·05).
† Statistical comparisons between groups at endpoint by Mann–Whitney U test.
‡ Adjusted for baseline and sex at endpoint.
§ Statistical comparisons between groups at endpoint adjusted for baseline and sex by ANCOVA.
At endpoint, the total polyphenol intake per 10 MJ energy intake, adjusted for sex and baseline polyphenol intake, was higher in the DG group than in the control group (Table 2). Analysis of intake of polyphenol classes at endpoint (unadjusted for sex and baseline, as non-parametric statistical analysis was necessary) demonstrated that the DG group had higher intake of total flavonoids (although also higher in DG at baseline), total lignans, phenolic acids, stilbenes and ‘other polyphenols’ compared with the control group. For the major flavonoid subclasses, the DG group reported higher intake of anthocyanins, proanthocyanidins (although these were also higher at baseline) and isoflavones but not dihydrochalcones, flavanols, flavones or flavonols. For the major phenolic acid subclasses, the DG group reported higher intake of hydroxycinnamic acids, but the trend for higher intake of hydroxybenzoic acids was not statistically significant.
For individual (poly)phenols, there were no differences between groups at baseline, but at endpoint the group following the DG diet reported higher intake of a number of anthocyanins including cyanidin, malvidin, peonidin and petunidin (P <0·05) compared with the control group. Furthermore, intakes of individual flavanones (naringenin, eriodictyol and hesperetin, P <0·05), a flavone (luteolin, P <0·05) and isoflavones (daidzein and genistein, P <0·01) were higher in the DG group compared with the control group at endpoint. With regard to lignans, phenolic acids and stilbenes classes, there were higher intakes of secoisolariciresinol (P <0·05), matairesinol (P <0·001), protocatechuic acid (P <0·01), vanillic acid (P <0·001), 4-hydroxybenzoic acid (P <0·001), syringic acid (P <0·001), p-coumaric acid (P <0·001) and ferulic acid (P <0·05) at endpoint in the DG group compared with the control group. There were no differences between groups in individual flavonols (including kaempferol, quercetin, myricetin and isorhamnetin) nor flavanols (including individual catechins and theaflavins).
The main sources of total polyphenols at endpoint in both groups were tea, coffee and wine (control: 61 %, DG: 59 %), fruits (control: 10 %, DG: 17 %) and fruit juices (control: 8 %, DG: 4 %) (Fig. 2). Main sources of flavonoids in control and DG groups were tea, coffee and wine (control: 55 %, DG: 55 %), fruits (control: 14 %, DG: 21 %) and fruit juices (control: 10 %, DG: 5 %). Main sources of the subclass flavanols subclass were tea, coffee and wine (control: 64 %, DG: 65 %), fruits (control: 13 %, DG: 19 %) and chocolates (control: 11 %, DG: 4 %). There was an increase in the percentage of polyphenols sourced by fruits, cereal products (breakfast cereal and cereal bar) and nuts and seeds (see Fig. 3 for further details) in the group following the DG diet compared with the baseline. There was a decrease in the percentage of polyphenols derived from the less recommended food options as fruit juices, chocolates and biscuits (Fig. 3).
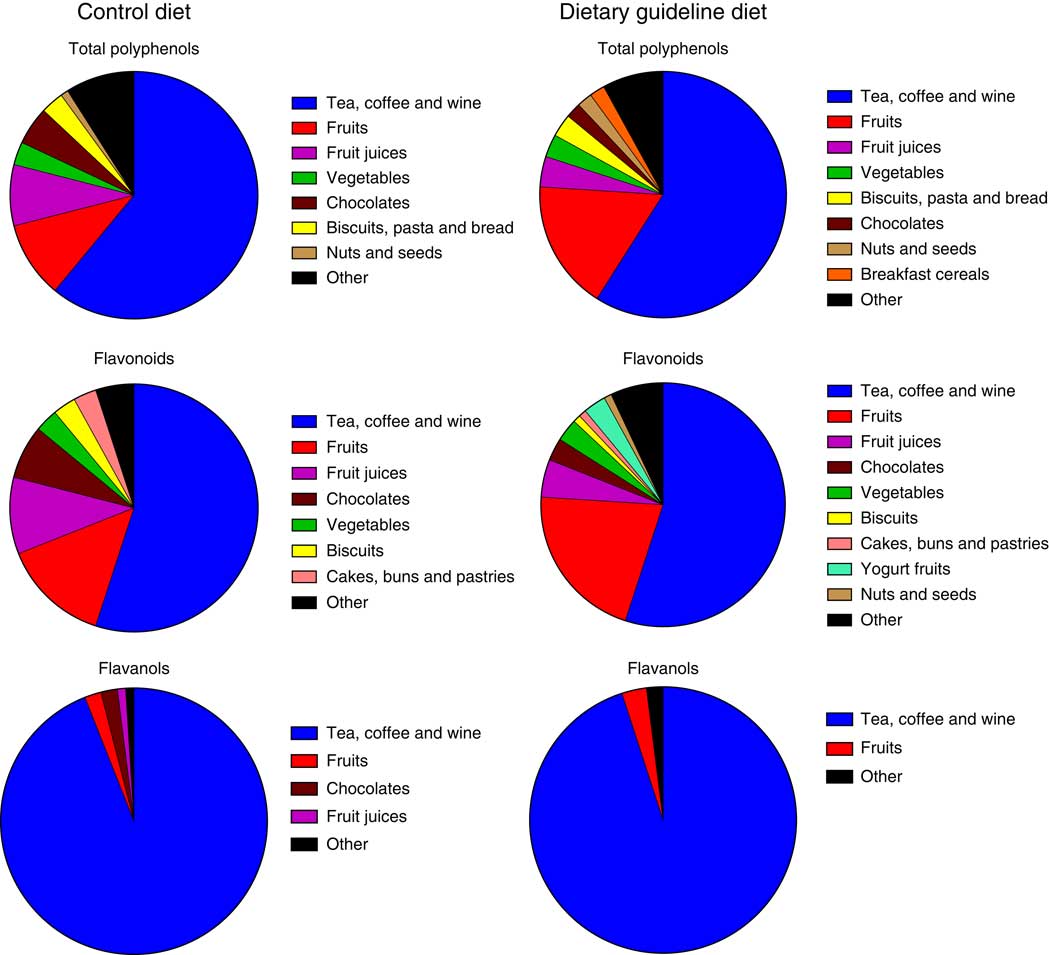
Fig. 2 Main polyphenol food sources in control and dietary guidelines groups, at endpoint, of the Cardiovascular risk REduction Study: Supported by an Integrated Dietary Approach study as estimated by a 4-d food diary.
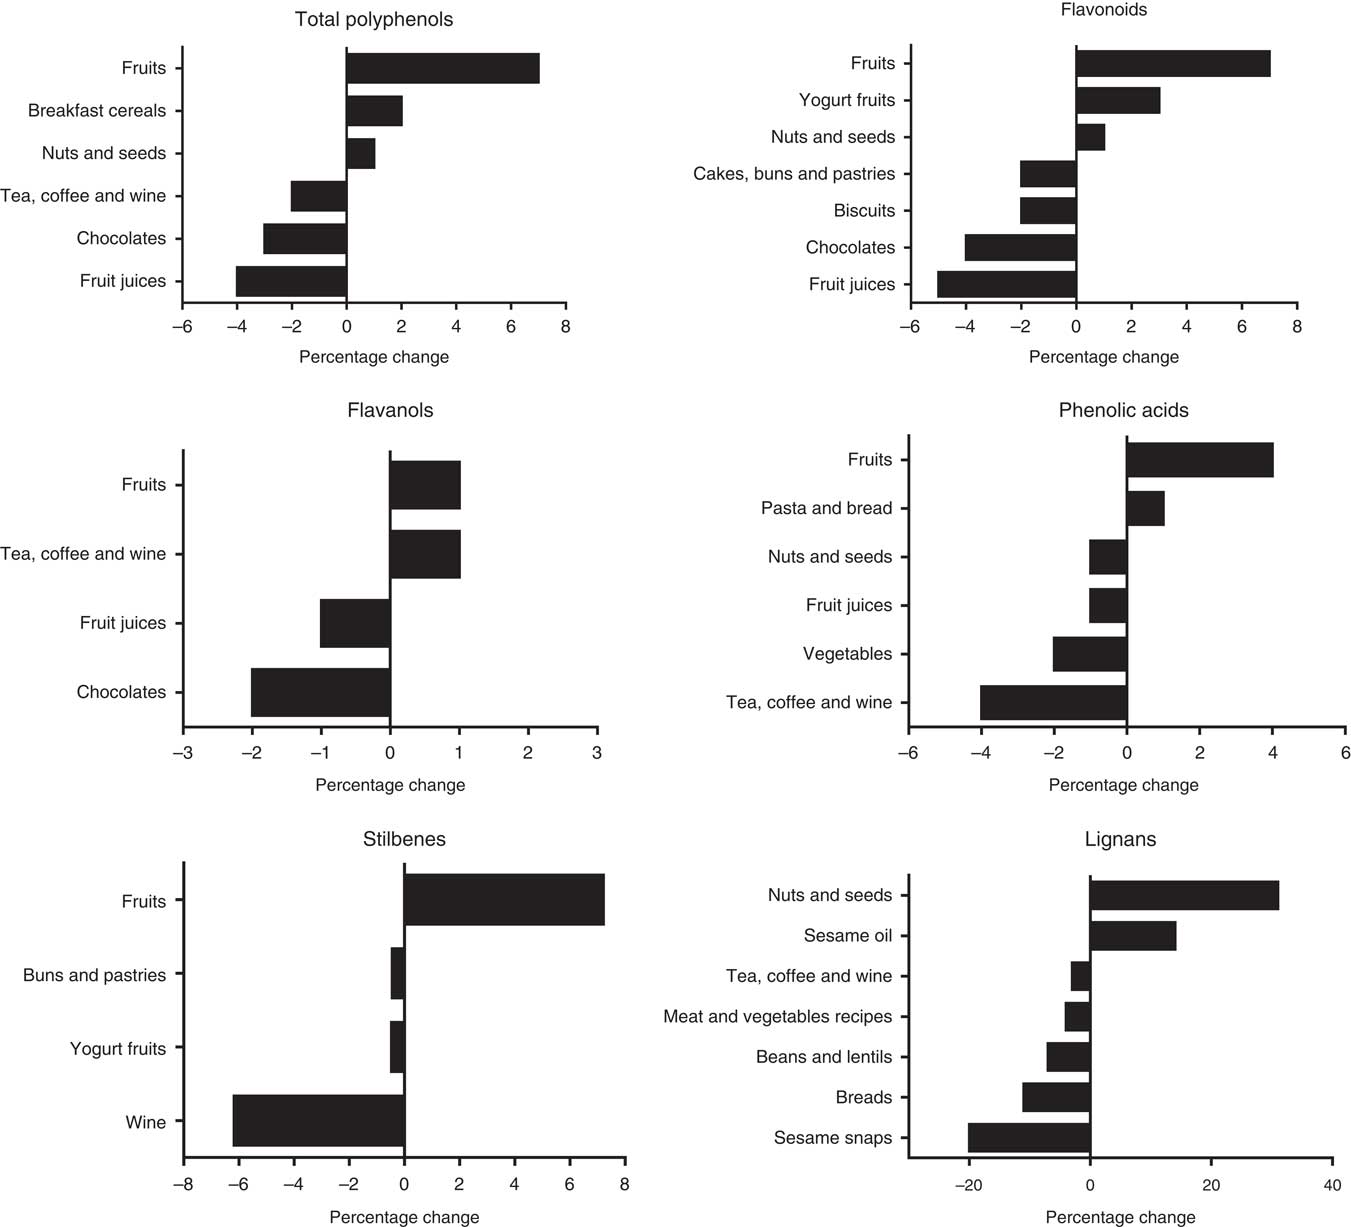
Fig. 3 Percentage changes from baseline in main food group sources of polyphenols in dietary guidelines group as estimated by a 4-d food diary.
FFQ
There was no difference in total flavonoids and flavonoid subclass estimated intake between groups at baseline. At endpoint, the DG group reported higher intake of total flavonoids, total anthocyanins, total flavones, total flavanols and total proanthocyanidins (Table 3). Flavanone and flavonol intake did not differ between groups at endpoint. Differences between individual polyphenol components revealed higher reported intakes of cyanidin, delphinidin, petunidin and peonidin (P <0·001), malvidin and pelargonidin (P <0·005), catechin (P <0·01), and epicatechin-3-O-gallate, epigallocatechin-3-O-gallate, myricetin and luteolin (P <0·05) in the DG group (data not shown) compared with control.
Table 3 Daily intake of flavonoids estimated by FFQ in dietary guidelines and control groups* (Medians and interquartile ranges (IQR))
* There were no significant differences between groups at baseline.
† Statistical comparisons between groups at endpoint by Mann–Whitney U test.
Urinary polyphenol excretion
The ten aglycones quantified in urine were either metabolites of parent glucuronide/sulphated compounds formed in the human tissues or metabolites produced by the gut microbiota, for example, enterolactone from lignans present in fibre-rich food. At endpoint, there was a greater 24 h urinary excretion of phloretin, eriodictyol, hesperetin, luteolin, quercetin, gallic acid, vanillic acid and enterolactone in the DG group compared with the control group (Table 4), and a non-significant tendency towards a similar response for daidzein excretion. Daidzein was not detected in thirty-seven participants of the ninety-one subsample, which could contribute to the lack of significance in the results, given that values observed are considerably higher in the intervention group. The only polyphenol that was excreted in similar amounts in both dietary groups was epicatechin.
Table 4 Comparison of urinary phenolic excretion method and polyphenol intake estimated by a 4-d food diary in their ability to discriminate between subsample populations adhering to either dietary guidelines or a control diet† ‡ (Medians and interquartile ranges (IQR))
* Statistically significant differences between groups at endpoint (P <0·05).
† Excretion of polyphenols in 24 h urine and dietary intake of the direct dietary precursor estimated by a 4-d food diaries at endpoint in a subsample of the Cardiovascular risk REduction Study: Supported by an Integrated Dietary Approach study population selected for the lowest (control group) and highest (dietary guidelines group) fruit and vegetables intake using self-reported data from FFQ (n 91).
‡ All between-group comparisons were carried out by independent-samples Mann–Whitney U test.
§ Values adjusted for 24 h urine volume.
|| Sum of phloretin and phlorizin.
¶ Intake of lignans was used as a direct dietary precursor of enterolactone.
Discussion
The aim of this secondary analysis of dietary intake data from the CRESSIDA trial was to investigate whether following advice to adhere to UK DG increased polyphenol intake. Baseline polyphenol/flavonoid intake from 4-DFD and FFQ was in alignment with the previous reports in the UK population using 24 h recall( Reference Zamora-Ros, Knaze and Lujan-Barroso 27 – Reference Yahya, Day and Lawton 31 , Reference Tetens, Turrini and Tapanainen 65 – Reference Knaze, Zamora-Ros and Lujan-Barroso 67 ) or FFQ( Reference Jennings, Welch and Fairweather-Tait 15 ). The hypothesis was supported by the finding that the total estimated polyphenol intake was approximately 200 mg/10 MJ energy intake higher at endpoint in the DG group compared with the control group. However, estimates of total polyphenol intake are only as accurate as the polyphenol composition data and rely on the sum of the components, which may lead to underestimation if complete composition profile data are unavailable for individual foods. Therefore, total polyphenol intake data should be interpreted in the context of the individual polyphenol intake. Estimated dietary intake by 4-DFD showed that the DG group had higher intake of individual polyphenols/phenolic acids, where the main food sources were fruits and vegetables (cyanidin, malvidin, peonidin, petunidin, protocatechuic acid, naringenin, eriodictyol, hesperetin and syringic acid), nuts and seeds (secoisolariciresinol and matairesinol) and soya products (daidzein, genistein and other isoflavonoids) compared with the control group. In agreement with the 4-DFD results, FFQ estimates of total flavonoids, proanthocyanidins and anthocyanins were higher in the DG group compared with the control group. A total of ten representative aglycone polyphenols and phenolic acids (from glucuronidated and sulphated metabolites) were measured in 24 h urine samples collected concurrently with 4-DFD as the objective biomarkers of (poly)phenol intake, to determine the accuracy of the dietary intake estimates. The ability to discriminate between the dietary group subsamples was consistent with 4-DFD, except for epicatechin, daidzein and quercetin where there were no significant differences in urinary excretion in contrast with higher estimated intake in the DG group by 4-DFD. Both the 4-DFD and urinary biomarker methods agreed that intake of phlorizin/phloretin, eriodictyol, hesperidin, luteolin, vanillic acid and lignans/enterolactone was greater in the DG group.
The ability to discriminate between dietary intervention groups supports the utility of 4-DFD and urinary metabolites for assessment of dihydrochalcones, flavanones, flavones, hydroxybenzoic acids and lignan intake over short-term periods. Differing findings may be due to the incomplete phenolic composition data, the well-known inaccuracies of self-reported dietary assessment methodology( Reference Bingham, Gill and Welch 68 , Reference Zamora-Ros, Rabassa and Llorach 69 ) and the inter-individual variability in absorption and metabolism( Reference Rodriguez-Mateos, Vauzour and Krueger 8 , Reference Chen, Zheng and Li 70 ) or incomplete deconjugation of sulphated/glucuronidated metabolites( Reference Saha, Hollands and Needs 71 ) reflected in the urinary biomarkers. Urine polyphenol concentrations may also be the sum product of endogenous metabolism and dietary intake. For example, gallic acid is a common metabolite of black tea theaflavins and thearubigins( Reference Henning, Wang and Abgaryan 72 , Reference Crozier, Clifford and Del rio 73 ); therefore, its urinary excretion could reflect the consumption of such beverage combined with foods providing gallic acid per se. Vanillic acid can be found in high concentrations in foods consumed in small quantities such as herbs; also in moderate concentration in dates, olives and cranberries and in low concentrations in foods more frequently consumed like oats and rice( Reference Rothwell, Perez-Jimenez and Neveu 39 ). It is also a common metabolite of anthocyanins( Reference Nurmi, Mursu and Heinonen 74 , Reference de Ferrars, Cassidy and Curtis 75 ), and variability in urinary vanillic acid excretion could reflect varying intake of both vanillic acid and anthocyanin-rich foods, therefore it is likely that the increased urinary excretion at endpoint mainly represents intake of foods rich in anthocyanins rather than vanillic acid. Vanillic acid is also reported to be present in urine after consumption of black tea( Reference Olthof, Hollman and Buijsman 76 ) and dark chocolate( Reference Rios, Gonthier and Remesy 77 ); however, intakes of black tea and dark chocolate were not higher in the DG group at endpoint and, therefore, are unlikely to account for the increased urinary excretion and reported intake in the 4-DFD. Enterolactone is the main colonic metabolite of lignans, which are phytoestrogenic compounds present in high concentrations in vegetables, cereals and grain products, seeds, nuts and berries and other fruits( Reference Tetens, Turrini and Tapanainen 65 , Reference Pounis, Di Castelnuovo and Bonaccio 78 ). These urinary excretion data are in agreement with previous epidemiologial studies( Reference Valls-Pedret, Lamuela-Raventos and Medina-Remon 79 ), supplementation studies where known doses of polyphenols were administrated( Reference Perez-Jimenez, Hubert and Hooper 44 , Reference Shi and Williamson 80 ), randomised controlled trial (RCT) aiming to increase flavonid-rich F&V intake( Reference Chong, George and Alimbetov 81 ) and population under free-living conditions( Reference Mennen, Sapinho and Ito 43 ). Polyphenol urinary excretion has shown to be an useful biomarker of F&V intake, capable of detecting even small changes in studies under controlled diets( Reference Nielsen, Freese and Kleemola 45 , Reference Brevik, Rasmussen and Drevon 82 , Reference Vetrani, Rivellese and Annuzzi 83 ).
Following DG did lead to increase in specific polyphenols that have been associated with health benefits (e.g. anthocyanins, flavanones, isoflavones, phenolic acids and lignans( Reference Garcia-Conesa, Chambers and Combet 84 – Reference Testai and Calderone 87 )). This suggests that consuming at least 5 portions of F&V/d and >50 % of cereal intake as wholegrain will lead to an enrichment in dietary polyphenol profiles above and beyond the large amounts of polyphenols supplied by beverages. In particular, estimated anthocyanidin intake was augmented by following DG that may confer a reduction in the risk of T2D( Reference Jennings, Welch and Spector 25 ) and acute reductions in postprandial glycaemia( Reference Törrönen, Kolehmainen and Sarkkinen 88 – Reference Castro-Acosta, Smith and Miller 91 ). The dietary intake results reported here are consistent with the theory that greater intake of specific polyphenols may contribute to the protective effects of a diet rich in fruits and vegetables and wholegrain cereals, alongside greater dietary intake of nutrients and other non-nutrient bioactives, for example, K, vitamin C, soluble fibre, carotenoids and glucosinolates. However, our results confirm( Reference Vogiatzoglou, Mulligan and Luben 29 – Reference Yahya, Day and Lawton 31 ) that food groups that are recommended by UK government as part of the Eatwell Guide – fruits and vegetables, wholegrain cereals, beans, pulses, nuts and seeds – contribute a much smaller proportion of daily polyphenol intake in a UK population compared with commonly consumed beverages, even when that population is following DG. Analysis of dietary data showed no group differences in (poly)phenol intake (by 4-DFD) where main food sources were not targets for UK DG such as tea (catechins, theaflavins, proanthocyanidins, quercetin) and wine (stilbenes, proanthocyanidins). However, the sources of these polyphenols may have differed between groups; for example, the DG group reported lower intake of stilbenes from wine and increased intake of stilbenes from fruits.
The relative impact of total and specific (poly)phenol intake on risk of CVD and type 2 diabetes requires investigation. Clearly there is only limited scope for increasing total polyphenol intake by following DG – an approximate increase of 200 mg/d per 10 MJ energy intake. The extent to which this is relevant to cardiometabolic health is currently unclear due to the lack of robust evidence for the relative impact of different polyphenol subclasses on risk factors for CVD and type 2 diabetes. Although the evidence is currently insufficient, it is plausible to hypothesise that in the future there may be consensus that tea and coffee (poly)phenols( Reference Hartley, Flowers and Holmes 92 , Reference Tajik, Tajik and Mack 93 ) may have some of the strongest cardiometabolic protective effects amongst all dietary phenolics, so that due to the large amounts of tea and coffee consumed by a population level, the gain to health in consuming at least 5 portions/d of fruits and vegetables and choosing wholegrain sources of starchy carbohydrates is likely to be due to other nutritional factors. Conversely, future advances in nutritional science may 1 d demonstrate that certain polyphenols specific to fruits, vegetables or wholegrain cereals have particularly potent bioactivity in preventing inflammation, atherosclerosis or insulin resistance, which would bring about a departure from the prevailing approach of considering all plant chemicals that contain a similar chemical structure in the same way. There has been some debate around whether establishing a dietary reference intake for polyphenols could be beneficial; with suggested approaches including recommendations for polyphenol-rich F&V (5-a-day)( Reference Williamson and Holst 52 ), establishing a specific daily dose for a given effect( Reference Williamson 54 ) or establishing values to improve health or prevent disease risk in different life stages( Reference Lupton, Atkinson and Chang 53 ). Further research is required to provide robust interventional evidence for any refinement to current ‘5-a-day’ guidelines, since the relative health impact of a multitude of other non-nutrient bioactives and the complex array of plant cell wall polysaccharides, resistant starch and oligosaccharides (collectively known as fibre) contained in low-polyphenol plant-based foods is only partially understood. Furthermore, in the light of the fact that NDNS survey data suggest that the UK population are not meeting current recommendations for F&V then it would be futile, and possibly counter-productive, to add further complexity to existing public health dietary advice.
The validation of adequate biomarkers of dietary intake of exposure to dietary components and of compliance to dietary interventions has been a focus of investigation for many years( Reference Dragsted, Gao and Pratico 94 ), and the identification of polyphenol intake biomarkers is no exception( Reference Vetrani, Rivellese and Annuzzi 83 , Reference Noh, Freisling and Assi 95 ). Assessment of compliance in dietary intervention studies with fruits and vegetables has been done by validated biomarkers( Reference Woodside, Draper and Lloyd 96 ) such as vitamin C, carotenoids and K, however, polyphenol excretion in urine may be used to assess flavonoid-rich dietary interventions( Reference Chong, George and Alimbetov 81 ) or specific F&V intake, for example, phloretin for apple intake and naringenin and hesperetin for citrus fruit( Reference Noh, Freisling and Assi 95 , Reference Brouwer-Brolsma, Brennan and Drevon 97 ). Given the importance of accurate assessment of polyphenol intake to link it with beneficial effects on health( Reference Kuhnle 98 ), the ability to detect the amount consumed represents a challenge in epidemiological and clinical studies.
The bespoke food composition table developed for the 4-DFD polyphenol analysis in the present study included the estimation of fifty-two individual compounds and contained 1141 foods representative of an average UK diet as well as some of the most commonly eaten food from non-traditional UK cuisine as Turkish, Indian, Italian, Chinese, Japanese and others. This food composition table could be used as a basis for future studies analysing diet patterns in the UK population, comparing polyphenols intake and/or linking intake with health benefits, although it would require a significant staff cost commitment to maintain and update with new recipes and new versions of Phenol-Explorer over time. Although an onerous process, the creation of a bespoke food composition table for polyphenol analysis in a specific population seems to be the most effective way to obtain an accurate estimation of polyphenol intake. Although the FFQ is a valid and reliable dietary assessment tool for estimation of habitual intake in populations, it has limitations in the way that it can collect information, since it is based on uniform estimated portion sizes and is semi-quantitative. Dietary intake of total flavonoid intake, six flavonoid subclasses and thirty-two individual flavonoids (aglycones) were estimated by FFQ (EPIC-Norfolk) using the methodology previously applied in large cohort studies( Reference Jennings, Welch and Fairweather-Tait 15 , Reference Cassidy, Mukamal and Liu 17 , Reference Wedick, Pan and Cassidy 23 , Reference Jennings, Welch and Spector 25 , Reference Jacques, Cassidy and Rogers 26 , Reference Cassidy, O’Reilly and Kay 99 ). The EPIC-Norfolk FFQ, although validated for whole foods intake( Reference McKeown, Day and Welch 100 ), has not been validated for flavonoid intake. Methodological barriers of this approach in regard to flavonoid estimation are particularly limiting in smaller study cohorts: some foods are grouped incongruously with regard to their flavonoid composition such as ‘strawberries, raspberries and kiwi’, or ‘peaches, plums and apricots’ and ‘wine’ (no separation of red, white and rose). Some important flavonoid sources are missing such as blueberries, soya beverages, lemon, among others. The inadequacy of this method could lead to under- or overestimation of flavonoid intake. Studies have used food diaries for estimation of flavanol intake among European population( Reference Vogiatzoglou, Mulligan and Luben 29 ), isoflavone and lignan intake( Reference Mulligan, Kuhnle and Lentjes 66 ) and twenty subclasses of polyphenols( Reference Yahya, Day and Lawton 31 ) among the UK population, each one creating their own food composition table for polyphenol analysis; however, they have not included objective biomarkers for corroborating agreement between methods. More specialised questionnaires for intake estimation have been developed for individual compounds like quercetin and naringenin( Reference Ranka, Gee and Biro 101 ), flavonoid subclasses such as flavonols and flavones among a Chinese population( Reference Zhang, Cao and Chen 102 ), complete flavonoid class among Australian population( Reference Somerset and Papier 34 ) and Flemish population( Reference Mullie, Clarys and Deriemaeker 103 ). In summary, although the FFQ results reported here were in broad agreement with the 4-DFD, regarding the discernment of differences in total flavonoid intake in a dietary intervention study, future research in this area could include the development of a specific FFQ, validated among the UK population, for estimation of phenolic intake including all classes and main subclasses as were estimated by 4-DFD in this study.
Limitations in the present study include the hydrolysis of urinary polyphenols by glucuronidase/sulphatase enzymes before analysis, which could compromise the stability of polyphenols that are to be quantified( Reference Cheynier, Tomas-Barberan and Yoshida 104 , Reference Ding, Peng and Zhang 105 ). Glucuronidase/sulphatase enzymes may fail to completely hydrolyse all sulphated and methylated-sulphated metabolites, which may have been compounded by the addition of boric acid as a preservative to prevent yeast growth, and, therefore, urinary excretion of the corresponding aglycone could be underestimated( Reference Saha, Hollands and Needs 71 ). Furthermore, our approach required preselection of polyphenols to be analysed, which means that many other polyphenols present in 24 h urine that may have also functioned as biomarkers of intake were not detected and quantified. Although the reported anthocyanidin intake was greater in the DG group, we did not attempt to analyse anthocyanins in urine as they have low recovery as parent compounds and only weak correlations with the dose ingested, necessitating the use of stable isotopes to accurately measure the excretion of anthocyanin metabolites( Reference Perez-Jimenez, Hubert and Hooper 44 ). The 4-DFD proved to be an accurate approach for estimating short-term polyphenol intake, however, serious consideration must be made of the potential researcher burden and cost if using these methods in larger-scale studies, particularly where a simple indicator of compliance to dietary advice is required.
Strengths of our study include the fact that the data collected in this study enabled a comparison of two dietary assessment methods with objective biomarkers of (poly)phenol dietary intake collected concurrently towards the end of the dietary intervention period. To date, this three-way comparison has only been reported previously in a cross-sectional( Reference Burkholder-Cooley, Rajaram and Haddad 106 ) study using a crude estimate of total urinary polyphenol excretion by the Folin–Ciocalteu assay. To the best of our knowledge, this is the first study to use the three way comparison on data obtained from an RCT allowing comparison of change from baseline for individuals advised to consume a diet consistent with DG.
In conclusion, participants following advice to adhere the UK DG consumed a greater amount of total polyphenols than a control group consuming a representative UK diet. In particular, intake of individual polyphenols that are mainly sourced from fruits and vegetables, nuts, seeds and soya products was increased in the DG group. The results of this study advance the field of polyphenol research as they demonstrate that a diet consistent with DG is also moderately richer in polyphenols compared with a typical UK dietary pattern, despite the relatively high baseline intake derived from commonly consumed beverages such as tea and coffee. In addition to increased intake of dietary fibre and certain micronutrients, replacement of SFA with unsaturated fatty acids, and lower salt and free sugars, following DG will also increase polyphenol intake, which may contribute to the overall reduction in risk factors for cardiometabolic diseases.
Acknowledgements
The authors thank Anna Caldwell (CEMS-Waterloo, King’s College London) for her assistance with sample analysis, and Ana Rodriguez-Mateos (Department of Nutritional Sciences, King’s College London) for reading and commenting on the initial manuscript draft.
The CRESSIDA study received funding from the UK Food Standards Agency and Department of Health and from the National Institute for Health Research (NIHR) Clinical Research Facility at Guy’s and St Thomas’ NHS Foundation Trust and NIHR Biomedical Research Centre based at Guy’s and St Thomas’ NHS Foundation Trust and King’s College London. M. L. C.-A. received PhD studentship funding from the Mexican Secretariat of Public Education.
T. A. B. S. was principal investigator of the CRESSIDA study. T. A. B. S. and W. L. H. devised the CRESSIDA study, D. P. R. and J. D. recruited subjects into the study and supported the dietary intervention in the CRESSIDA study. M. L. C.-A. and W. L. H. conceived the idea for secondary analysis of polyphenols intake data, analysed data and performed statistical analysis. M. L. C.-A. wrote drafts of the manuscripts, which were edited by W. L. H. The manuscript was read, commented on and approved by all authors.
W. L. H. has collaborated with Lucozade Ribena Suntory and DIANA Food SAS. T. A. B. S., D. P. R., J. D. and M. L. C.-A. reported no conflicts of interest.


