


Crossref Citations
This article has been cited by the following publications. This list is generated based on data provided by Crossref.
Aguado, Brian A.
and
Porras, Ana M.
2020.
Building a virtual community to support and celebrate the success of Latinx scientists.
Nature Reviews Materials,
Vol. 5,
Issue. 12,
p.
862.
Graeve, Olivia A.
Arróyave García de la Cadena, Jorge A.
and
Martínez López, Aranza S.
2022.
Building Compassion and Human Bridges through Research Collaborations.
ACS Omega,
Vol. 7,
Issue. 2,
p.
1542.
Muñoz, José A.
and
Villanueva, Idalis
2022.
Latino STEM Scholars, Barriers, and Mental Health: A Review of the Literature.
Journal of Hispanic Higher Education,
Vol. 21,
Issue. 1,
p.
3.
Barbu, Sophie J.
McDonald, Karen
Brazil-Cruz, Lisceth
Sullivan, Lisa
and
Bisson, Linda F.
2022.
Uprooting Bias in the Academy.
p.
47.
Godwin, Lizandra
2023.
WIP: Research Identity among First-Year Engineering Latina Students at a Research- Intensive Hispanic Serving Institution.
Cosgriff-Hernandez, Elizabeth M.
Aguado, Brian A.
Akpa, Belinda
Fleming, Gabriella Coloyan
Moore, Erika
Porras, Ana Maria
Boyle, Patrick M.
Chan, Deva D.
Chesler, Naomi
Christman, Karen L.
Desai, Tejal A.
Harley, Brendan A. C.
Hudalla, Gregory A.
Killian, Megan L.
Maisel, Katharina
Maitland, Kristen C.
Peyton, Shelly R.
Pruitt, Beth L.
Stabenfeldt, Sarah E.
Stevens, Kelly R.
and
Bowden, Audrey K.
2023.
Equitable hiring strategies towards a diversified faculty.
Nature Biomedical Engineering,
Vol. 7,
Issue. 8,
p.
961.
Jantz, Maria K.
Mak, Jennifer
Dalrymple, Ashley N.
Farooqui, Juhi
Grigsby, Erinn M.
Herrera, Angelica J.
Pirondini, Elvira
and
Collinger, Jennifer L.
2023.
Lifting as we climb: Experiences and recommendations from women in neural engineering.
Frontiers in Neuroscience,
Vol. 17,
Issue. ,
Villanueva Alarcón, Idalis
and
Muñoz, José A.
2024.
Exploring the Hidden Realities of Latinx/é Contingent Faculty in STEM.
Journal of Latinos and Education,
Vol. 23,
Issue. 2,
p.
905.
Engineering research is the catalyst of discovery that fuels the development of innovative products and services, in turn driving economic growth and global competitiveness. This innovation thrives on the capacities, talents, and experiences of people from various diverse backgrounds; however, engineering itself has a diversity problem on many fronts.
One critical concern is the low participation of ethnic minorities in engineering research, an example being US-born Latinos. Latinos are defined as individuals of Mexican, South American (including Brazil), Central American, and Caribbean origin residing in the United States. By contrast, the term Hispanic, as defined by the US government, refers to Spanish-speaking persons living in the United States, especially of Latin American origin, but also including persons from Spain and other Spanish-speaking countries.
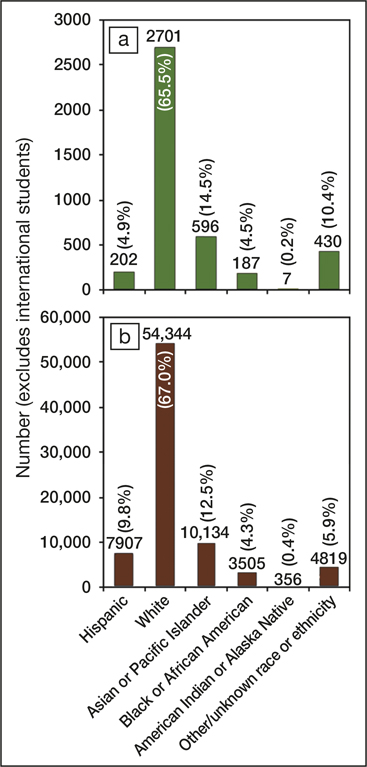
Statistics show that the participation of US Latinos in engineering fields, including materials science and engineering, is dismal. The latest US census data (from 2016) indicate that 17.8% of the total US population is Hispanic or Latino.1 However, Hispanics only represent 4.9% of engineering doctoral graduates and 9.8% of engineering bachelor’s graduates, according to the 2016 S&T (Science & Technology) Indicators published by the National Science Foundation (see Figure 1).2
Figure 1. Number and percentage of US-born (a) doctoral graduates and (b) bachelor’s graduates in engineering for 2013.2
Additional data reveal that Hispanics hold approximately 3.6% of faculty appointments in engineering.3 However, scant attention is given to Latino faculty members’ birth country and other demographic characteristics. Thus, we decided to investigate characteristics, including academic rank, gender, and country of origin, of Latino engineering faculty at universities within the United States.
While the total number of Latino engineering faculty as of 2016 is close to 600, only 48 of the total number were born in the United States.
The root of the problem is in the extreme lack of pipeline of US-born Latinos into doctoral programs and academic careers.Reference Chapa and De La Rosa4–Reference Sólorzano, Villalpando and Oseguera7 Involving Latinos in the production of scientific and engineering leadership roles within US universities should be considered a national priority, as we should cultivate reliable domestic talent. The good news is that there are opportunities at research-intensive universities to work closely with the community, government, and industry to develop scalar institutional capacities in this area. Ignoring this issue will result in a continued lack of role models for US-born Latino youth, who look for successful examples in academia among people who share their heritage.
For our analysis, we collected information on Latino engineering faculty from all universities that have a College of Engineering or School of Engineering listed by the US News & World Report National Universities Ranking. This analysis includes all universities in the 50 states, excluding faculty residing and working in Puerto Rico.
By visiting the engineering department websites of each college, we began the assessment of the number of Latino faculty listed based on surnames. We also gathered the names of Latino faculty attending the annual meetings of the Society of Hispanic Professional Engineers (SHPE) over a 10-year period. Country of origin was determined based on the university from which each faculty member obtained his or her undergraduate degree. We made significant additions and corrections to our list based on referrals from Latino faculty that have participated in or currently participate in SHPE activities.
The list does not include faculty in the natural sciences or life sciences, even if their research areas are within the realm of engineering. We only looked at tenure or tenure-track faculty, and excluded lecturers, research professors, and adjunct professors, although these faculty groups appear to be overutilized among the ranks of the professoriateReference Verdugo8 and, thus, consideration of their numbers is of importance in developing a complete picture of the professoriate in engineering.
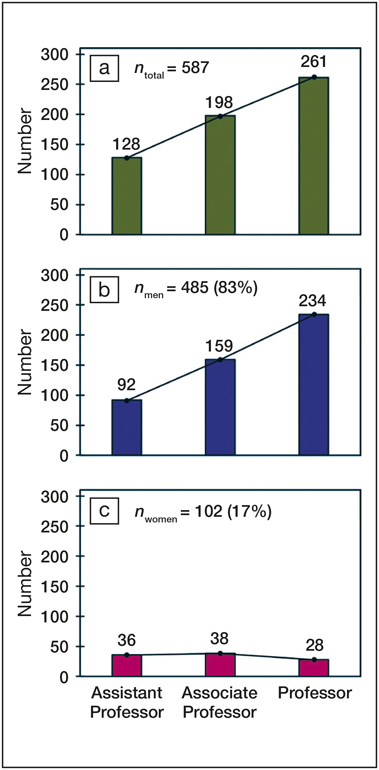
As of 2016, there were 587 Latino faculty members in the United States, of which 485 (83%) were men and 102 (17%) were women (see Figure 2). The number of women shows a distressing trend in that they stay more or less constant from Assistant (n = 36) to Associate (n = 38), but then fall to 28 at the Full Professor level. These results are in agreement with numbers in the S&T Indicators,2 where the percentage of women faculty is significantly higher at the Assistant and Associate Professor levels, compared to the rank of Full Professor.
Figure 2. (a) Total number of Latino engineering tenure-track and tenured faculty in the 50 US states by rank and the corresponding numbers of (b) men and (c) women. (Faculty in Puerto Rico are not included.)
A plausible explanation is that the number of women in engineering faculty has been traditionally low, and even if more women faculty are currently being hired, insufficient time has passed for them to reach Full Professor status. As the number of female Assistant and Associate Professors continues to increase, the rank of female Full Professors could someday follow the trend of increasing numbers found for men. Studies have also shown that poor or nonexistent family-friendly policies in academia and lack of mentorship can result in the loss of women faculty at higher levels.Reference Salgado and Carozza9–Reference Ortega-Liston and Rodriguez Soto11 This drop in the number of women faculty is an issue that merits further consideration.
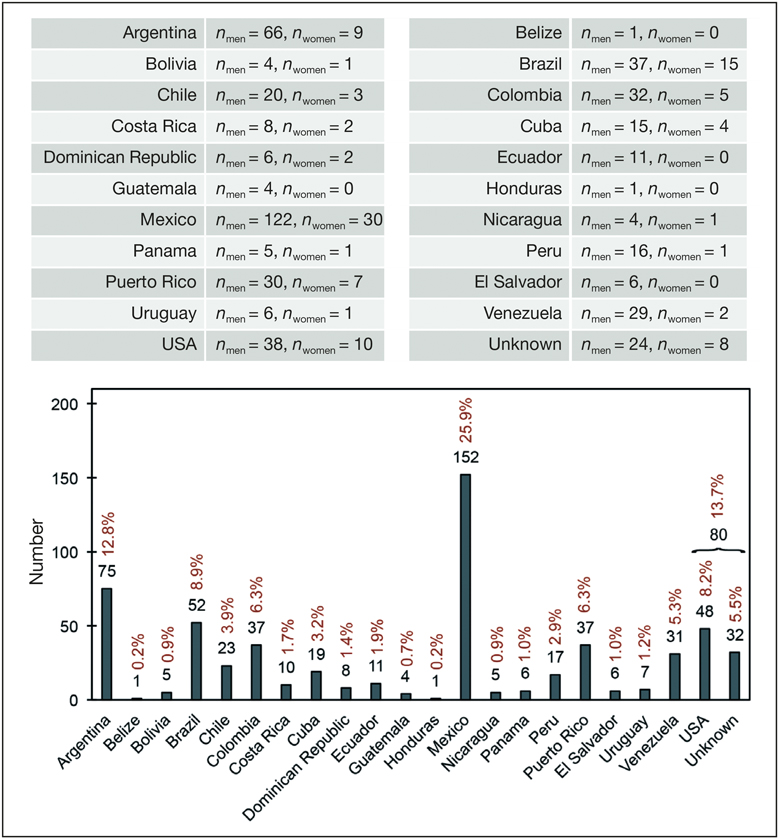
Figure 3 illustrates that the greatest representation of Latino engineering faculty hail from Mexico—152 individuals representing 25.9% of total faculty. This finding may not be surprising considering the geographic proximity of the United States and Mexico, as well as the significant economic ties between the two countries. In addition, among the 55.3 million Hispanics in the United States, as of 2014, nearly two-thirds, or about 36 million, self-identify as being of Mexican origin, according to the Pew Research Center.12 Thus, Mexico is having an immense impact in the education of Latino engineering students in the United States via the highly educated Mexican diaspora that occupies the ranks of Latino engineering professors in the United States.
Figure 3. Latino engineering faculty by country of origin.
Argentina and Brazil are second and third, respectively, with 75 and 52 faculty members. There are 37 engineering faculty from Puerto Rico across the 50 US states. As the island is decidedly Latin American in nature, Puerto Ricans serving as engineering faculty within the states also serve as role models for Latino engineering students.
In total, there are only 48 (8.2%) US-born Latino faculty members, a number that is extraordinarily overshadowed by the 507 (86.4%) Latino engineering faculty who are foreign-born. By comparison, 49% of faculty (of all ethnicities) in science and engineering across the United States are foreign-born.2 (We do not have country of origin information for 32 faculty members.) All US-born Latino faculty completed their undergraduate degrees in the United States, so it is likely that they were born in one of the 50 US states (or possibly Puerto Rico). Even if we add them to the number of US-born faculty, increasing this number to 80, that makes the share 13.6%, still far below the percentage of foreign-born faculty.
Universities across the nation are currently increasing the number of Latino engineering faculty from the highly qualified Latin American diaspora in numbers far higher than the average found in science and engineering. The United States is a country of immigrants, and the strategy of hiring the most qualified people from across the globe has served this country well. However, from the statistics listed, there is a pipeline issue affecting US-born Latinos in the United States. While we should continue to hire the best talent globally, we should not forget that we must invest, educate, and train our domestic talent.
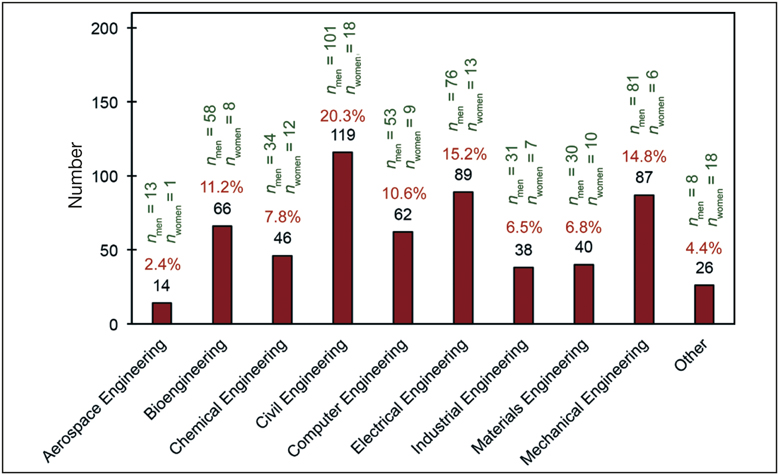
A previous analysis13 showed that 67% of bachelor’s degrees awarded in the United States belong to the big four disciplines: civil, computer, electrical, and mechanical engineering; 20% belong to aerospace, biomedical, chemical, and industrial engineering; and 10% belong to the smaller 10 disciplines of materials, agricultural, architectural, engineering management, engineering physics/engineering science, environmental, general engineering studies, mining, nuclear, and petroleum engineering.
We found similar distributions among Latino faculty (see Figure 4). Traditional departments, such as civil engineering and electrical engineering, include a majority (35.57%) of all Latino faculty. Departments dedicated to areas such as materials engineering, aerospace engineering, and industrial engineering are lagging behind at 15.7% of all Latino faculty. Other areas, including biomedical engineering, petroleum engineering, and engineering technology, represent around 4.4% of the total Latino engineering faculty.
Figure 4. Distribution of Latino faculty by engineering subdiscipline.
We propose that research-intensive universities should work closely with government (at federal, state, and local levels) and the corporate sector to develop evidence-based scalable institutional initiatives and incentives to increase the number of US-born Latinos eligible for graduate programs in engineering, including materials science and engineering. This could subsequently increase the numbers prepared to occupy faculty roles in the United States.
Acknowledgments
This work was funded with support from the National Science Foundation (Nos. 1360561, 1262095, 1138329, 1038461, and 0932173). We are grateful to Prachi Patel for support in editing the document.