


Introduction
The removal of lanthanides and actinides from the environment is of utmost importance. On the one hand, anthropogenically contaminated sites need to be remediated, thus restoring the original state of natural habitats. On the other hand, a fundamental understanding of the interactions of f-elements with naturally occurring substrates helps to evaluate their mobility in the environment and interactions with therein occurring substances and organisms (Götzke et al., Reference Götzke, Schaper, März, Kaden, Huittinen, Stumpf, Kammerlander, Brunner, Hahn, Mehnert, Kersting, Henle, Lindoy, Zanoni and Weigand2019).
A typical removal strategy is to accumulate the target substances by a substrate like a sorbent material. Thereby, “green” sorbents are preferable, i.e., nontoxic materials that can be gained energy-efficiently and without harmful reagents and by-products. Biogenic materials often fulfill these requirements better than synthetic materials (Matheickal et al., Reference Matheickal, Yu and Feltham1997; Xiao & Howard Huang, Reference Xiao and Howard Huang2009; Ansone et al., Reference Ansone, Klavins, Jankevica and Viksna2014).
A widely used filter and sorbent material is diatomite or diatomaceous earth (DE) (Wang et al., Reference Wang, Lu, Chen, Ma, Jiang and Wang2014). This material consists largely of sedimented, fossilized siliceous diatom cell walls (Kogel et al., Reference Kogel, Trivedi, Barker and Krukowski2006). Diatom cell walls, the so-called frustules, stand out from other unicellular algae due to their uniquely patterned, porous silica structure (Round et al., Reference Round, Crawford and Mann1990; Mann, Reference Mann1999). These properties render frustules attractive as sorbents from the materials science point of view. However, diatomite also contains mineral impurities, depending on the mining site. Silica in diatomite is also aged: compared to its initial state, it has lost a large amount of silanol groups (Si–OH), which were transformed into siloxane (Si–O–Si) by water elimination (Loucaides et al., Reference Loucaides, Behrends and Van Cappellen2010). SiOH groups are, however, favorable adsorption sites for positively charged ions because they partially dissociate into SiO− and H+ (Iler, Reference Iler1979).
“Fresh” diatom frustules, i.e., biosilica directly gained from living diatoms, are thus to be favored. Diatom cultivation under controlled conditions for specific applications also provides the opportunity for tailoring the cells in vivo (Gutu et al., Reference Gutu, Dong, Jiao, Rorrer, Chang, Jeffryes and Tian2005; Lang et al., Reference Lang, Del Monte, Collins, Rodriguez, Thompson, Dockery, Finn and Pandit2013; Köhler et al., Reference Köhler, Machill, Werner, Selzer, Kaskel and Brunner2017). Genetic modifications or variations of growth conditions are possible, e.g., by the addition of substances that are taken up and potentially incorporated into the biosilica. Furthermore, fresh frustules usually exhibit a higher specific surface area. Diatomite comprises only heavily silicified, massive cell walls because filigree structures dissolve faster after the removal of the organic coating following cell death (Bidle & Azam, Reference Bidle and Azam1999; Kooistra et al., Reference Kooistra, Gersonde, Medlin, Mann, Falkowski and Knoll2007). Consequently, both fresh and aged diatom biosilica are evaluated as filter or sorbent materials for f-elements (Kammerlander et al., Reference Kammerlander, Köhler, Huittinen, Bok, Steudtner, Oschatz, Vogel, Stumpf and Brunner2021). For fundamental research, fresh biosilica is also advantageous because it represents a comparably well-defined material. It thus constitutes a suitible substance for the modeling of sorptive interactions in the frame of radiotoxic remediation.
Europium(III) can be used as a convenient, nontoxic analog for chemically similar trivalent, radioactive actinides (Stumpf et al., Reference Stumpf, Curtius, Walther, Dardenne, Ufer and Fanghänel2007). To analyze the interactions of Eu(III) with its environment, a wide range of analytical methods is employed (Götzke et al., Reference Götzke, Schaper, März, Kaden, Huittinen, Stumpf, Kammerlander, Brunner, Hahn, Mehnert, Kersting, Henle, Lindoy, Zanoni and Weigand2019). For example, plant, rock, and soil contents or sorbent loadings are quantified by element analyses like ICP-AES (inductively coupled plasma atomic emission spectroscopy) (Alexandre et al., Reference Alexandre, Pereira, Mauricio and Martins-Dias2015) and MS (mass spectrometry) (Yamamoto et al., Reference Yamamoto, Takahashi and Shimizu2010). X-ray diffraction methods, which are widely applied in the case of minerals or other crystalline sorbents (Santos-Beltran et al., Reference Santos-Beltran, Paraguay-Delgado, Garcia-Alamilla, Santos-Beltran and Gallegos-Orozco2018), are unsuitable for amorphous phases like diatom biosilica. Some of the typical molecular spectroscopy methods like standard Raman spectroscopy are not sufficiently sensitive for small amounts of adsorbed analytes.
In contrast, fluorescence spectroscopy provides an extraordinary sensitivity. For the respective methods, Eu is a convenient probe due to its remarkable luminescence properties. Information about the complexation strength, the number of individual species as well as the chemical environment can be extracted from luminescence data (Binnemans, Reference Binnemans2015). In particular, TRLFS (time-resolved laser-induced fluorescence spectroscopy) is a widespread method to characterize Eu bound to various organic substances and minerals (NordÉn et al., Reference Nordén, Albinsson, Ephraim and Allard1992; Mathur et al., Reference Mathur, Thakur, Dodge, Francis and Choppin2006; Stumpf et al., Reference Stumpf, Curtius, Walther, Dardenne, Ufer and Fanghänel2007). However, standard TRLFS—like the analytical methods mentioned above—cannot determine the spatial distribution of the sorbate on the sorbent material. The recently developed μTRLFS addresses this issue. While it is a highly valuable tool for mineral studies in the context of permanent disposal sites, its laser excitation spot with a diameter of about 30 μm limits its use in the analysis of microalgae samples (Molodtsov et al., Reference Molodtsov, Schymura, Rothe, Dardenne and Schmidt2019).
The high resolution necessary to characterize micro- and nanopatterned samples can be provided by CL (cathodoluminescence) investigations in an SEM (scanning electron microscope). For example, sub-20-nm nanoparticles consisting of lanthanide-doped NaGdF4 and NaYF4 were successfully resolved by CL-SEM (Prigozhin et al., Reference Prigozhin, Maurer, Courtis, Liu, Wisser, Siefe, Tian, Chan, Song, Fischer, Aloni, Ogletree, Barnard, Joubert, Rao, Alivisatos, Macfarlane, Cohen, Cui, Dionne and Chu2019). CL spectroscopy and imaging are often used to study the band edge emission and to characterize zero-dimensional as well as extended defects in various different samples such as semiconductors, minerals, and rocks (Gaft et al., Reference Gaft, Reisfeld and Panczer2005; Coenen & Haegel, Reference Coenen and Haegel2017). For trivalent rare earth elements, the radiative transitions of the 4f-electrons can be excited by the electron beam and result in characteristic, narrow lines, which are especially useful in this context (Binnemans, Reference Binnemans2015).
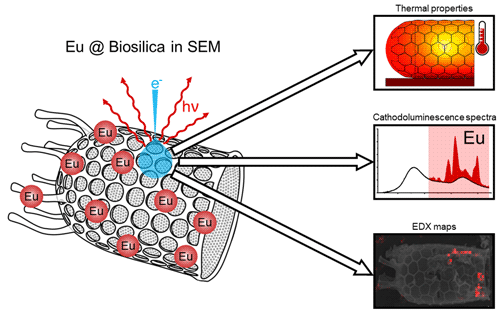
The aim of the current investigation is the analysis of the local distribution and complexation of luminescent Eu(III) loaded on diatom frustules. Therefore, imaging and spectroscopic analytical methods in an SEM are optimized and applied. The sensitive and spatially resolved CL method is complemented by EDX (energy-dispersive X-ray) spectroscopy, including elemental imaging. The EDX method exhibits a similar spatial resolution (Imeson, Reference Imeson1982), is less prone to spectral interferences compared to CL spectroscopy, and has been successfully applied for the analysis of metal-loaded plant cell walls in the past (Fritz, Reference Fritz2007). However, acquiring EDX maps of sorbates with low concentrations is very time-consuming. In addition, EDX spectroscopy provides no information about the Eu complexation. Using these complementary methods with high sensitivity and resolution, the distribution of Eu species over the frustules can be elucidated. For the evaluation of the CL spectra of the Eu-loaded biosilica, the contribution of the single components is evaluated by measurements of pure reference materials: Eu salt and biosilica without Eu.
The chosen analytical methods require the stability and durability of the samples under electron beam irradiation. Though diatoms are frequently studied by SEM and EDX investigations, stability issues are rarely evaluated. The current paper therefore addresses the energy impact and resulting thermally induced deformation of the frustules’ structure. The temperature increase was modeled by finite element calculations, taking into account results from the Monte Carlo simulation of electron scattering in the biosilica. Because thermal properties of the material had to be known for the temperature calculations, differential scanning calorimetry (DSC) was used to determine the heat capacity. Furthermore, the flash method was applied to characterize the thermal conductivity of the fresh diatom silica as well as commercially available diatomite and silica gel as reference materials. Additionally, the materials were analyzed with DTA/TG-MS (differential thermal analysis/thermogravimetry coupled with MS) to study their thermal stability and potential gaseous decomposition products.
Materials and Methods
Cultivation of the Diatoms
Diatoms were cultivated in RUMED 1301 light thermostats (Rubarth Apparate) at 21°C with a 12/12 h light (1,000 lx)/dark illumination cycle. As growth vessels, 20 L polyethylene carboys (Thermo Fisher Scientific) were used. The culture medium was sterile filtered artificial seawater according to the recipe of the North East Pacific Culture Collection (Harrison et al., Reference Harrison, Waters and Taylor1980). The strain of Stephanopyxis turris (S.t.) had been collected by the Sumper group of the Universität Regensburg (Regensburg, Germany) from the North Sea in 2004. Its identity was genetically confirmed in 2017 (Pytlik et al., Reference Pytlik, Kaden, Finger, Naumann, Wanke, Machill and Brunner2017). After inoculation, the cultures grew for about 1–2 months until the silicon concentration in the growth medium was depleted below 5 μmol/L. This was confirmed by the colorimetric molybdenum blue method according to Iler (Iler, Reference Iler1979). Consequently, cells were harvested by centrifugation using a Hereaus Megafuge with 4,000 rpm.
Cleaning and Eu Loading of the Diatom Biosilica
The brown-green, “native” cell pellets were cleaned by a treatment with a lysis buffer. The cells were suspended in 20 mL lysis buffer, a solution of 20 g/L sodium dodecyl sulfate (SDS, Merck) and 37 g/L sodium ethylene diamine tetraacetic acid (Na2EDTA, Grüssing) adjusted to pH 8. The mixture was heated to 95°C for 10 min, subsequently cooled, and centrifuged with 4,000 rpm. The supernatant was discarded. The pellet was subjected to two to six further iterations of the lysis buffer treatment until the supernatant was nearly colorless. Subsequently, the cleaned cells were washed five times with ultrapure water and freeze-dried at −55°C and 0.47 mbar in a 1-4 LSC basic device (Christ Alpha). The resulting powder was calcined in a Carbolite AAF 1100 muffle furnace at 550°C for 10 h under a static air atmosphere to remove residual organic substances from the silica.
In the course of the Eu sorption experiments, 10 mg of the biosilica was suspended in 10 mL of a solution of 10−3 mol/L Eu(III) in ultrapure water with 0.1 mol/L NaClO4 as background electrolyte. The pH was adjusted to pH 5 with HClO4 and NaOH. The suspension was shaken for 3 days and, afterward, centrifuged at 4,000 rpm. The supernatant was separated from the diatom sorbate, which was subsequently dried under air atmosphere.
Mounting of SEM Samples
Several milligrams of the dried diatom material were resuspended and transferred to a clean aluminum stub. Likewise, stubs with the procured reference material silica gel 60 (0.015–0.040 mm, Merck) were prepared. To avoid electrostatic charging, the dried samples were sputtered with gold using a Q150R sputter coater (Quorum Technologies), resulting in a 5 nm thick gold coating.
Imaging, EDX, CL, and Electron Diffraction in the SEM
Imaging, EDX, as well as CL investigations were carried out at room temperature and a pressure of about 10−6 mbar using a Zeiss Ultra55 SEM with a field emission gun. The current I B of the primary electron beam on the sample surface was measured by an internal sample current detector. An Everhart–Thornley detector and an Inlens detector were deployed for secondary electron imaging of the diatoms. The electron beam moves with a rate of about 44 mm/min (for imaging) to 1.5 ⋅ 104 mm/min (for spectra in area scan mode). This corresponds to beam dwell times of 1.4 ⋅ 10−3 and 4.0 ⋅ 10−6 s/μm, respectively.
The elemental composition was determined by the microanalysis system Quantax from Bruker AXS with an XFlash detector 4010 and the software Esprit 1.9.2. For a bulk SiO2 sample, the depth Z, at which the detectable X-ray radiation of Eu L-lines is generated by electrons at the applied acceleration voltage U B of 13 kV, is about 2 μm (cf. Supplementary material section 1). It is, thus, significantly greater than the diameter of the electron beam on the sample surface (spot size approximates to 2 nm).
During SEM imaging for stability investigations, parameters corresponding to subsequent CL measurements were chosen for the electron beam (U B = 10 kV and I B = 27.5 nA). Under these conditions, the image pixel size of 65 nm is smaller than the penetration depth R of primary electrons, which is about 1 μm (cf. Supplementary material section 1). Assuming that in a bulk sample, the penetration depth R corresponds approximately to the diameter of the excitation volume, where the CL light registered by the CL system originates, the spatial resolution of CL measurements as defined by Yacobi and Holt (Reference Yacobi and Holt1990) is low in relation to image resolution and comparable to that of EDX investigations.
The spectral CL measurements were performed with a system that consists essentially of a parabolic mirror segment, a Czerny-Turner monochromator, an on-axis mounted Peltier-cooled CCD camera S7031-1006 from Hamamatsu (back-illuminated, 1,024 × 64 pixels) for the wavelength range between 200 and 1,200 nm, and a Hamamatsu photomultiplier R3896 for the range between 200 and 900 nm. A blazed grating with 300 lines/mm and blaze wavelength at 500 nm was applied for the acquisition of the CL spectra with the operation software PSI line. The instrumental broadening of the spectral lines is 17 nm/mm by the aperture size of the monochromator.
Due to the shadowing of X-rays by the parabolic mirror segment during CL investigations, EDX and CL measurements could not be performed simultaneously on one sample. Normally, EDX analysis was carried out after the CL tests.
The crystallinity of the samples was probed by electron backscatter diffraction (EBSD), using an HKL Nordlys detector system and the Channel5 evaluation software.
Thermal Analysis
To determine the specific heat capacity, DSC measurements were conducted with a NETZSCH DSC 204 F1 Phoenix calorimeter. Sapphire specimens (thickness 0.5/1.0 mm) were used as reference materials. The investigated temperature ranges from 0 to 420°C, applying a heating rate of 10 K/min under argon atmosphere. An aluminum pan with a pierced lid was used as a sample holder for silica samples including DE (Merck) as a silica reference. Additionally, DTA/TG-MS results were obtained by a NETZSCH STA 449 F3 Jupiter analyzer in a temperature range of 26–1,050°C. These measurements were also conducted with a heating rate of 10 K/min under argon atmosphere. Samples were placed in alumina crucibles. Thermal conductivity analyses were carried out with a NETZSCH LFA 447 NanoFlash device using the flash method. A measuring cell with flash-transparent windows was applied, which was developed by Pohlmann et al. (Reference Pohlmann, Hutsch, Röntzsch, Weißgärber and Kieback2013). The thermal conductivity was calculated by the multiplication of thermal diffusivity, specific heat and mass density.
Monte Carlo Simulations and Finite Element Method
To determine the spatial distribution of the heat energy impact of primary electrons into bulk silica material, the free Monte Carlo simulation software CASINO Version 2.4.8.1 was used (Drouin et al., Reference Drouin, Couture, Joly, Tastet, Aimez and Gauvin2007; Demers et al., Reference Demers, Poirier-Demers, Couture, Joly, Guilmain, de Jonge and Drouin2011). Based on these results, the temperature distribution in the diatom frustule structure was calculated from a three-dimensional non-linear heat conduction equation (cf. Supplementary material section 2, Supplementary eq. 1). This equation was numerically solved by the finite element method (FEM) with the Software Comsol Multiphysics ® Version 5.6 utilizing the Heat Transfer Module (Comsol, Reference Comsol2020). A detailed description of the simulation procedure can be found in a former publication (Saager, Reference Saager2016). For the diatom sample and its cell wall, which has a honeycomb-like structure comprised of chamber-like pores (shaped like prisms with a hexagonal base), the following parameters were used: mass density of 2.36 g/cm³, sieve plate (base of the chamber-like pore) thickness of 60 nm, chamber wall (perpendicular to the sieve plate) height of 0.5 μm and thickness of 80 nm, and hexagon side length of 2 μm.
Results and Discussion
Stability Issues in SEM Imaging of Diatom Frustules
It is known from the literature (Stevens-Kalceff, Reference Stevens-Kalceff2013; Bhowmick et al., Reference Bhowmick, Stauffer, Major, Warren and Syed Asif2015) that the properties of silica can be modified by the electron beam in an SEM. To assess the stability of silicified microorganisms—especially diatom biosilica—under the exposure of the scanning electron beam, morphological changes were investigated here.
Figure 1a shows a representative valve from the species S.t. The entire diatom frustule consists of two valves connected to each other by girdle bands. When stabilizing organic constituents are removed from the biosilica during the extraction and cleaning process, the different parts of the frustule are usually disconnected. The depicted valve has kept its initial half-shell shape through cell lysis and calcination.

Fig. 1. SEM image of a typical valve extracted from the diatom species S.t. at the beginning (a) and after 150 min of electron irradiation (b).
As illustrated in Figure 1b, the morphology of the cell wall changes considerably after 150 min of electron irradiation time. All observed frustules show a similar behavior, regardless of the presence or the absence of Eu(III). Probably, the frustule shape changes due to the heat energy input caused by the inelastic scattering of the primary electrons. The resulting temperature gradients during irradiation could induce mechanical stress, structure instability, and finally frustule deformation. Furthermore, a charging effect may be conceivable in principal: the primary electron beam could induce a locally accumulating charge, leading to increasing mechanical stress due to electrostatic forces. However, in contrast to conducted SEM analyses of uncoated frustules, no signs of irradiation-induced electrical charging, like charge contrast or image drift, were observed in the present samples. Thus, significant effects due to charging are improbable.
Deformations might also be assisted by a mass loss at higher temperatures. For the evaluation of these influences and possible chemical transformations, the local temperature increase in the diatom frustule has to be assessed. To this end, several thermal properties must be determined.
Thermal Analysis
Values of the specific heat capacity and thermal diffusivity of the silica materials were determined via simultaneous thermal analysis (STA) in DTA/TG-MS mode and the flash method, respectively. Thus, the thermal stability of the biosilica was evaluated and gas molecules formed during thermal decomposition could be detected.
In the present study, calcined diatom frustules were used for Eu sorption experiments. The calcination is part of the sample pretreatment and is crucial for thermal stability. It reduces the mass of biosilica by about 40%, which is in accordance with other studies reporting a mass loss of 20% (Meradi et al., Reference Meradi, Atoui, Bahloul, Labiod and Ismail2016) to 50% (Jiang et al., Reference Jiang, Luo, Liu, Deng, Jing, Bai and Li2014) for the calcination of cultivated and chemically pretreated diatom cells. For untreated diatomite, lower losses of about 10% are reported (Fuya et al., Reference Fuya, Huifen, Huang, Guoxi, Deqiang and Hongping1995; Nowak et al., Reference Nowak, Sprynskyy, Brzozowska and Lisowska-Oleksiak2019).
In Figure 2, TG and DTA curves as well as corresponding MS signals from gaseous products that escape during heating from S.t. biosilica are depicted. At temperatures below 40°C, flushing the porous samples with argon can lead to buoyancy effects, resulting in a perceived mass loss. At temperatures above 60°C, three effects can be distinguished. Beginning from 100 to 300°C, a smooth exothermic effect can be observed in the DTA curves with the simultaneous release of fragments of N2 (m/z 28) and O2 (m/z 32). This signal is probably due to the desorption of atmospheric air. A strong exothermic effect occurs at 400 to 700°C. This coincides with a sharp release of fragments of N2 (m/z 28) and O2 (m/z 32) at about 520°C. Possible fragments of CO2 (m/z 44) could be surmised due to the slightly elevated baseline in the region from 400 to 650°C. The signal-to-noise ratio suggests that the potential CO2 release is negligible. Additionally, fragments of SO (m/z 48) and SO2 (m/z 64) can be identified between 500 and 700°C. Above 850–900°C, the TG signal indicates the onset of a mass loss caused by an increasing release of SO (m/z 48) and SO2 (m/z 64) fragments. These signals can be attributed to remnants of organic matter, mainly sulfate esters of saccharides (Tesson et al., Reference Tesson, Genet, Fernandez, Degand, Rouxhet and Martin-Jézéquel2009), and residues of the SDS treatment. At a temperature near the maximum of 1,000°C, another onset of N2/O2 release can be observed in the graphs. Such high temperatures over 925°C can damage the internal pore structure and, thus, release trapped air (König et al., Reference König, Lopez-Gil, Cimavilla-Roman, Rodriguez-Perez, Petersen, Østergaard, Iversen, Yue and Spreitzer2020).

Fig. 2. Mass (TG), DTA, and MS curves for S.t. biosilica. MS results of m/z 18 (H2O), 28 and 32 (N2 and O2; air), 44 (CO2), and 48 as well as 64 (SO and SO2) during thermal analysis.
No significant water signals due to pore water removal or condensation of the surficial silanol groups to siloxanes (Meradi et al., Reference Meradi, Atoui, Bahloul, Labiod and Ismail2016) can be observed in both DTA/TG and MS graphs. To a certain degree, siloxane groups could have already formed during the thermal pretreatment of the biosilica at 550°C. This temperature was chosen to remove organic material while retaining some isolated silanol groups, as was shown in former studies (Nawrocki, Reference Nawrocki1997; Yuan et al., Reference Yuan, He, Wu, Wang and Chen2004), and for reasons of comparability to preceding works (Machill et al., Reference Machill, Köhler, Ueberlein, Hedrich, Kunaschk, Paasch, Schulze and Brunner2013; Köhler et al., Reference Köhler, Machill, Werner, Selzer, Kaskel and Brunner2017). While calcination conditions may vary significantly for different types of algae (Liu, Reference Liu2019), these results show that this pretreatment sufficiently removes almost all organic material and provides a thermally stable biogenic silica material for further application as a sorbent.
Apart from the perceived mass loss at temperatures below 100°C, the low total mass loss of about 1% suggests that calcined S.t. biosilica is relatively stable under conditions up to ca. 900°C in an inert atmosphere.
In Figure 3, the temperature dependency of the specific heat capacity cp of several thermally pretreated silica materials are compared. The percentage of non-siliceous impurities in the frustules of S.t. lies in between the pure, artificial silica gel and the biogenic DE, which contains various mineral impurities. The cp values of S.t. show the first maximum of about 1.2 J/g K at around 90°C, similar to silica gel. The cp maximum of DE at about 160°C is only slightly indicated in the S.t. graphs. This is probably due to the release of air as seen in Figure 2, which may also cause the local, low-intensity maximum at ca. 250°C.

Fig. 3. Temperature dependency of the specific heat capacity cp and of the thermal conductivity λ of several silica materials.
The supporting points for a linear interpolation of the cp-T curve in the subsequent simulation of the temperature distribution in the sample due to electron irradiation are marked by black squares in Figure 3. An experimental value for the thermal conductivity λ of the diatomaceous material is only available for room temperature. For the temperature simulation explained in the next section, it was thus assumed that biosilica shows the same increase in thermal conductivity per temperature increase as spectrosil (cf. Supplementary Fig. 1). For this material, detailed data are provided in the literature (Heraeus, 2019).
Modeling of the Temperature Increase in the Frustule under the Electron Beam
With the material data from the thermal analyses and with the results from the Monte Carlo simulation (cf. Supplementary Fig. 2), the temperature distribution in a diatom valve was modeled by FEM calculations for an idle electron beam with U B = 10 kV and I B = 27.5 nA. The resulting temperature distribution is shown in Figure 4. Thereby, the filigree diatom structure is taken into account. The honeycomb-like pore structure plays a significant role, as shown by comparison to simulations with a bulk silica material. The limited possible interaction volume decreases the heat power input through the electron beam. In contrast, the maximum temperature can increase, as the small volume impedes the heat conduction.

Fig. 4. Equilibrium temperature distribution in a diatom frustule (hollow cylinder with honeycomb-like texture) due to excitation by an idle focused electron beam (white triangle). Temperatures are color-coded as indicated. In order to illustrate the geometry of the diatom, a scaling in x-, y- and z-coordinate direction is provided.
In the case of a point-like excitation (equivalent to an infinite irradiation time, whereby thermal equilibrium is reached after some milliseconds) as shown in Figure 4, a maximum local temperature increase of about 300 K is calculated in a frustule region of approximately 1 μm in diameter. At a distance of about 3.5 μm from the beam spot, the temperature is about 150 K lower. More distant parts of the frustule heat up by about 50 K, while the contact area of the silica with the aluminum sample carrier remains almost at room temperature. The resulting temperature gradient should cause greater mechanical stress to the structure compared to a uniform warming as undergone during the calcination process. At the low scanning speed for imaging, the temperature equilibrium should also be achieved. In contrast, at the higher scanning speed during area scan for CL measurements, the temperature of the diatoms is only increased by about 100 K.
After the prolonged irradiation of the frustules by the electron beam, the EBSD technique was applied to check whether crystallization of the structure was induced by the heat energy input. Since no Kikuchi pattern could be observed, it is concluded that the biosilica retains its amorphous structure. This is in accordance with former studies reporting crystallization at temperatures of 800°C (Arasuna & Okuno, Reference Arasuna and Okuno2018).
EDX Studies of the Eu(III) Distribution
To determine the localization of sorbed Eu(III) on the diatom, elemental distribution images were taken on a typical diatom valve using the Esprit software. The secondary electron image of the diatom (Fig. 5a) is superimposed with the elemental composition map (Fig. 5b).

Fig. 5. Diatom valve (S.t.) with selected object regions for the element mapping and spectral EDX investigations (a). Element mapping with superimposition of the secondary electron image and the local element composition for Si, O, and Eu from EDX mapping (b). The Eu L-signal tone was enhanced compared to the Si and O signal for better visibility.
To excite the characteristic Eu L-lines at about 6 keV photon energies with high probability, element mapping was performed at an acceleration voltage of 13 keV in object region 1 (area scan). With an acquisition time of several hours, the EDX element mappings are time-consuming. As is evident from the element map, Eu is heterogeneously distributed. While high amounts are present at frustule fragments or as Eu-containing aggregates, no significant Eu signal was detected on the regularly structured frustule surface, where the Eu signal intensity does not exceed the noise.
These results of the element mapping are confirmed by the X-ray spectra shown in Figure 6. A spectrum resulting from an area scan over the entire valve (object 1) is compared to spectra with point-like excitation on the honeycomb structure of the cell wall (object 2) and on a frustule fragment/aggregate (object 3).

Fig. 6. EDX spectra of objects 1 (area scan), 2, and 3 (point-like excitation) shown in Figure 5a; spectra are shifted by 0.05 cps/eV relative to each other for better distinction. Theoretically expected Eu lines are marked by red lines with intensities according to their probability.
The X-ray spectra show no significant Eu signals for objects 1 (area scan) and 2, but a clear Eu L-signal in the spectrum of object 3. This also corresponds to the results of an elemental line scan for Eu over the entire diatom through object 3 with the maximum intensity of the Eu L-line in the vicinity of object 3 clearly beyond the background noise (cf. Supplementary Fig. 3).
Detailed values of the local Eu concentrations are intentionally not specified because the complex morphology of the sample and the low amount or thickness of the analyte render quantitative values imprecise.
CL Studies of the Eu(III) Distribution
The Eu(III)-loaded diatom sorbent was studied by CL spectroscopy. To reliably separate the spectral components of the sorbate, luminescence spectra of commercial Eu(III) salt and pure biosilica were acquired, too. Crystalline europium(III) chloride (EuCl3 ⋅ 6H2O) was chosen as a reference material for Eu(III). Figure 7 shows the resulting CL spectrum of Eu(III) without diatom sorbent. Here, the instrumental broadening function is negligible.

Fig. 7. CL spectrum of EuCl3.
The observed spectral lines correspond to the electronic transitions in Eu(III) that can be stimulated by laser excitation (Mathur et al., Reference Mathur, Thakur, Dodge, Francis and Choppin2006). The hypersensitive electrical dipole transition 5D0–7F2 shows the highest intensity, which correlates with the local symmetry of the Eu(III) ion and the nature of the ligands. In contrast, the intensity of the magnetic dipole transition 5D0–7F1 is largely independent of the chemical environment. Its intensity in the depicted spectrum is about one-fourth of the intensity of the strongest peak. The intensity of the induced electrical dipole transition 5D0–7F4, also depending on symmetry and chemical composition, is 1.5 times larger than that of the 5D0–7F1 transition. As expected, the intensities of the forbidden transitions 5D0–7F0 and 5D0–7F3 are very low.
In contrast to the intense, relatively narrow spectral lines of Eu(III), CL spectroscopy on amorphous silica yields broad emission bands of low intensity (Fig. 8). These broad signals result from different native point defect centers in the tetrahedral SiO2 structure caused by inelastic electron scattering in radiolytic processes (Vigouroux et al., Reference Vigouroux, Duraud, Le Moel, Le Gressus and Griscom1985) and the following radiative defect recombination. To gather information about the mean and the local luminescence of the biosilica, spectra were recorded during the scanning of the focused electron beam over the entire diatom with a cycle time of 122 ms/frame (cf. Supplementary Fig. 4) and point-like excitation on the frustule (Fig. 8). The shape of the CL spectra depends only slightly on the excitation mode. However, higher intensities are obtained with point-like excitation.

Fig. 8. Exposure time dependency of the CL spectra from a diatom without Eu loading due to point-like excitation on the frustule (red cross in the insert).
Figure 8 and Supplementary Figure 4 depict that CL spectra depend on the duration of the electron irradiation. The CL spectra were measured immediately at the beginning as well as after 1 and 2 h of exposure time for both excitation modes. The intensity distribution of the emission spectra changes with the duration of the electron irradiation. The width and position of the broad emission bands do apparently not change during the observed exposition time, but the total intensity is rising. A similar result was found for anhydrous fused quartz by Stevens-Kalceff (Reference Stevens-Kalceff2013).
Fitting the detected CL spectra by Gaussian-like functions in an eV scale, the two intense peaks and a third, low-intensity signal in-between (at ca. 560 nm; 2.2 eV) must be considered. In photoluminescence investigations of amorphous α-SiO2 (Nishikawa et al., Reference Nishikawa, Shiroyama, Nakamura, Ohki, Nagasawa and Hama1992; Fitting et al., Reference Fitting, Salh and Kourkoutis2007), the spectral component at ca. 650 nm (1.9 eV) was assigned to non-bridging oxygen hole centers. The component at ca. 560 nm (2.2 eV) is due to the radiative recombination of self-trapped excitons. The signal at 2.7 eV (ca. 460 nm) may originate from oxygen-deficient centers. In the observed range of visible light, the CL spectra obtained from amorphous biosilica closely correspond to the results on pure, synthetic SiO2 polymorphs. Thus, the emission spectra of both synthetic silica and diatom biosilica are probably caused by similar mechanisms. The increase of the CL intensity with the exposure time as well as for point-like excitation indicates an increasing generation and recombination rate of the produced point defects, which can be thermally assisted.
CL spectra of the Eu-loaded biosilica for different excitation modes are compared in Figure 9 (for time dependency, see Supplementary Fig. 5). As mentioned above, the CL measurements were performed prior to the EDX investigations to minimize the shape change of the frustules increasing with irradiation duration. Apparently, the CL spectra exhibit an additive superposition of the broad bands of the amorphous biosilica and the spectral lines of Eu(III). To eliminate the influence of the irradiation time on the spectra and to illustrate the different local magnitudes of the Eu(III) signal, the CL intensity in Figure 9 was normalized to the intensity of the peak at 460 nm stemming only from the biosilica. The radiative electronic transitions in Eu(III) are clearly visible even in the spectra recorded with an electron beam scanning over the entire surface of the diatom valve. This is a remarkable observation because EDX was not able to detect Eu in this excitation mode. Obviously, CL provides a higher sensitivity and is thus better suited than EDX for studying the Eu distribution. With point-like excitation on the frustule, the spectral lines of the Eu(III) ion are more pronounced. As expected, Eu(III) bands with the highest intensities are observed after excitation on frustule fragments and/or Eu aggregates like object 3.

Fig. 9. CL spectra from the Eu diatom sorbate at the beginning of electron irradiation and normalized to the intensity of the peak at 460 nm: excitation on the whole valve (area scan) in violet (window in the insert), point-like excitation on the honeycomb structure in green (cross in the insert), and point-like excitation on the frustule fragment/precipitate in blue (cross in the insert).
In the full spectrum, lines assigned to the electronic transitions 5D0–7F1, 5D0–7F2, and 5D0–7F4 are particularly prominent. The forbidden transition 5D0–7F3 is also apparent. To measure the low-intensity CL emitted by the less luminescent biosilica and by the low proportion of Eu on the frustule surface, the slits of the monochromator system had to be opened more widely. Therefore, the instrumental broadening of about 9 nm is no longer negligible compared to the physical width of the Eu(III) lines. Thus, details of the shape of spectral lines cannot be determined in CL spectra from the regular frustule.
Remarkably, the intensity ratio of the transitions to 7F4 and 7F1 is again about 1.5 for point-like excitation on the sorbate (Fig. 9), as is the case during the EuCl3 measurements. This ratio does not change with the irradiation time. Contrarily, the intensity ratio of the transitions to 7F2 and 7F1 is about 4 in the beginning and increases up to a factor of 8 after 2 h of irradiation with electrons. For details, see Supplementary Figure 5.
The component of the highest intensity among the Eu spectra shown in Figure 9 resembles the spectrum of EuCl3. In particular, the forbidden transitions to 7F0 and 7F3 occur and the spectral line to 7F4 is asymmetric. That means, object 3 in Figure 5a is likely an Eu-containing precipitate.
Conclusions
The amorphous structure and chemical composition of diatom biosilica are proven to be sufficiently stable for the performed measurements in the SEM, which can last for several hours. However, some shape changes of the frustule may occur. Simulations of the temperature distribution within and around the interaction volume of the primary electrons in biosilica suggest that the observed deformations of diatom valves under electron irradiation are probably the effect of thermally driven stress gradients. The energy input of the electron beam may locally heat the biosilica to approximately 300°C. At this temperature, the modification of the frustule shape should neither be caused by mass loss nor by transformation from the amorphous to the crystalline phase of SiO2 according to the DTA/TG-MS and EBSD investigations.
For the verification of Eu by EDX analysis, the use of the characteristic L-lines of Eu is advantageous, which are not overlaid by the X-ray lines originating from the biosilica. Because a significant Eu signal can only be observed in sample regions with increased Eu concentrations, e.g. in small fragments of diatoms or Eu aggregates/precipitates, EDX investigations are not appropriate to prove the Eu sorption on the overall surface of the diatoms.
As expected, electron energies of 10 keV can be used in the SEM to excite both the radiative transitions of the f-electrons in Eu(III) as well as the broad emission bands in biosilica, which can be assigned to known radiative recombination processes. However, the novel results of CL investigations on Eu-loaded biosilica show characteristic Eu(III) spectral lines overlapping with the biosilica CL spectrum. Remarkably, the CL spectral lines of Eu(III) also appear very prominent in frustule regions where EDX spectra do not exhibit significant Eu signals. On the one hand, this demonstrates the higher sensitivity of the CL method for Eu detection. On the other hand, an Eu(III) distribution on the whole surface of the diatom frustules can be determined. Unfortunately, monochromatic CL images are not suitable to visualize the local distribution of Eu(III) on the diatoms due to the additive superposition of the luminescence peaks in the red range of visible light from diatoms and Eu(III).
In future experiments, time-resolved CL measurements could provide further information on the ligand environment of Eu(III) at the biosilica materials. Due to the different excitation processes, deviations from time-resolved photoluminescence signals should become apparent.
Supplementary material
To view supplementary material for this article, please visit https://doi.org/10.1017/S1431927621012745.
Acknowledgments
Financial support from the German BMBF (Federal Ministry of Education and Research) within the FENABIUM project (02NUK046A) is gratefully acknowledged. Special thanks are due to Andrea Brünner and Mai Lê Anh for assistance in sample preparation for SEM and thermal analyses (both Chair of Inorganic Chemistry II, TU Dresden).


 Open access