


There is debate about genetic sources of variation in individual lifespan (age at death). Until recently, estimates of heritability were mostly in the range 15%–30% (summarized in Table 1 of Murabito et al., Reference Murabito, Yuan and Lunetta2012; see also Shor et al., Reference Shor, Kalka, Geiger, Erlich and Weissbrod2019), but significant familial nongenetic effects and assortative mating may have led to inflated estimates of heritability (Ruby et al., Reference Ruby, Wright, Rand, Kermany, Noto, Curtis, Varner, Garrigan, Slinkov, Dorfman, Granka, Byrnes, Myres and Ball2018). Genome-wide association studies (GWAS) have identified a number of significant loci for lifespan or related phenotypes (Deelen et al., Reference Deelen, Evans, Arking, Tesi, Nygaard, Liu, Wojczynski, Biggs, van der Spek, Atzmon, Ware, Sarnowski, Smith, Seppälä, Cordell, Dose, Amin, Arnold, Ayers and Murabito2019; Deelen et al., Reference Deelen, van den Akker, Trompet, van Heemst, Mooijaart, Slagboom and Beekman2016; Joshi et al., Reference Joshi, Pirastu, Kentistou, Fischer, Hofer, Schraut, Clark, Nutile, Barnes, Timmers, Shen, Gandin, McDaid, Hansen, Gordon, Giulianini, Boutin, Abdellaoui, Zhao and Wilson2017; Timmers et al., Reference Timmers, Wilson, Joshi and Deelen2020; Timmers et al., Reference Timmers, Mounier, Lall, Fischer, Ning, Feng, Bretherick, Clark, Shen, Esko, Kutalik, Wilson and Joshi2019; Wright et al., Reference Wright, Rand, Kermany, Noto, Curtis, Garrigan, Slinkov, Dorfman, Granka, Byrnes, Myres, Ball and Ruby2019; Zenin et al., Reference Zenin, Tsepilov, Sharapov, Getmantsev, Menshikov, Fedichev and Aulchenko2019), and the challenge is to expand the number of substantiated loci to improve our understanding of the pathways that are associated with variation in lifespan.
Table 1. Betas with robust standard errors and p values for association of maternal and paternal survival with offspring’s (age- and age-squared) and sex-adjusted biomarker results. Beta coefficients are estimated per 1 standard deviation difference in the offspring’s age- and sex-adjusted test result; hazard ratios per 1 standard deviation difference can be calculated as exp(beta). There are 20 independent variables, and p values are not adjusted for multiple testing
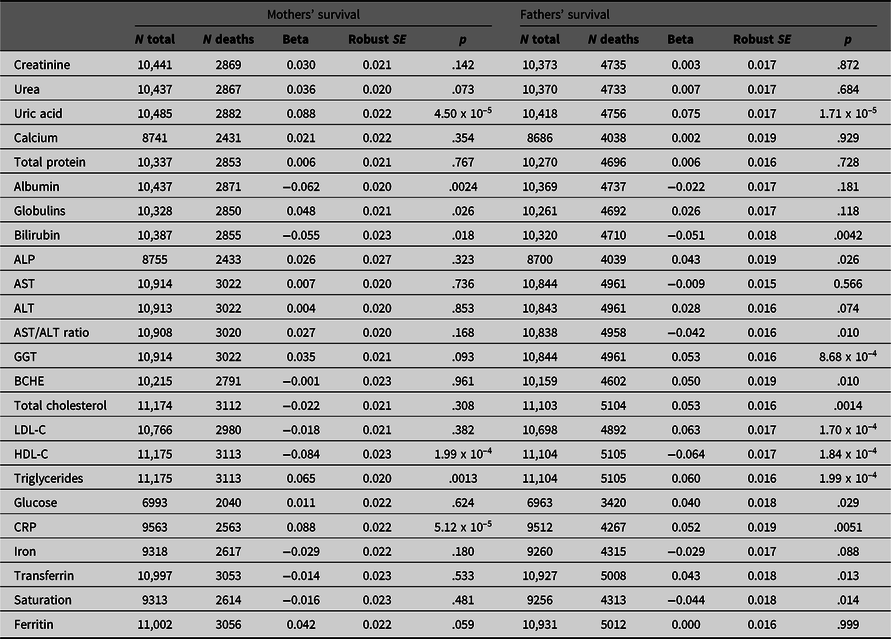
Note: ALP, Alkaline phosphatase; AST, Aspartate aminotransferase; BCHE, Butyrylcholinesterase; HDL-C, High-density lipoprotein cholesterol; LDL-C, Low-density lipoprotein cholesterol; CRP, C-reactive protein.
However, GWAS for lifespan are subject to a number of specific difficulties. Lifespan is unknown until death occurs and in practice it will then most likely be too late to collect optimal biological samples and covariate information. Ideally, the design would include recruitment of a cohort at an age before natural mortality is common and follow-up until death, but this may take 50 years and is generally impractical. Survival analysis can give results after a shorter follow-up, although this may introduce bias towards the detection of causes of earlier death. For these reasons, other approaches have been used.
One alternative has been to use the information on the survival and age at death of the parents of genotyped people (Joshi et al., Reference Joshi, Pirastu, Kentistou, Fischer, Hofer, Schraut, Clark, Nutile, Barnes, Timmers, Shen, Gandin, McDaid, Hansen, Gordon, Giulianini, Boutin, Abdellaoui, Zhao and Wilson2017; Wright et al., Reference Wright, Rand, Kermany, Noto, Curtis, Garrigan, Slinkov, Dorfman, Granka, Byrnes, Myres, Ball and Ruby2019) and infer their likely genotypes from their offspring. This has both advantages and disadvantages; it may increase power because a higher proportion of parents than of probands will have died, but this is offset by the lack of direct genotyping: if both parents are present in the study, the effective sample size is 50% of that for subject mortality. If there are secular trends in mortality then the factors (including genetic factors) affecting it may differ between the parental and offspring generations. Perhaps the greatest advantage of combining parental and offspring information for genetic studies on mortality is that the time-consuming and expensive long-term follow-up of participants can be avoided.
Another approach, which also avoids the costs of follow-up, has been to recruit people who have already lived to an advanced age, although there are indications that both the calculated heritability and some of the allelic effect sizes may depend on the age cut-off chosen (van den Berg et al., Reference van den Berg, Rodriguez-Girondo, van Dijk, Mourits, Mandemakers, Janssens, Beekman, Smith and Slagboom2019; Wright et al., Reference Wright, Rand, Kermany, Noto, Curtis, Garrigan, Slinkov, Dorfman, Granka, Byrnes, Myres, Ball and Ruby2019). For this design, power to detect realistic effect sizes may be a problem unless extreme longevity (e.g., more than 100 years) is the criterion (Tan et al., Reference Tan, Zhao, Zhang, Kruse and Christensen2008). Again, secular trends may lead to changes in the prevalence of disease and in the impact of risk factors, and hence to the identification of loci that were important for those who have survived to extreme old age but are less so for those who are currently aging.
Definition of mortality-related endophenotypes (characteristics genetically correlated with lifespan), measurable in large numbers of people and not requiring long-term follow-up, offers a further approach. This can use the same individuals for both genotyping and phenotyping. So far, such endophenotypes have included cognition, physical activity, lung function, blood pressure, muscle strength and age at onset of major disease (‘healthspan’; Deelen et al., Reference Deelen, van den Akker, Trompet, van Heemst, Mooijaart, Slagboom and Beekman2016; Marioni et al., Reference Marioni, Ritchie, Joshi, Hagenaars, Okbay, Fischer, Adams, Hill, Davies, Nagy, Amador, Läll, Metspalu, Liewald, Campbell, Wilson, Hayward, Esko, Porteous, Gale and Deary2016; Sanders et al., Reference Sanders, Minster, Barmada, Matteini, Boudreau, Christensen, Mayeux, Borecki, Zhang, Perls and Newman2014; Singh et al., Reference Singh, Schupf, Boudreau, Matteini, Prasad, Newman, Liu, Christensen and Kammerer2015; Zenin et al., Reference Zenin, Tsepilov, Sharapov, Getmantsev, Menshikov, Fedichev and Aulchenko2019). Inclusion of obesity-related metabolic phenotypes has also been suggested (Marron et al., Reference Marron, Miljkovic, Boudreau, Christensen, Feitosa, Lee, Sebastiani, Thyagarajan, Wojczynski, Zmuda and Newman2019). Loci affecting such endophenotypes could form a shortlist for lifespan-related GWAS with a reduced multiple-testing burden.
We have previously found associations between multiple biochemical test results and all-cause mortality (Whitfield et al., Reference Whitfield, Colodro-Conde, Timmers, Joshi, Montgomery and Martin2020) and now move on to clarify the sources of covariation between them. Attempts to assess genetic covariation between phenotypes can use inferential family-based or direct genotype-based approaches, or both. In our comparison of familial, polygenic and biochemical predictors of mortality, we noted significant correlations between some of the biochemical test results and (1) measures of parental survival and (2) polygenic risk scores (PRS) for mortality. This implies that specific effects on the risk associated with biomarker results are transmitted across generations and that some of the polygenic risk is also captured by biomarker results. The details of the overlap deserve examination.
First, we have performed survival analysis using our study participants’ biomarker results to ‘predict’ survival of their mothers and fathers, for whom we have information on their vital status — living or dead — as reported by their offspring, and their ages at that time if living or age at death. Second, we have examined the relationships between biomarker results in our study participants and their PRS computed for a range of p-value thresholds from a meta-analysis of GWAS results based on parental survival (Joshi et al., Reference Joshi, Pirastu, Kentistou, Fischer, Hofer, Schraut, Clark, Nutile, Barnes, Timmers, Shen, Gandin, McDaid, Hansen, Gordon, Giulianini, Boutin, Abdellaoui, Zhao and Wilson2017). Patterns of correlation across the PRS can tell us whether the genetic covariation is mainly due to variants with substantial effects (PRS with stringent p-value cut-offs) or to variants with individually small effects.
We find that many of the biomarker values are associated with mortality in the parental generation, and that many are associated with mortality PRS computed at p-value cut-offs of varying stringency.
Subjects and Methods
Data for this analysis are derived from several studies on cohorts of adult twins and their relatives. The sources and data are described more fully in Whitfield et al. (Reference Whitfield, Colodro-Conde, Timmers, Joshi, Montgomery and Martin2020) but briefly, there were three studies (Heath et al., Reference Heath, Bucholz, Madden, Dinwiddie, Slutske, Bierut, Statham, Dunne, Whitfield and Martin1997; Heath et al., Reference Heath, Whitfield, Martin, Pergadia, Goate, Lind, McEvoy, Schrage, Grant, Chou, Zhu, Medland, Gordon, Nelson, Agrawal, Nyholt, Bucholz, Madden and Montgomery2011; Kirk et al., Reference Kirk, Birley, Statham, Haddon, Lake, Andrews and Martin2000; Whitfield et al., Reference Whitfield, Dy, Madden, Heath, Martin and Montgomery2008; Whitfield et al., Reference Whitfield, Fletcher, Murphy, Powell, Halliday, Heath and Martin1998) conducted between 1993 and 2005 that included blood collection and performance of biochemical tests and genotyping, as shown in the flowchart in Figure 1. The earliest of these took place between 1993 and 1996, and was based on people who had volunteered for inclusion in the Australian Twin Registry and included only twins; it was oriented towards studying the heritability of risk factors for mental or physical disease. The second in 1996−1999 focused on traits associated with anxiety and depression and included twin pairs and some of their siblings, with some selection for extremely concordant or discordant pairs for anxiety phenotypes. The third study in 2001−2005 included twins and their siblings, parents, spouses and offspring, and focused on genetic factors influencing smoking and alcohol use. Information on numbers and ages, and descriptive statistics for biomarker results by study and sex, are shown in Supplementary Table 1. Participants provided blood samples from which serum was separated, for analysis on the day of collection or after storage at −80°C. DNA was prepared from the buffy coat of white blood cells.
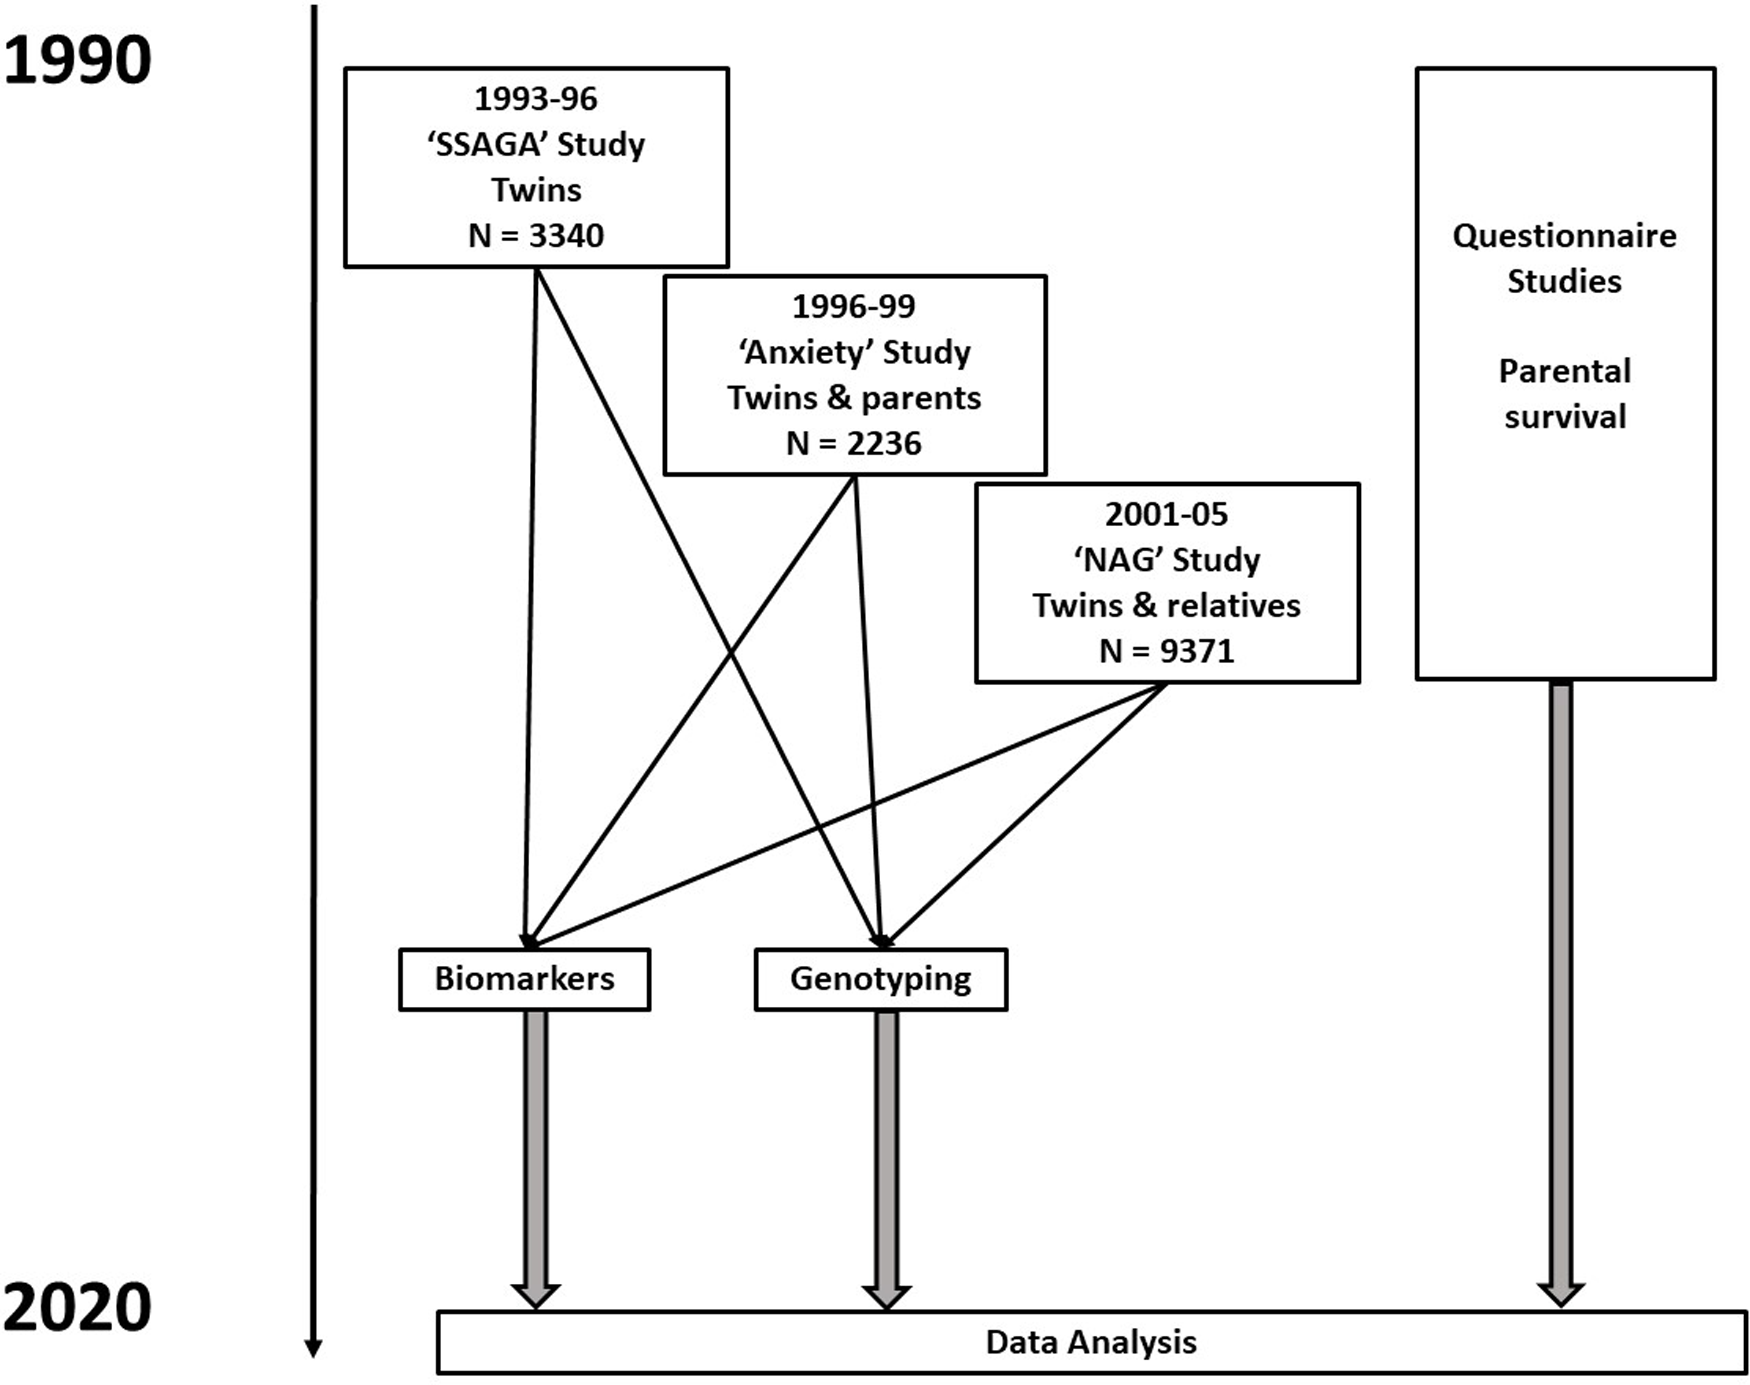
Fig. 1. Flowchart for studies and types of data contributing to baseline assessments and to follow-up of participants. Numbers shown are for participants who have results for biochemical tests in one or more of the baseline studies
Approval for the studies that generated the data used for this article and for the current analysis was given by the Human Research Ethics Committee of QIMR Berghofer Medical Research Institute, and study participants gave informed consent for collection of data and biological samples.
The biochemical tests (listed in Table 1) were almost entirely done using Hitachi or Roche 747, 917 or Modular P analysers and Roche reagents (Roche Diagnostics Australia, North Ryde NSW 2113). Glucose results were adjusted for time between the last meal and blood collection (fasting time). Where people had participated in more than one study, the earliest result for each test was used. Log10-transformation was carried out for tests with skewed distributions and sex-specific z scores, adjusted for age and age-squared for each test and each participant were then calculated. These scores were used in the survival analysis so that the hazard ratio (HR) for each potential predictor could be compared on a per-standard-deviation basis.
As part of previous questionnaire or interview studies, participants had answered questions about whether their mother and father were alive, and their current ages or ages at death. In relation to the parents’ survival, the design is therefore cross-generational rather than truly prospective. This information was used to estimate effects on parental survival in Cox regression, which incorporates information on whether each parent is known to be alive or to have died at the time of reporting, and on their age at that time. This analysis was necessarily restricted to those for whom information on both the participant biochemical results and the parental survival information were available.
Genotyping of our study participants was done using various Illumina arrays; after quality control of the genotyping, a set of single nucleotide polymorphisms (SNPs) common to these arrays was defined and additional SNPs were imputed from these results. Genotyping quality control included requirements for call rate ≥95%, minor allele frequency ≥1%, and Hardy–Weinberg equilibrium p value >10–6. Genotyping results were excluded if subjects had non-European ancestry, or if there was a mismatch between reported and genotype-based sex/gender or pedigree information. Imputation used shapeit v.2, minimac3 and 1000 Genomes phase 3r5 all-populations data to derive genotypes for a total of 48 m SNPs. Eight PRSs (PRS1 to PRS8) were calculated using allelic association effect sizes from a GWAS on loci affecting lifespan (Joshi et al., Reference Joshi, Pirastu, Kentistou, Fischer, Hofer, Schraut, Clark, Nutile, Barnes, Timmers, Shen, Gandin, McDaid, Hansen, Gordon, Giulianini, Boutin, Abdellaoui, Zhao and Wilson2017). To avoid subject overlap between the study cohorts used to estimate the PRS coefficients and the subjects with data used in this analysis, the allelic effect sizes were recalculated omitting data from our studies. Information on genotyping and imputation procedures for other cohorts contributing to the study from which the PRS coefficients were derived is given in the supplementary data to that paper (Joshi et al., Reference Joshi, Pirastu, Kentistou, Fischer, Hofer, Schraut, Clark, Nutile, Barnes, Timmers, Shen, Gandin, McDaid, Hansen, Gordon, Giulianini, Boutin, Abdellaoui, Zhao and Wilson2017). There were 13.6 m SNPs included in the GWAS whose allelic effect sizes were available for the PRS calculation. PRS were calculated from the imputed genotype dosages using the clumping and thresholding method (Wray et al., Reference Wray, Lee, Mehta, Vinkhuyzen, Dudbridge and Middeldorp2014). We excluded SNPs with low imputation quality (r 2 < 0.6) or minor allele frequency below 1%. In addition, we restricted the number of SNPs used from the discovery GWAS to include only those present in at least 50% of the maximum number contributing to each SNP, which resulted in 9,090,871 SNPs. We selected the most significant independent SNPs using PLINK 1.9 (Purcell et al., Reference Purcell, Neale, Todd-Brown, Thomas, Ferreira, Bender, Maller, Sklar, de Bakker, Daly and Sham2007) in order to correct for signal inflation due to linkage disequilibrium (LD; criteria LD r 2 < 0.1 within windows of 10 MBp). Thresholds for inclusion of independent SNPs were: PRS1, p < 5 x 10⁻⁸, 8 SNPs; PRS2, p < 10–5, 118 SNPs; PRS3, p < .001, 3284 SNPs; PRS4, p < .01, 19,191 SNPs; PRS5, p < .05, 64,087 SNPs; PRS6, p < .1, 105,730 SNPs; PRS7, p < .5, 302,910 SNPs; PRS8, p ≤ 1.0, 417,080 SNPs.
IBM SPSS, release 22 (IBM Corp., Armonk, NY) was used for data management, estimation of means and correlations, and preliminary survival analysis. However, because our recruitment of study participants emphasized twins and their families, there is genetic overlap between many of the subjects. To allow for this, we conducted the Cox regression analysis for parental survival, and the regression analysis for associations between test results and PRS, in Stata (StataCorp LLC, College Station TX) with clustering by family to generate robust standard errors for the regression coefficients and confidence intervals for HR. The time dimension used for survival analysis was reported age at death or censoring of participants’ parents. This is considered more appropriate than time from baseline assessment for epidemiological follow-up studies where no time for onset of exposure can be defined (Cologne et al., Reference Cologne, Hsu, Abbott, Ohishi, Grant, Fujiwara and Cullings2012). Separate analyses were done for the survival of participants’ mothers and fathers. Parents who were reported to still be alive were censored at the age they had reached at the time of reporting. The covariates (predictors) tested were the age- and sex-adjusted standardized residuals for each of the tests, measured in the study participants.
Results
Associations Between Biomarker Results and Parental Mortality
Results of survival analysis using Cox regression with the offspring (study participant) biomarker results and their mothers’ and fathers’ reported survival are shown in Table 1. This assesses whether and to what extent the biomarker-associated risks are transmitted across generations.
Although most effect sizes were similar for participants’ mothers and fathers (Figure 2), there was a notably stronger effect of LDL cholesterol (LDL-C) on fathers’ survival than on mothers’, with beta coefficients of −0.018 ± 0.021 (p = .382) for mothers and 0.063 ± 0.017 (p = 1.70 x 10⁻⁴) for fathers.
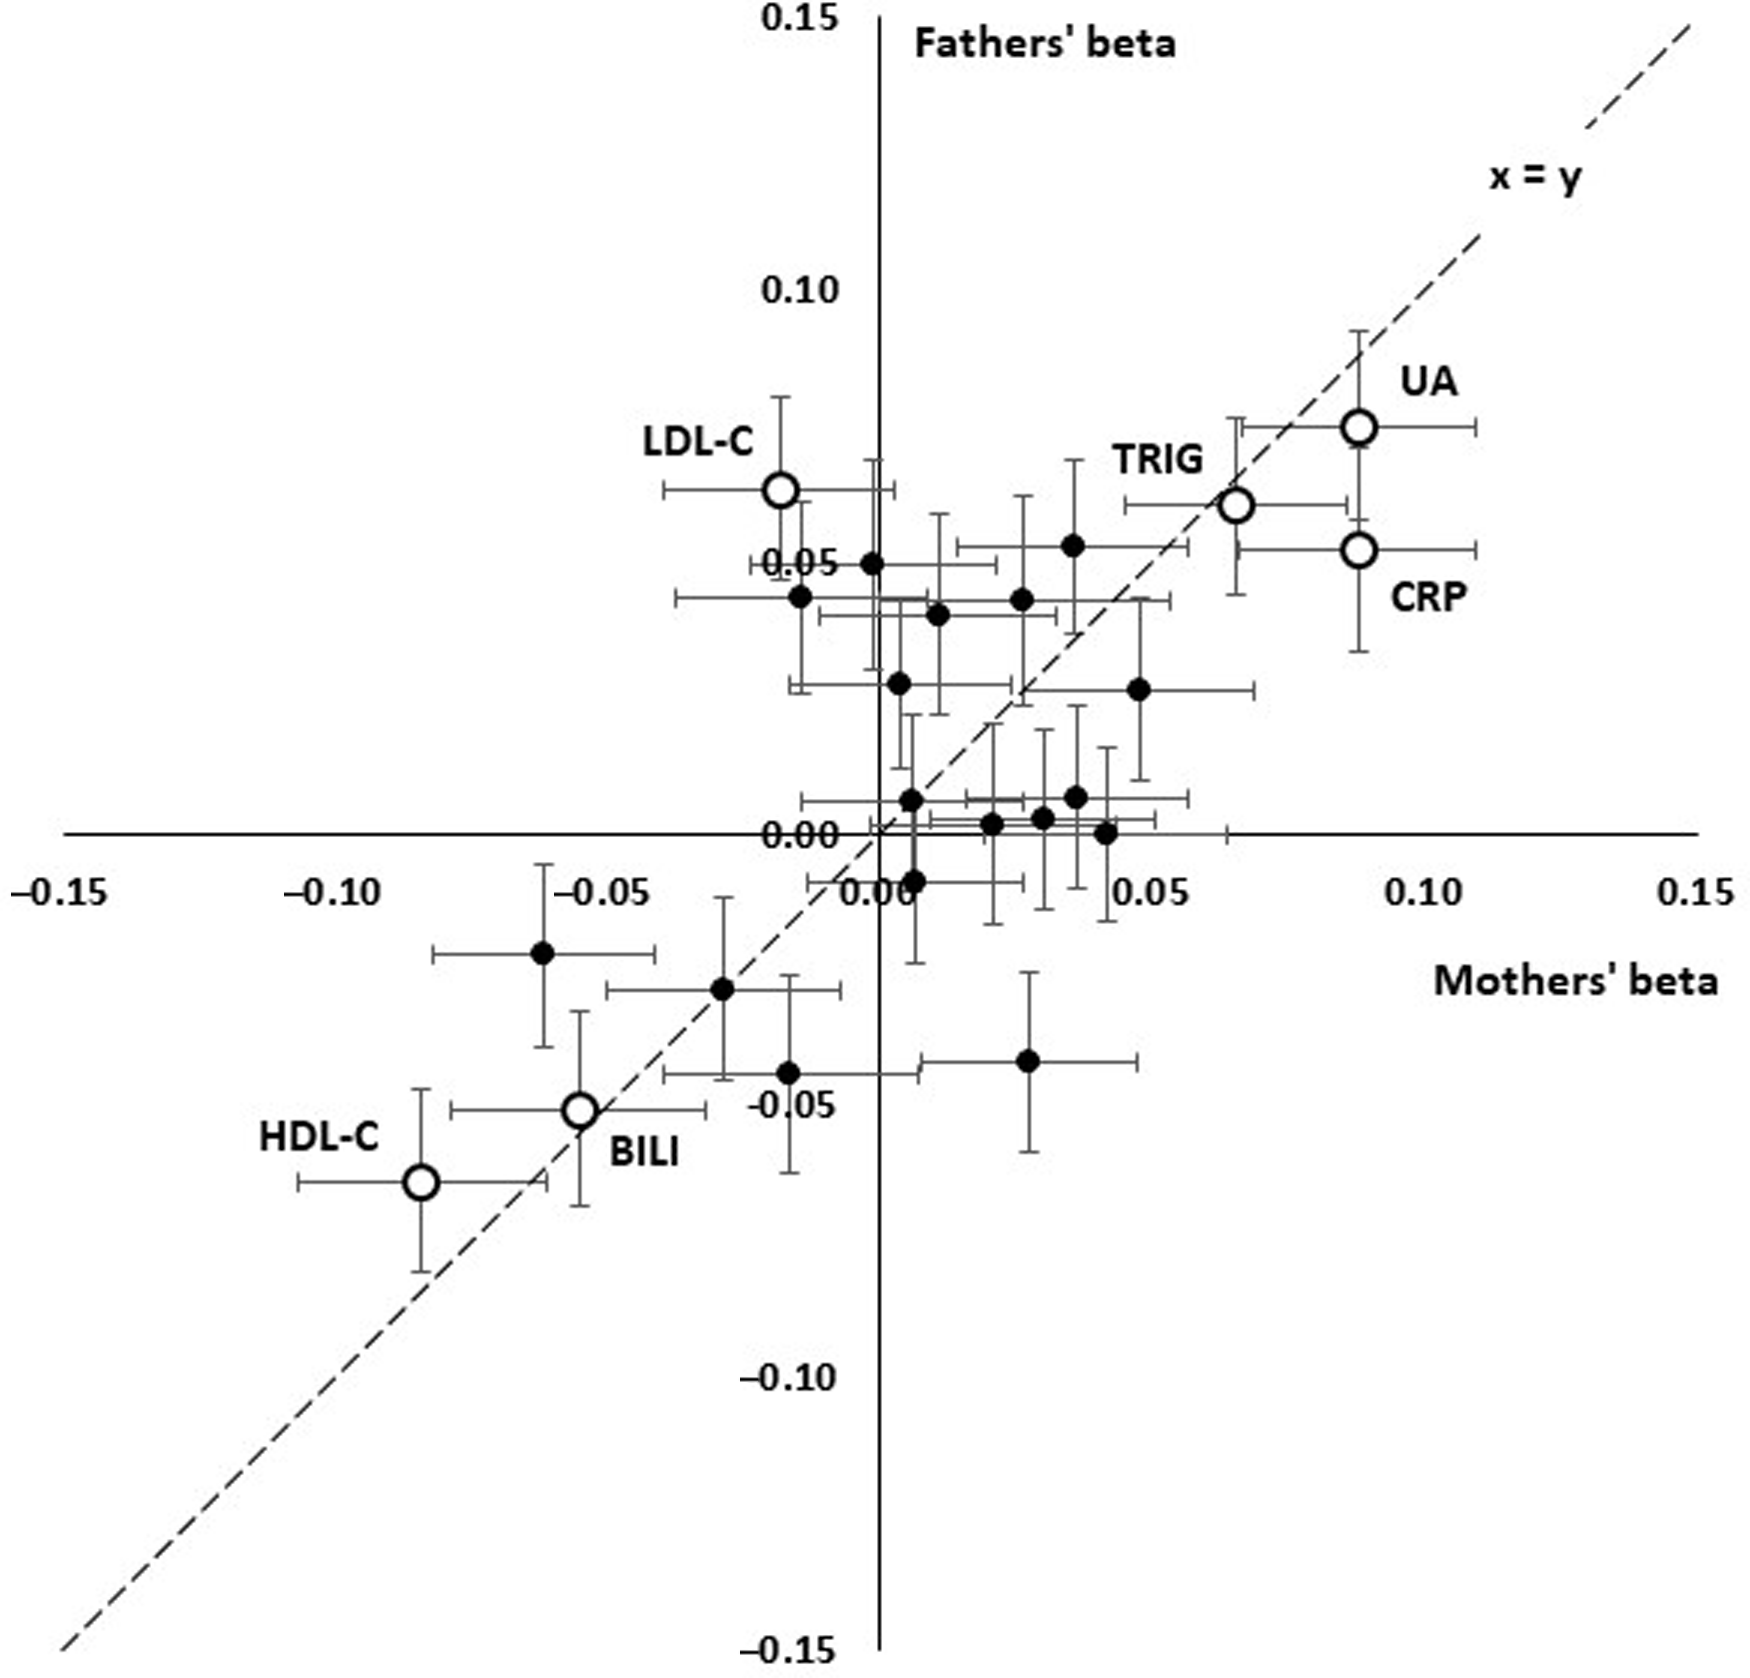
Fig. 2. Comparison of linear effect sizes (beta) for prediction of paternal and maternal survival from offspring’s age- and sex-adjusted biomarker results. Each point shows the betas for a test and error bars show standard errors for beta. The interrupted line shows x = y, equal effects for mothers and fathers. Consistent positive effects are seen for uric acid (UA), C-reactive protein (CRP), triglycerides (TG) and consistent negative effects for HDL cholesterol (HDL) and bilirubin (BILI). LDL cholesterol (LDL) shows a significant positive effect in the fathers but not the mothers
We attempted to assess which of the biomarker associations were independently significant by entering those which were significant in the univariate analyses in a stepwise procedure. This did show that uric acid, HDL- and LDL-C, and GGT were independently significant (p < .05) for the fathers’ survival and CRP and uric acid were independently significant for the mothers’, but the p values were notably less than for the univariate survival analyses.
Because the survival analysis could only be performed for families where information on both parental survival and biochemical test results in the participants was available, we checked (a) whether age- and sex-adjusted biochemical results differed according to whether parental survival information was available, and (b) whether parental survival differed according to whether biochemical test results were available for the participants. Results are shown in Supplementary Table 3. There were small differences in the mean biochemical results (0.1 standard deviations in the adjusted standardised residuals, or less), and no significant difference in either maternal or paternal survival according to whether biochemical test results were available.
Associations Between Biomarker Results and PRSs for Mortality
Trends across PRS1 to PRS8, from the most to least stringent p value for inclusion in PRS calculation, for correlations with selected biomarkers are shown in Figure 3, with details in Supplementary Table 2. In most cases, the significant correlations were with the less stringently derived PRS5-PRS8, which included loci that were not even nominally significant for mortality (with p values >.05). Lipid correlations, on the other hand, were strongest when only genome-wide significant (p < 5 x 10⁻⁸). SNPs were included (PRS1), but nominally significant correlations were also present with the more inclusive PRS5-PRS8. For proteins associated with the acute phase response (CRP, globulins), there was a reversal of the direction of correlation from negative when only a few loci were included to positive when all or nearly all were included.
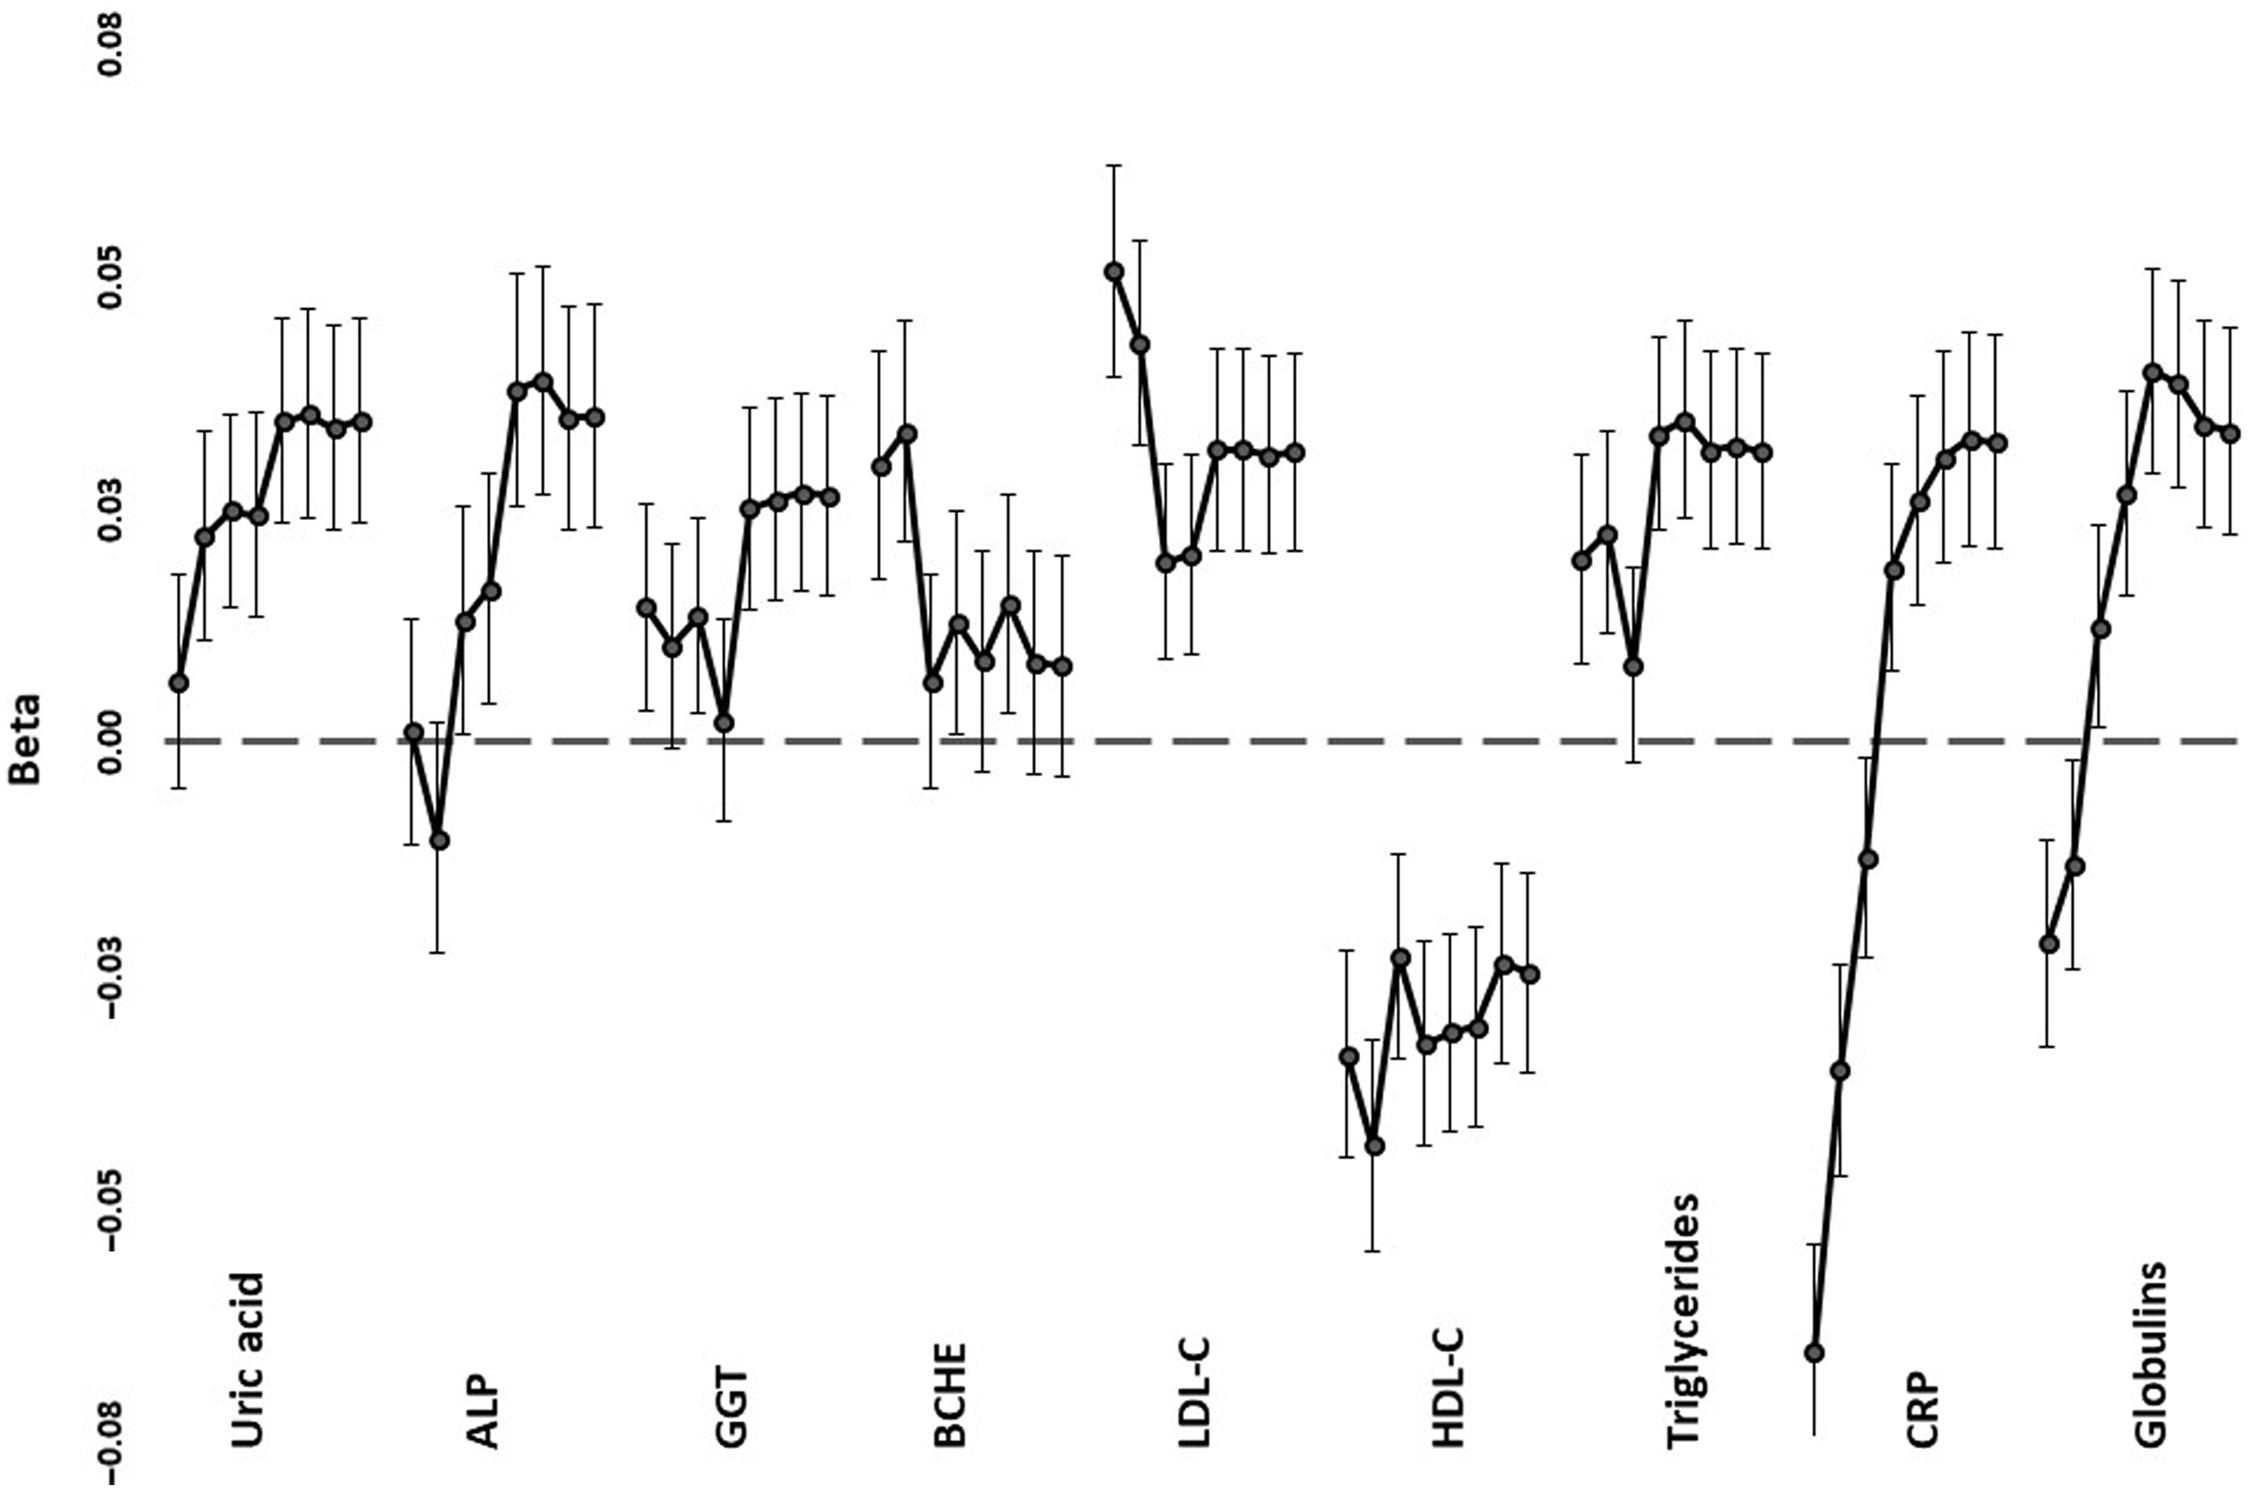
Fig. 3. Regression coefficients (beta) between selected age- and sex-adjusted biomarker values and polygenic risk scores. For each of the tests, correlations are shown, down the page, for PRS1 (independent SNPs with p < 5 x 10⁻⁸ for mortality) to PRS8 (all independent SNPs). Error bars show standard errors for the coefficients
Discussion
A combination of biochemical, genetic, genomic and mortality information on twins participating in a voluntary registry and their relatives has allowed us to explore the co-transmission of all-cause mortality and its biochemical risk factors. Having previously compared the predictive value of biochemical tests, polygenic scores and family history for mortality (Whitfield et al., Reference Whitfield, Colodro-Conde, Timmers, Joshi, Montgomery and Martin2020), we have now undertaken a more detailed examination of the relationships between the biochemical and genetic sources of variation in this characteristic. Our starting point was the observation that there were significant correlations between many of the biochemical results and the statistics summarizing genetic risk; both the PRS and parental survival. The potentially informative data comprised first, resemblance between relatives, in this case parents and offspring, and second, PRS based on SNP genotyping.
Participants’ Biomarker Results Are Associated with Parental Mortality
We know from our previous results that all-cause mortality among the participants was significantly predicted by their mothers’ or fathers’ survival. Because many of the test results in study participants were significantly correlated with the summary statistic for survival in their parents (data not shown), we first ran survival analysis using Cox regression to test whether, and how far, participants test results ‘predicted’ their parents’ reported mortality (see Table 1). Our survival analysis used parents’ reported ages at death or censoring as the time variable, which is recommended for follow-up studies. The alternative of using time from entry into the study, adjusted for age at entry, can introduce bias under some circumstances (Thiebaut & Benichou, Reference Thiebaut and Benichou2004) and is inappropriate for studies where no point can be defined at which exposure to risk begins (Cologne et al., Reference Cologne, Hsu, Abbott, Ohishi, Grant, Fujiwara and Cullings2012). Given that our focus is on transmission of risk within families, we postulate that risk exposure for the predictors tested is either lifelong or begins at a similar early age for everyone.
Because the ages of our study participants varied substantially, and because older participants would tend to have both older parents and differences in age-related biochemical results, we found it was important to adjust the test results for age and possible nonlinear effects of age (age-squared), separately by sex. This adjustment was done before use of the test results in the survival analysis, so that they represented underlying risk exposure independent of the effects of age of the study participants at the time of blood collection.
Our main finding was the transmission of biomarker-associated risk across generations, shown by the significant associations between many biomarker results (which were not measured in the parents) and parental mortality (based on reports by participants on their parents’ survival). The strongest intergenerational effects were found for C-reactive protein, HDL cholesterol, triglycerides and uric acid, with possible effects for albumin (significant in the mothers but not the fathers) bilirubin (nominally significant, p < .05, in both mothers and fathers), GGT (significant in the fathers with a trend in the same direction for mothers) and glucose (nominally significant for fathers but nonsignificant for mothers). The fact that some tests that were significantly associated with mortality in the offspring generation showed only nominal association (p < .05) with parental survival may be due to nonfamilial (environmental) aspects of risk or perhaps to insufficient power.
The tests which show associations with intergenerational transmission of risk have often been shown to be associated with mortality in studies where tests are performed at baseline and the people tested are followed until death or censoring, the classic survival-study design. There is strong evidence for association of lipids (LDL-C and HDL-C, triglycerides), inflammation markers (CRP) and liver function tests (particularly GGT) with all-cause and particularly cardiovascular mortality. Uric acid (perhaps because of its association with metabolic syndrome) and bilirubin (which has antioxidant properties) have also been associated with mortality. Most of these tests show significant heritability, so it is logical that variation in these test results would be associated with variation in parental mortality risk, but these aspects of risk do not seem to have been put together previously in an intergenerational perspective.
One test that showed different predictive power between offspring and parents, and indeed between mothers and fathers, was LDL-C. In the study participants themselves, we found no significant association between LDL-C and mortality (beta = 0.013 ± 0.027, p = .631; Whitfield et al., Reference Whitfield, Colodro-Conde, Timmers, Joshi, Montgomery and Martin2020). Our current results on mothers’ and fathers’ mortality show a highly significant association with fathers’ mortality but not with mothers’ and we consider that this illustrates the way in which risk and risk factors may vary not only by sex but over time. Rates of death from ischemic heart disease have fallen substantially in recent decades, potentially reducing the impact of variation in LDL-C on all-cause mortality, and this may account for the observed differences in association between LDL-C as a risk factor and mortality as the outcome.
The associations between biomarker results in our study participants and survival in their parents may be due to genetic variation transmitted from parents to children, to shared environmental factors, or a combination of both. Attempts to resolve the familial transmission of risk into shared-environmental and additive genetic components using data from participating twin pairs were inconclusive, consistent with low power for the classical twin design to distinguish between these sources of variation (Martin et al., Reference Martin, Eaves, Kearsey and Davies1978; Visscher et al., Reference Visscher, Gordon and Neale2008).
Biomarkers Are Associated with PRSs for Mortality
The biomarker-associated risk overlapped with the SNP effects summarized by the PRSs. This supports the presence of genetic contributions to the covariation. We evaluated whether this was due to a few loci of strong effect (associations with PRS1 or PRS2, with the most stringent p-value cut-offs) or many loci with individually weak effects (associations with PRS5 to PRS8). We found that this varies among the biomarkers considered, as summarized in Figure 3 and Supplementary Table 2.
The patterns of association fall into three groups. For LDL-C, HDL-C and CRP, the most significant correlations were with PRS1 or PRS2, and lipid and inflammatory loci included in calculation of these PRS were associated with reported mortality in a previous study (Joshi et al., Reference Joshi, Pirastu, Kentistou, Fischer, Hofer, Schraut, Clark, Nutile, Barnes, Timmers, Shen, Gandin, McDaid, Hansen, Gordon, Giulianini, Boutin, Abdellaoui, Zhao and Wilson2017). For uric acid, globulins, ALP, GGT and triglycerides, the PRS based on a very wide range of loci were the ones that had significant correlations, consistent with highly polygenic effects. However, CRP and globulins showed negative correlations with stringent PRS and positive correlations with the broadly based PRS. This is consistent with at least the APOE locus, identified previously (Joshi et al., Reference Joshi, Pirastu, Kentistou, Fischer, Hofer, Schraut, Clark, Nutile, Barnes, Timmers, Shen, Gandin, McDaid, Hansen, Gordon, Giulianini, Boutin, Abdellaoui, Zhao and Wilson2017) as having genomewide significant effects on mortality, having opposite-direction allelic effects on LDL-C and CRP (Middelberg et al., Reference Middelberg, Ferreira, Henders, Heath, Madden, Montgomery, Martin and Whitfield2011), while the majority of loci have individually smaller but directionally consistent effects on lipid- and inflammation-related risks. The similar pattern for CRP and globulins presumably reflects the response of at least some of the proteins included within the globulin group to chronic inflammation.
Strengths and Limitations
Strengths of this study include our use of multiple types of data on a reasonably large cohort drawn from the general community and mostly in middle age when first assessed. Availability of information on survival in the parents of the participants allowed a cross-generational approach that is not strictly prospective but avoids the problem of reverse causation (disease causing alteration in the predictor variables). Given the variety of approaches that have been used by others to study factors affecting longevity, it is important to note that we have studied survival rather than completed lifespan or achievement of extreme old age. There are limitations, including limited power, to exclude small associations between the nonsignificant biomarkers and familial effects on mortality. We lacked information on the causes of parental mortality, and we have not computed PRSs for subtypes of mortality such as ischemic heart disease or specific cancers. There are some potential sources of bias or lack of generalizability. Because we used information provided by study participants on their parents’ survival, people who did not have children were not represented in the mortality data. Because recruitment of study participants was based on initial contact with twins from a voluntary registry, there may be some bias towards families that include twins, or have a greater willingness to participate in health-related studies. It does not seem likely that these factors would affect our conclusions, although the fact that participants were living in Australia and nearly all were of European descent might limit the generalizability of our results to other populations.
In studies such as clinical trials where rates of loss to follow-up may differ by treatment/placebo allocation, defining lost participants as censored when in fact they may have died can introduce bias from informative censoring. However, informative censoring only introduces bias if the predictor (e.g., treatment/placebo status, or in our case a quantitative risk factor) is associated with the probability of loss to follow-up. We consider that in our case the loss to follow-up argument is not applicable, because only those parent–offspring pairings where offspring had biochemical measurements and had also provided information on their parents’ age at death or last documented age if living were included. Where either biochemical data or information on parents (but not both) was missing, there were only minor differences between those with full information and the other potential (but nonincluded) participants.
Implications
We were initially struck by the association between participants’ biomarker results and the summary statistics (Martingale residuals) for their parents’ survival. This is likely due to cotransmission of these phenotypes through genetic or cultural mechanisms, or potentially by effects of parental genes on the environments experienced by their children. The extent of the transmissible effects may vary between the tests because those that were previously shown to affect participants’ survival do not correspond exactly with those affecting parental survival. However, the implications of biomarker survival cotransmission go beyond this and may offer a route to the discovery of additional survival or mortality loci.
As discussed above, the identification of lifespan-associated genetic loci through GWAS presents a number of practical difficulties. Use of more tractable endophenotypes co-inherited with survival/mortality (such as these biochemical tests and others that may be validated in larger cohorts) may offer a route to discovery of additional loci and pathways. Identification of more loci, and phenomewide analysis for these, may help to answer the question of whether there are overall resilience loci that diminish risk for multiple age-related diseases, perhaps based on more effective homeostasis or repair mechanisms; or whether lifespan heritability is simply based on the absence of risk alleles for multiple diseases without a common genetic basis.
Supplementary Material
To view supplementary material for this article, please visit https://doi.org/10.1017/thg.2022.25.
Acknowledgments
We are grateful to the twins and other family members who have given their time and provided information and blood samples, often on several occasions and over many years; and to the staff of QIMR Berghofer MRI, Brisbane, and Royal Prince Alfred Hospital, Sydney, who have contributed to project management, biochemical testing or genotyping for these studies.
Data Availability
Assurances given to the participants in the relevant studies preclude the release of original data. It may be possible to arrange for interested researchers to access and use the data during a visit to QIMR Berghofer Medical Research Institute.
Financial Support
No specific funding was received for the data analysis reported in this paper.
Conflict of Interest
Peter Joshi is founder of Geromica, a consulting firm providing businesses with advice on aging and genomics. Otherwise none declared.


 Open access