


1. Introduction
Free radicals are molecules that are uncharged, highly reactive, and short lived. In the early 1920s, emission bands due to CH, OH, and CN radicals were first discovered in the laboratory; then, in 1937, the diatomic free radical of methylidyne, CH, was discovered (Swings & Rosenfeld Reference Swings and Rosenfeld1937; Swings Reference Swings1942) as one of the first gas-phase molecules. In 1941, a group of Belgian astronomers worked with laboratory chemists to identify CH in the optical spectra of comets (Cunningham 1940c). This sparked an interest by laboratories and astronomers alike in CH (Herzberg Reference Herzberg1971), and since the 1940s, scientists have suggested that there are two forms of CH found around interstellar objects: the molecules that form on grains and are observed in ultraviolet and infrared through the vibrational bands (although never detected) and the molecules that form in the gas phase and are observed in the ultraviolet to the radio parts of the electromagnetic spectrum.
The production of CH is expected to form in the gas phase through a radiative association reaction of C+ + H $\rightarrow$
CH +
$\rightarrow$
CH + $h\nu$
(Federman & Willson Reference Federman and Willson1982). Danks, Federman, & Lambert (Reference Danks, Federman and Lambert1984) suggested a more thorough description of the formation of diffuse interstellar CH by having H
$h\nu$
(Federman & Willson Reference Federman and Willson1982). Danks, Federman, & Lambert (Reference Danks, Federman and Lambert1984) suggested a more thorough description of the formation of diffuse interstellar CH by having H $_{2}$
playing a major role: by following the same radiative association reaction with an ion–molecule reaction CH
$_{2}$
playing a major role: by following the same radiative association reaction with an ion–molecule reaction CH $_{2}^{+}$
+ H
$_{2}^{+}$
+ H $_{2}$ $\rightarrow$
CH
$\rightarrow$
CH $_{3}^{+}$
+ H with 67% efficiency at creating a CH molecule. It is now well accepted that CH originates from the cold neutral medium of interstellar gas via the slow radiative association of C+ with H
$_{3}^{+}$
+ H with 67% efficiency at creating a CH molecule. It is now well accepted that CH originates from the cold neutral medium of interstellar gas via the slow radiative association of C+ with H $_{2}$
forming CH
$_{2}$
forming CH $^{+}_{2}$
, which converts to CH via dissociative recombination (Godard, Falgarone, & Pineau des Forêts Reference Godard, Falgarone and Pineau des Forêts2014; Gerin, Neufeld, & Goicoechea Reference Gerin, Neufeld and Goicoechea2016). The rate constants for the radio frequencies are not well understood (Dagdigian Reference Dagdigian2018). The chemical models of this reaction can produce the column densities of CH as observed in the gas phase (Crawford Reference Crawford1989; Gerin et al. Reference Gerin, Neufeld and Goicoechea2016) and found to be highly dependant on the presence of free carbon (Suutarinen et al. Reference Suutarinen2011). In the work published by Dagdigian (Reference Dagdigian2018), they found that when investigating collision rates with atomic and molecular hydrogen, the column densities from historical observations do not fit the model if local thermodynamic equilibrium (LTE) conditions are assumed, except in regions where the gas is dense. They also found that the calculations using only excitation by H
$^{+}_{2}$
, which converts to CH via dissociative recombination (Godard, Falgarone, & Pineau des Forêts Reference Godard, Falgarone and Pineau des Forêts2014; Gerin, Neufeld, & Goicoechea Reference Gerin, Neufeld and Goicoechea2016). The rate constants for the radio frequencies are not well understood (Dagdigian Reference Dagdigian2018). The chemical models of this reaction can produce the column densities of CH as observed in the gas phase (Crawford Reference Crawford1989; Gerin et al. Reference Gerin, Neufeld and Goicoechea2016) and found to be highly dependant on the presence of free carbon (Suutarinen et al. Reference Suutarinen2011). In the work published by Dagdigian (Reference Dagdigian2018), they found that when investigating collision rates with atomic and molecular hydrogen, the column densities from historical observations do not fit the model if local thermodynamic equilibrium (LTE) conditions are assumed, except in regions where the gas is dense. They also found that the calculations using only excitation by H $_2$
do not reproduce the excitation pattern of the lamda doubling transitions near 3.3 GHz.
$_2$
do not reproduce the excitation pattern of the lamda doubling transitions near 3.3 GHz.
There have been a number of publications regarding CH: its formation routes (e.g. Millar Reference Millar2015, references therein), its role as a proxy for H $_{2}$
(e.g. (e.g. Sheffer et al. Reference Sheffer, Rogers, Federman, Abel, Gredel, Lambert and Shaw2008; Wiesemeyer et al. Reference Wiesemeyer2018; Dailey et al. Reference Dailey, Smith, Magnani, Andersson and Reach2020), and its ability to trace the dynamics of diffuse and dense gas (e.g. Federman & Willson Reference Federman and Willson1982; Gerin et al. Reference Gerin, Neufeld and Goicoechea2016). Since CH is found in Hi regions, Hii regions, and dust clouds, there is reason to believe that the molecule is widespread within our Galaxy (Rydbeck, Elldér, & Irvine Reference Rydbeck, Elldér and Irvine1973) and has been widely observed in diffuse interstellar gas clouds at 3 GHz (Chastain, Cotten, & Magnani Reference Chastain, Cotten and Magnani2010).
$_{2}$
(e.g. (e.g. Sheffer et al. Reference Sheffer, Rogers, Federman, Abel, Gredel, Lambert and Shaw2008; Wiesemeyer et al. Reference Wiesemeyer2018; Dailey et al. Reference Dailey, Smith, Magnani, Andersson and Reach2020), and its ability to trace the dynamics of diffuse and dense gas (e.g. Federman & Willson Reference Federman and Willson1982; Gerin et al. Reference Gerin, Neufeld and Goicoechea2016). Since CH is found in Hi regions, Hii regions, and dust clouds, there is reason to believe that the molecule is widespread within our Galaxy (Rydbeck, Elldér, & Irvine Reference Rydbeck, Elldér and Irvine1973) and has been widely observed in diffuse interstellar gas clouds at 3 GHz (Chastain, Cotten, & Magnani Reference Chastain, Cotten and Magnani2010).
A recent resurgence of the study of CH has started with the laboratory work by Truppe et al. (Reference Truppe2013), completing a focused study on the 700 and 3 300 MHz radio transitions, and Wiesemeyer et al. (Reference Wiesemeyer2018) completing a study of the $N=2$
ground state line in the infrared. Truppe et al. (Reference Truppe2013) combined laboratory experiments with past astronomical observations to determine the precise frequencies of emission, the interaction with the Zeeman effect, and the use of CH to determine fundamental universal constants. The interaction with the Zeeman Effect (the splitting of transitions due to the presence of a magnetic field) is of particular interest as it has been found that these transitions have a splitting factor comparable to that of mainline OH, 0.93 Hz
$N=2$
ground state line in the infrared. Truppe et al. (Reference Truppe2013) combined laboratory experiments with past astronomical observations to determine the precise frequencies of emission, the interaction with the Zeeman effect, and the use of CH to determine fundamental universal constants. The interaction with the Zeeman Effect (the splitting of transitions due to the presence of a magnetic field) is of particular interest as it has been found that these transitions have a splitting factor comparable to that of mainline OH, 0.93 Hz $\mu$
G–1, and thus has the potential to allow for this molecule to trace the impact of magnetic fields on the chemical evolution of the interstellar medium (see Crutcher & Kemball Reference Crutcher and Kemball2019 for a full review on the importance of Zeeman Effect in star formation). Wiesemeyer et al. (Reference Wiesemeyer2018) used observations at 2 THz to compare CH with traditional proxies of molecular hydrogen in cold gas and determined that CH provided more information over traditional models, including CO.
$\mu$
G–1, and thus has the potential to allow for this molecule to trace the impact of magnetic fields on the chemical evolution of the interstellar medium (see Crutcher & Kemball Reference Crutcher and Kemball2019 for a full review on the importance of Zeeman Effect in star formation). Wiesemeyer et al. (Reference Wiesemeyer2018) used observations at 2 THz to compare CH with traditional proxies of molecular hydrogen in cold gas and determined that CH provided more information over traditional models, including CO.
Based on its expected abundance and appearance in diffuse and dense gas, analysis of CH at low radio frequencies is an ideal target for the Square Kilometre Array (SKA) to study the role magnetic fields play in the early stages of star formation. The Australian Square Kilometre Array Pathfinder (ASKAP), with operational frequencies of 700–1 800 MHz and stationed in a protected radio quiet environment, makes for an ideal precursor instrument to determine the feasibility of these low-frequency studies. This paper presents the first interferometric search using early science observations with ASKAP.
2. Previous radio observations of CH
Most of the detections and study of the CH radical are in the ultraviolet (e.g. Herzberg Reference Herzberg1971), optical (e.g. Danks et al. Reference Danks, Federman and Lambert1984), and infrared (e.g. Wiesemeyer et al. Reference Wiesemeyer2018) parts of the electromagnetic spectrum. The first radio detection of interstellar CH (in the 3.3-GHz transitions, once observational wavelengths were known) was towards 17 Hi and Hii regions (almost all with previous OH detections) by Rydbeck et al. (Reference Rydbeck, Elldér and Irvine1973) and Federman (Reference Federman1982). Rydbeck et al. (Reference Rydbeck, Elldér and Irvine1973) found all detections were in emission and towards OH maser sites, with the CH transition showing evidence of weak masing towards some sources suggesting CH can be detected where the lower rotational lines of CO could not.
A search for CH (3.3GHz) along the Galactic plane by Johansson (Reference Johansson1979) found the molecular distribution more extended than CO(1-0) surveys of the time. Additional studies of the CH 3-GHz distribution towards small dark molecular (Federman Reference Federman1982; Mattila Reference Mattila1986) and high latitude translucent (Magnani & Onello Reference Magnani and Onello1995; Chastain et al. Reference Chastain, Cotten and Magnani2010; Cotten & Magnani Reference Cotten and Magnani2013) clouds have shown the CH molecule to be an excellent tracer for H $_{2}$
in low-density (n
$_{2}$
in low-density (n $\leq 10^{3}$
cm3; A
$\leq 10^{3}$
cm3; A $_{V}$ $\leq$
5 mag) gas, with a linear relationship existing between N(CH) and N(H
$\leq$
5 mag) gas, with a linear relationship existing between N(CH) and N(H $_{2}$
) for these regions. Dailey et al. (Reference Dailey, Smith, Magnani, Andersson and Reach2020) studied the possibility of using the 3-GHz transitions as a proxy of the molecular hydrogen gas and found that the excitation temperatures vary significantly depending on the line-of-sight.
$_{2}$
) for these regions. Dailey et al. (Reference Dailey, Smith, Magnani, Andersson and Reach2020) studied the possibility of using the 3-GHz transitions as a proxy of the molecular hydrogen gas and found that the excitation temperatures vary significantly depending on the line-of-sight.
Whilst the detection of the 3 335-MHz transition of CH is readily obtained across a wide range of molecular environments, there are very few published detection of CH at the lower transitions of $\sim$
700 MHz. Ziurys & Turner (Reference Ziurys and Turner1985) observed the
$\sim$
700 MHz. Ziurys & Turner (Reference Ziurys and Turner1985) observed the $F=2-2$
and
$F=2-2$
and $F=1-1$
,
$F=1-1$
, $N=1$
,
$N=1$
, $J=3/2$
transitions between 700 and 725 MHz with the Arecibo 300-m telescope and NRAO Green Bank 300 foot (91 m) telescope followed by Turner (Reference Turner1988). Ziurys & Turner (Reference Ziurys and Turner1985) detected two lines in absorption towards W51, and the
$J=3/2$
transitions between 700 and 725 MHz with the Arecibo 300-m telescope and NRAO Green Bank 300 foot (91 m) telescope followed by Turner (Reference Turner1988). Ziurys & Turner (Reference Ziurys and Turner1985) detected two lines in absorption towards W51, and the $F=2-2$
,
$F=2-2$
, $N=1$
,
$N=1$
, $J=3/2$
transition was reported as detected towards W3, W43, and Ori B in absorption with Arecibo. The lines detected towards W51A showed a matching profile to the 3.3-GHz observations by Genzel et al. (Reference Genzel, Downes, Pauls, Wilson and Bieging1979). Turner (Reference Turner1988) detected all four hyperfine transitions towards W51A and found large fractional abundances of CH compared to expectations from chemical modelling of the W51 region. Given the lack of observations at the lower frequencies, more data are required to ascertain the extent of the W51 results across other regions.
$J=3/2$
transition was reported as detected towards W3, W43, and Ori B in absorption with Arecibo. The lines detected towards W51A showed a matching profile to the 3.3-GHz observations by Genzel et al. (Reference Genzel, Downes, Pauls, Wilson and Bieging1979). Turner (Reference Turner1988) detected all four hyperfine transitions towards W51A and found large fractional abundances of CH compared to expectations from chemical modelling of the W51 region. Given the lack of observations at the lower frequencies, more data are required to ascertain the extent of the W51 results across other regions.
3. New radio observations of CH
The CH molecule has four hyperfine transitions in the range $\sim$
700–725 MHz representing the
$\sim$
700–725 MHz representing the $N=1$
$N=1$ $J=3/2$
transition. The 724.788-MHz transition (
$J=3/2$
transition. The 724.788-MHz transition ( $F=1-1$
) is shown in Figure 1 along with the higher frequency
$F=1-1$
) is shown in Figure 1 along with the higher frequency $N=1\ J=1/2$
transition at 3 349 MHz.
$N=1\ J=1/2$
transition at 3 349 MHz.
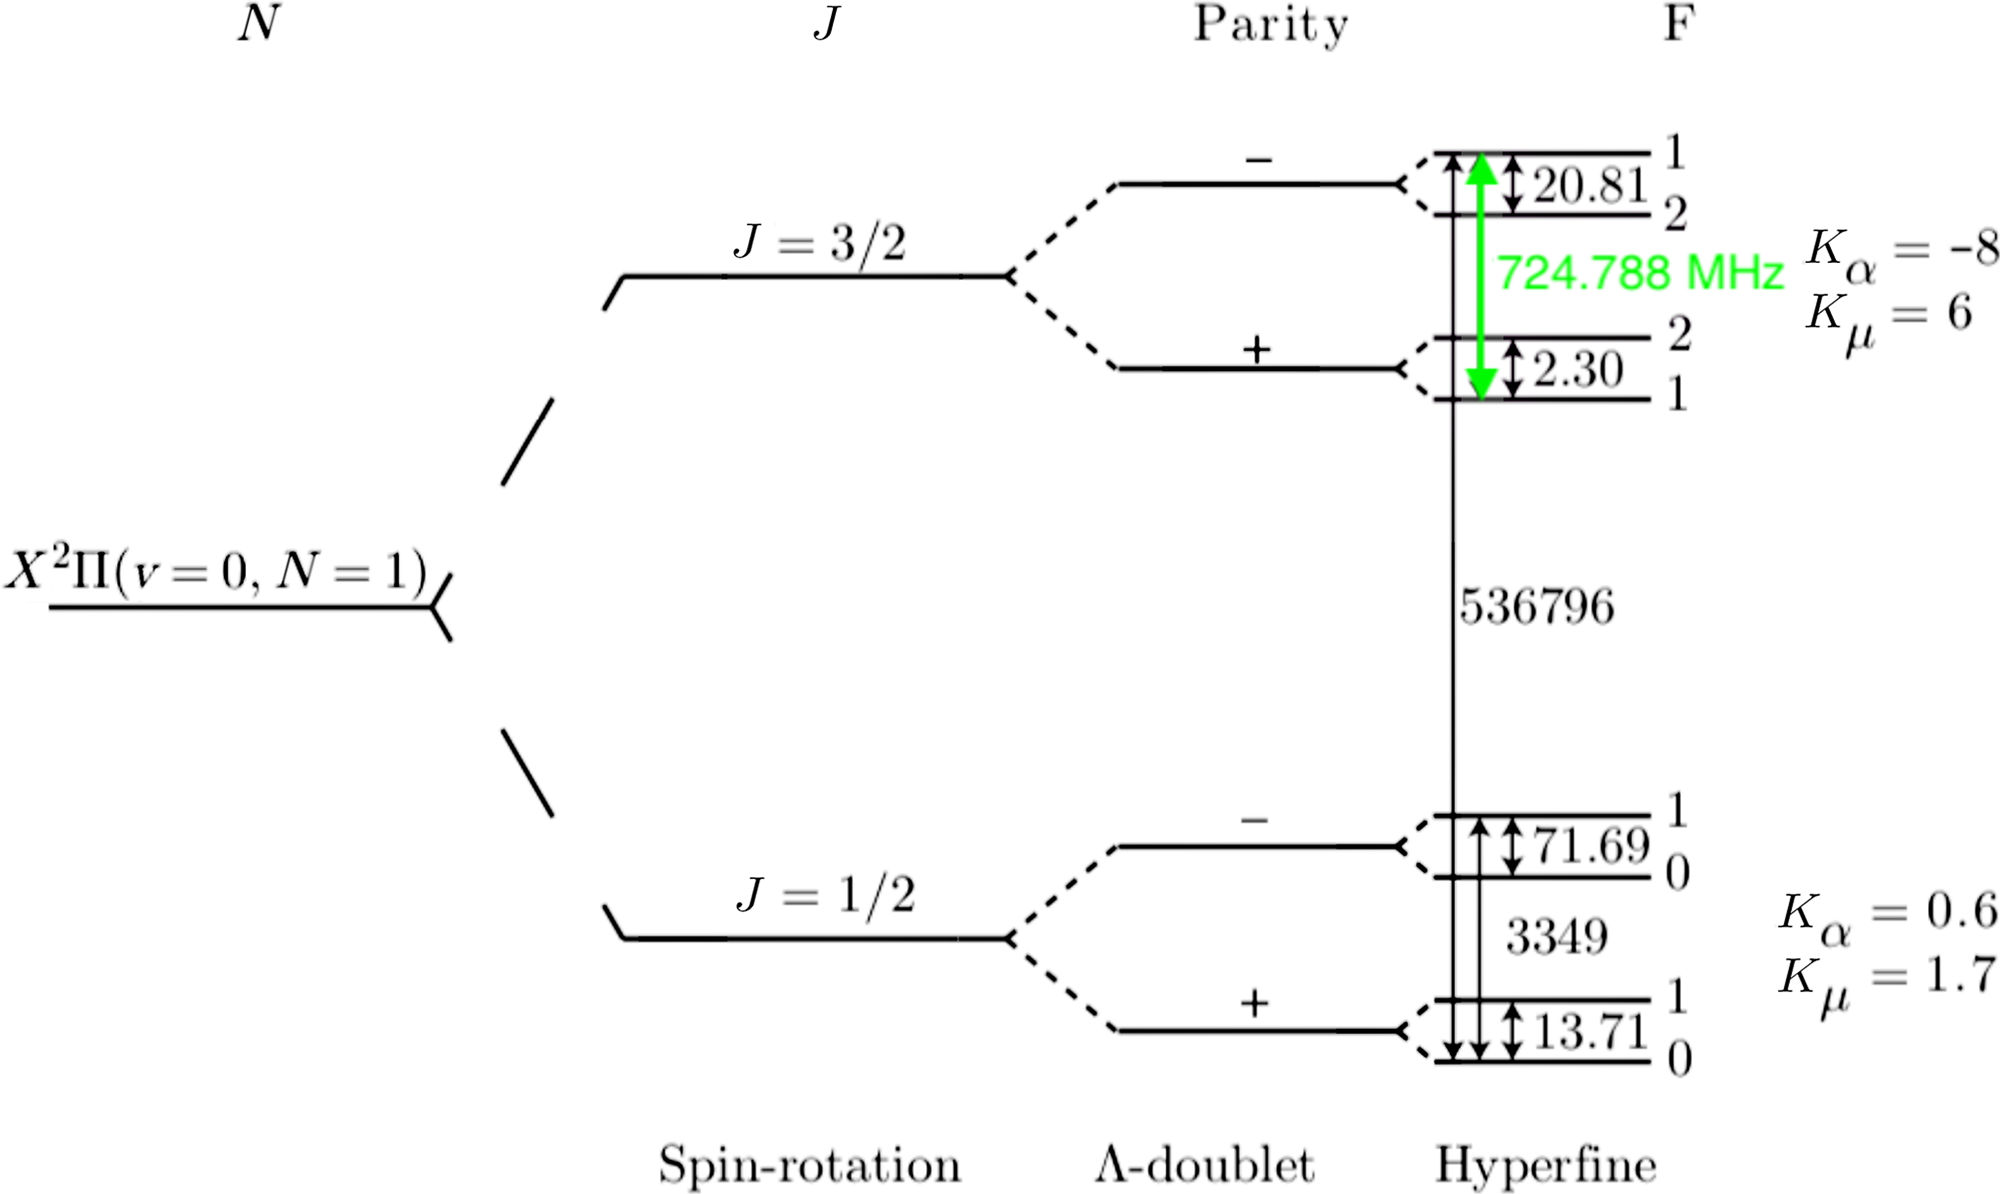
Figure 1. Relevant energy levels in CH from Figure 1 of Truppe et al. (Reference Truppe2013). Approximate frequencies of separation are given in MHz, with the 724.788315-MHz transition highlighted in green. The sensitivity coefficients (K) for the two $\lambda$
-doublet transitions are shown.
$\lambda$
-doublet transitions are shown.
The transition at 701.6777 MHz was found to be the strongest by Ziurys & Turner (Reference Ziurys and Turner1985) followed by the transition at 724.7883 MHz. The intervening transitions at 722.4876 and 703.9783 MHz were weakly detected by Turner (Reference Turner1988). These low-frequency hyperfine transitions have been found to be both weaker (1/25th of the sensitivity) and less prevalent (5% of molecules) than the more well-studied $\sim$
3.3 GHz
$\sim$
3.3 GHz $J=1/2$
transitions (Truppe et al. Reference Truppe2013). Observations with the Effelsberg 100-m telescope of the
$J=1/2$
transitions (Truppe et al. Reference Truppe2013). Observations with the Effelsberg 100-m telescope of the $J=1/2$
transitions by Genzel et al. (Reference Genzel, Downes, Pauls, Wilson and Bieging1979) detected the lines in Hii regions with 2–3 h of integrated time, thus implying a significant integration time is required for the
$J=1/2$
transitions by Genzel et al. (Reference Genzel, Downes, Pauls, Wilson and Bieging1979) detected the lines in Hii regions with 2–3 h of integrated time, thus implying a significant integration time is required for the $J=3/2$
transitions (consistent with the observations by Ziurys & Turner (Reference Ziurys and Turner1985) where they specify observing across several days). New studies of these transitions therefore need to exploit the most sensitive new telescopes, such as the ASKAP.
$J=3/2$
transitions (consistent with the observations by Ziurys & Turner (Reference Ziurys and Turner1985) where they specify observing across several days). New studies of these transitions therefore need to exploit the most sensitive new telescopes, such as the ASKAP.
3.1. Australian Square Kilometre Array Pathfinder (ASKAP)
The ASKAP (Johnston et al. Reference Johnston, Taylor, Bailes, Bartel and Baugh2008, Hotan et al. submitted) is located at the Murchison Radio-astronomy Observatory in Western Australia. Observations were taken on 23 February 2019 with a central frequency of 724 and 18 MHz of total bandwidth, with a frequency resolution of 1 kHz. This provides a 0.25 km s–1 velocity resolution. Each of the antennas is equipped with a Phased Array Feed (PAF; Schinckel & Bock Reference Schinckel and Bock2016) giving it a field of view, over 36 beams, of $\sim$
30 deg2. The details of the observations are listed in Table 1.
$\sim$
30 deg2. The details of the observations are listed in Table 1.
The observations were taken as part of the commissioning of the low band of ASKAP (McConnell et al. Reference McConnell, Allison, Bannister and Bell2016), and 35Footnote a antennas were online with a minimum baseline of 22 m and maximum baseline of 6 km. The observations were taken in full polarisation, and observations of PKS B1934–638 were performed immediately adjacent in time to the target field for the purposes of bandpass calibration. Each calibration observation contained one calibrator scan of duration 5 min at the centre of each PAF beam before mosiacing to the full instrument field-of-view.
All data were processed using ASKAPsoft (Guzman et al. Reference Guzman2019) for calibration and imaging. This included flagging, bandpass calibration, phase self-calibration, imaging, continuum subtraction, spectral cube imaging, and correction of the data to the local standard of rest reference frame. During processing, antennas 1, 4, and 10, from the inner core, were flaggedFootnote b. This combined with antenna 11 being offline reduced our surface brightness sensitivity by $\sim$
40% and thus our sensitivity to diffuse emission. Nine PAF beams were processed individually and then mosaiced together to form an image of the region used in this paper. However, the Hii region of interest fits within a single central beam.
$\sim$
40% and thus our sensitivity to diffuse emission. Nine PAF beams were processed individually and then mosaiced together to form an image of the region used in this paper. However, the Hii region of interest fits within a single central beam.
3.2. RCW 38: Hii region
We completed a targeted survey with ASKAP towards RCW 38 to look for the low-frequency transition of CH at 724.788 MHz with 5 h of integration time and a pointing centre of RA 09:59:05 Dec –47:30:39 (J2000). The molecule CH has been detected in a number of different astrophysical environments, but the only detection of a low-frequency transition published was towards the OH maser site of W51A (Ziurys & Turner Reference Ziurys and Turner1985). As RCW 38 is also an Hii region thought to be fuelled by an old supernova explosion and colliding clouds (e.g. Wolk et al. Reference Wolk, Spitzbart, Bourke and Alves2006; Schneider et al. Reference Schneider2010; Sano et al. Reference Sano, Enokiya, Hayashi, Yamagishi and Saeki2018), we completed our first attempt to search for the molecule with ASKAP towards this region.
RCW 38, an Hii region located in the Vela Molecular Cloud Complex, is 1.7 $\pm$
0.9 kpc away (Wolk et al. Reference Wolk, Spitzbart, Bourke and Alves2006) and is nearly as dense as the Orion Kleinmann-Low Nebula with young stellar objects (Schneider et al. Reference Schneider2010). See Wolk, Bourke, & Vigil (Reference Wolk, Bourke and Vigil2008) for a review of the region and the historical observations. Torii et al. (Reference Torii, Tokuda, Tachihara, Onishi and Fukui2019) recently completed a high-resolution survey of CO and its isotopologues with the Atacama Large Millimeter/submillimeter Array. They detected CO in the lobes of RCW 38, often referred to as IRS1 and IRS2 (from Wynn-Williams et al. Reference Wynn-Williams, Becklin and Neugebauer1972), and the bridge of gas that expands between the two with two different radial velocities of
$\pm$
0.9 kpc away (Wolk et al. Reference Wolk, Spitzbart, Bourke and Alves2006) and is nearly as dense as the Orion Kleinmann-Low Nebula with young stellar objects (Schneider et al. Reference Schneider2010). See Wolk, Bourke, & Vigil (Reference Wolk, Bourke and Vigil2008) for a review of the region and the historical observations. Torii et al. (Reference Torii, Tokuda, Tachihara, Onishi and Fukui2019) recently completed a high-resolution survey of CO and its isotopologues with the Atacama Large Millimeter/submillimeter Array. They detected CO in the lobes of RCW 38, often referred to as IRS1 and IRS2 (from Wynn-Williams et al. Reference Wynn-Williams, Becklin and Neugebauer1972), and the bridge of gas that expands between the two with two different radial velocities of $\sim$
2 and
$\sim$
2 and $\sim$
12 km s–1. Bourke et al. (Reference Bourke, Myers, Robinson and Hyland2001) detected the 1 665 and 1 667 OH lines in absorption with detectable Zeeman Splitting (with a corresponding magnetic field strength of 38
$\sim$
12 km s–1. Bourke et al. (Reference Bourke, Myers, Robinson and Hyland2001) detected the 1 665 and 1 667 OH lines in absorption with detectable Zeeman Splitting (with a corresponding magnetic field strength of 38 $\pm$
3
$\pm$
3 $\mu$
G). The source is often characterised as being two clouds colliding which fuels the significant star formation with over 1 000 objects detected by X-ray and infrared (e.g. Fukui et al. Reference Fukui, Torii, Ohama, Hasegawa and Hattori2016; Sano et al. Reference Sano, Enokiya, Hayashi, Yamagishi and Saeki2018). In Figure 2, the ASKAP radio continuum is shown in contours over an infrared image from the Wide-field Infrared Survey Explorer (WISE) Survey. The contours reveal new structure to the IRS1 cloud but is found to be similar to the structure detected by Bourke et al. (Reference Bourke, Wolk, Vigil and Alves2004) at 1.6 GHz with the Australia Telescope Compact Array. Greater detail regarding this new structure will be presented in a future paper.
$\mu$
G). The source is often characterised as being two clouds colliding which fuels the significant star formation with over 1 000 objects detected by X-ray and infrared (e.g. Fukui et al. Reference Fukui, Torii, Ohama, Hasegawa and Hattori2016; Sano et al. Reference Sano, Enokiya, Hayashi, Yamagishi and Saeki2018). In Figure 2, the ASKAP radio continuum is shown in contours over an infrared image from the Wide-field Infrared Survey Explorer (WISE) Survey. The contours reveal new structure to the IRS1 cloud but is found to be similar to the structure detected by Bourke et al. (Reference Bourke, Wolk, Vigil and Alves2004) at 1.6 GHz with the Australia Telescope Compact Array. Greater detail regarding this new structure will be presented in a future paper.
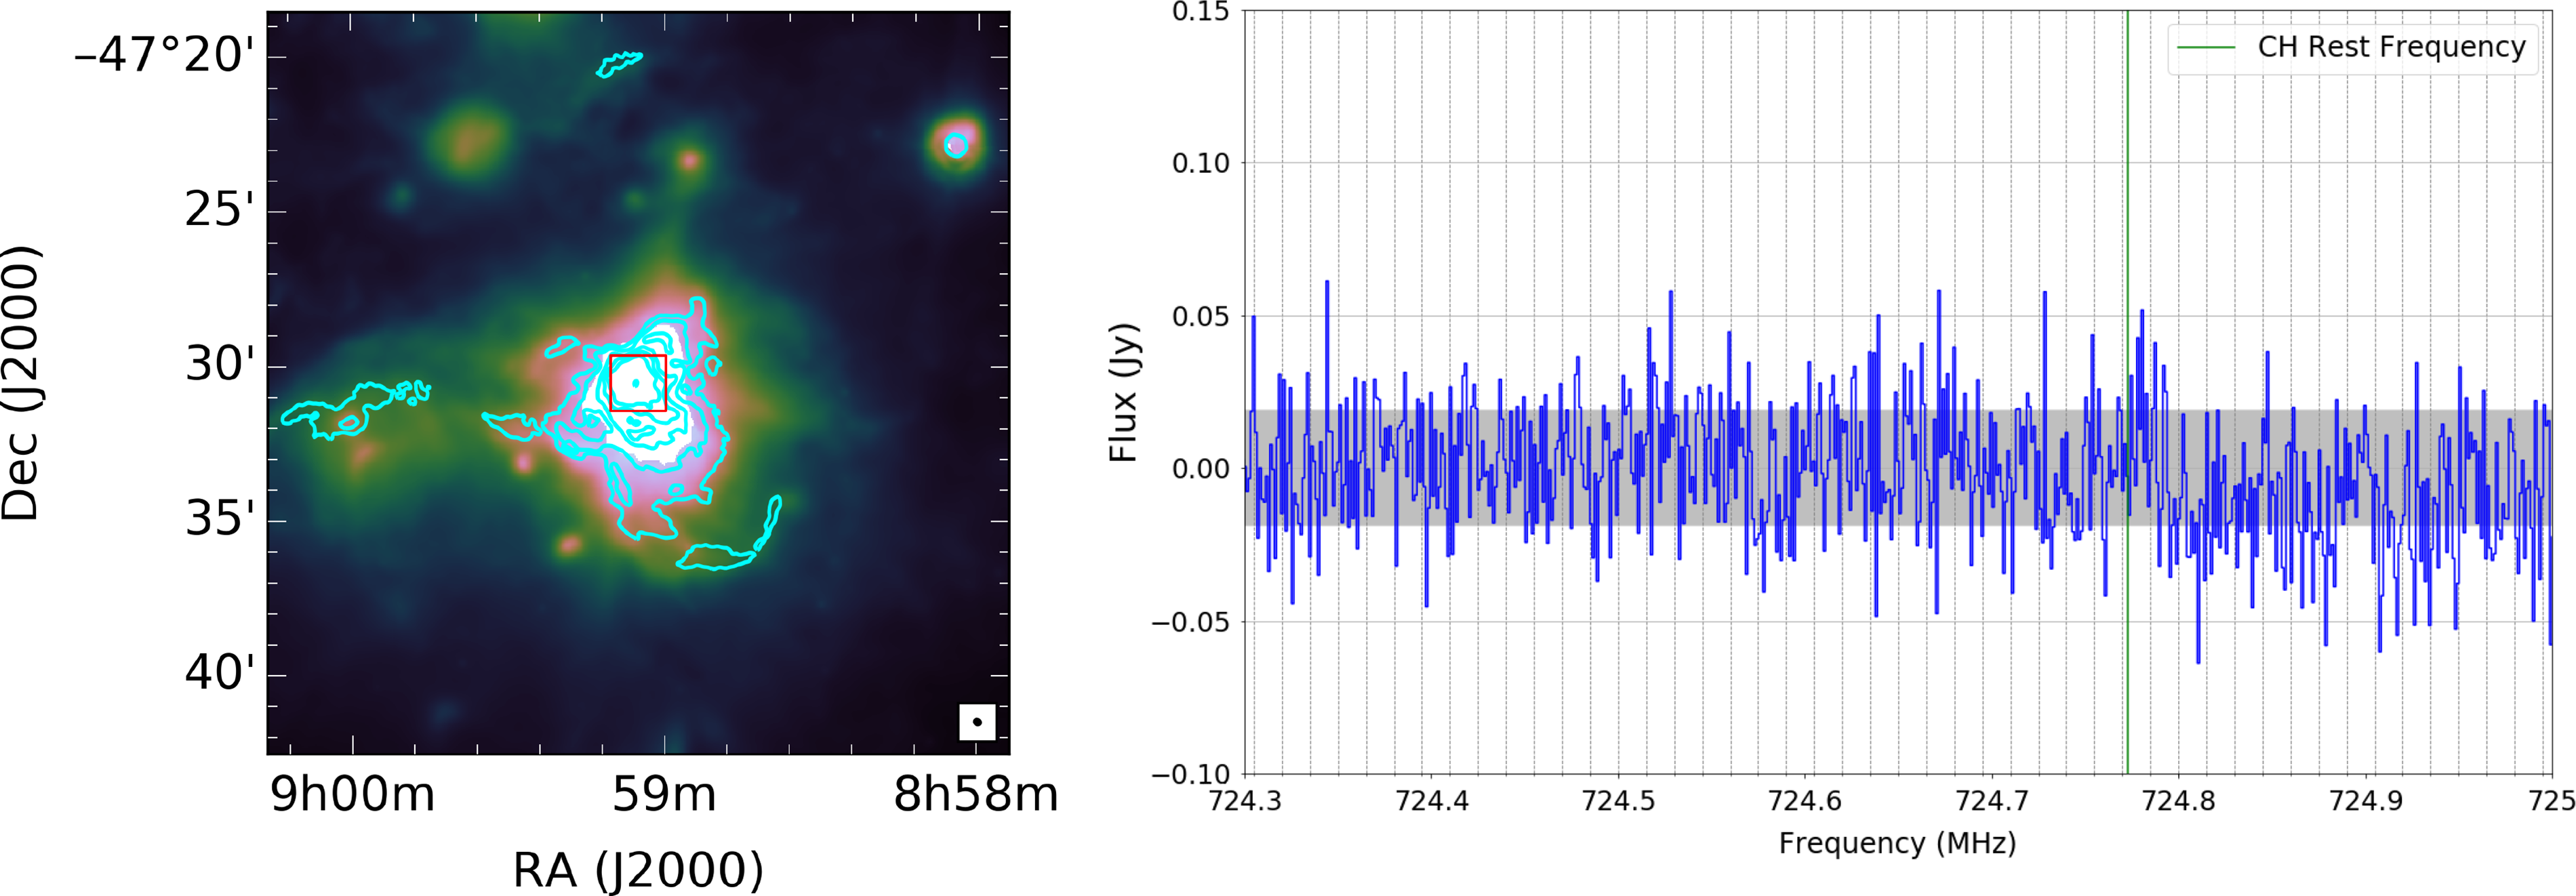
Figure 2. Left: An image of the eastern lobe (IRS1) of RCW 38, where the cyan contours from the ASKAP radio continuum emission are overlaid onto an infrared image of the region from the Wide-field Infrared Survey Explorer (WISE) survey. The contours show greater detail of the lobes typically denoted as ‘IRS1’ in the literature (Wynn-Williams et al. Reference Wynn-Williams, Becklin and Neugebauer1972). The contours are set at levels of 3–8 $\sigma$
(0.003 to 0.09 Jy beam–1), and the bottom right-hand corner shows the size of the synthesised beam. Right: The spectrum averaged over the region marked with a red box on the image on the left. The rest frequency of the CH transition (724.7883 MHz) is denoted by a green vertical line, the grey shading represents noise (one sigma), and the five-sigma sensitivity limit is taken as 0.09 Jy.
$\sigma$
(0.003 to 0.09 Jy beam–1), and the bottom right-hand corner shows the size of the synthesised beam. Right: The spectrum averaged over the region marked with a red box on the image on the left. The rest frequency of the CH transition (724.7883 MHz) is denoted by a green vertical line, the grey shading represents noise (one sigma), and the five-sigma sensitivity limit is taken as 0.09 Jy.
Table 1. ASKAP observing parameters.
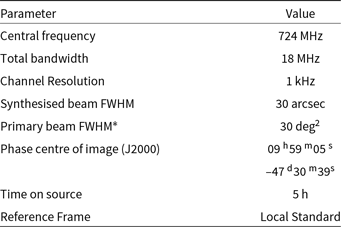
* The primary beam size represents the size of a full processed field with 36 PAF beams. A single PAF beam has a primary beam of 1 deg2.
4. Results and limits for detection
As shown in the spectrum on the right-hand side of Figure 2, we did not detect the CH transition towards RCW 38 with our ASKAP observations to a five-sigma limit of 0.09 Jy after averaging the signal over the region marked by the red box in the left-hand image of the eastern lobe of RCW38.
We calculated the upper limit in emission (at five sigma) of the total column from Equation A1 of Tremblay et al. (Reference Tremblay, Hurley-Walker, Cunningham, Jones, Hancock, Wayth and Jordan2017) at a T $_\mathrm{{ex}}$
of 50 K to be 1.9
$_\mathrm{{ex}}$
of 50 K to be 1.9 $\times 10^{18}$
cm–2. Ziurys & Turner (Reference Ziurys and Turner1985) determined the column density derived for the lower energy state to be 9.8
$\times 10^{18}$
cm–2. Ziurys & Turner (Reference Ziurys and Turner1985) determined the column density derived for the lower energy state to be 9.8 $\times 10^{17}$
cm–2 for CH in W51A, assuming similar physical conditions. However, Turner (Reference Turner1988) suggests this calculation may be simplistic and not a good limit on the gas content.
$\times 10^{17}$
cm–2 for CH in W51A, assuming similar physical conditions. However, Turner (Reference Turner1988) suggests this calculation may be simplistic and not a good limit on the gas content.
The previous detections of the low-frequency CH lines by Ziurys & Turner (Reference Ziurys and Turner1985) and Turner (Reference Turner1988) towards W51 were both in absorption. Using the spectrum in Figure 2, we can make some estimate of the optical depth in relation to the peak intensity in the continuum. For this, we get an optical depth limit of 0.95. If we use the modified column density Equations (1) and (2) from Turner (Reference Turner1988), we get a five-sigma upper limit on the column density of 1.3 $\times 10^{14}$
cm–2 which is consistent with historical values in W51 and other Hii regions (around 1
$\times 10^{14}$
cm–2 which is consistent with historical values in W51 and other Hii regions (around 1 $\times 10^{14}$
cm–2 (Genzel et al. Reference Genzel, Downes, Pauls, Wilson and Bieging1979; Rydbeck et al. Reference Rydbeck, Elldér and Irvine1973)). However, as noted by both Dailey et al. (Reference Dailey, Smith, Magnani, Andersson and Reach2020) and Dagdigian (Reference Dagdigian2018), the values of column density are likely non-physical measurements as the radio lines do not follow LTE conditions.
$\times 10^{14}$
cm–2 (Genzel et al. Reference Genzel, Downes, Pauls, Wilson and Bieging1979; Rydbeck et al. Reference Rydbeck, Elldér and Irvine1973)). However, as noted by both Dailey et al. (Reference Dailey, Smith, Magnani, Andersson and Reach2020) and Dagdigian (Reference Dagdigian2018), the values of column density are likely non-physical measurements as the radio lines do not follow LTE conditions.
We do note that the previously reported low-frequency detections of CH were achieved using the 300-m Arecibo telescope, which as a single dish with a beam size of more than 6.3 arcmin and has greater sensitivity to diffuse (low surface brightness) emission. In comparison, a single ASKAP’s PAF equipped on the antennas (at these frequencies) has a primary beam of $\sim$
1
$\sim$
1 $^\circ$
, and the resultant imaging has a ∼15 arcsec synthesised beam. In these observations, we lost a large percentage of the shorter baselines, thus making us less sensitive to the diffuse gas but this will not effect sensitivity to the dense gas. Danks et al. (Reference Danks, Federman and Lambert1984) noted that the signal from the diffuse gas was stronger than that from the dense gas and the two components are easily differentiated through resolved velocity components.
$^\circ$
, and the resultant imaging has a ∼15 arcsec synthesised beam. In these observations, we lost a large percentage of the shorter baselines, thus making us less sensitive to the diffuse gas but this will not effect sensitivity to the dense gas. Danks et al. (Reference Danks, Federman and Lambert1984) noted that the signal from the diffuse gas was stronger than that from the dense gas and the two components are easily differentiated through resolved velocity components.
As such, observations with the full ASKAP array of 36 antennas, with all of the shorter baselines, may be required for future success. Additionally, we note that Ziurys & Turner (Reference Ziurys and Turner1985) quote a velocity resolution 1.4 km s–1, whereas our observations have a velocity resolution of 0.25 km s–1. With the Parkes 64-m Telescope fitted with the new Ultra-wideband receiver (Hobbs et al. Reference Hobbs, Manchester, Dunning, Jameson and Roberts2020), we detected CH in the eastern lobe (IRS1) at 3.264 GHz in a 10-min snapshot image. Therefore, we know the molecule to exist in the region, and more observing time should yield a detection of the low-frequency transitions.
5. Implications for future studies
Based on the current presented observations, the best chance for detection of the $J=3/2$
transition at 724.788 MHz is to obtain observations for at least 8 h of integration with ASKAP (using all 36 antennas). However, this is the first published search for CH with an interferometer. In the previous single-dish searches, the beam filling factor is assumed to be 1, so interferometry will help determine if this is true (Wiesemeyer et al. Reference Wiesemeyer2018). It will also help identify if the excitation temperature is indeed negative. This may impact the length of observation required to detect CH with an interferometer such as ASKAP.
$J=3/2$
transition at 724.788 MHz is to obtain observations for at least 8 h of integration with ASKAP (using all 36 antennas). However, this is the first published search for CH with an interferometer. In the previous single-dish searches, the beam filling factor is assumed to be 1, so interferometry will help determine if this is true (Wiesemeyer et al. Reference Wiesemeyer2018). It will also help identify if the excitation temperature is indeed negative. This may impact the length of observation required to detect CH with an interferometer such as ASKAP.
It is also important to further consider the choice of target: although we now have a wealth of information on the astrophysical properties of regions from Galactic plane surveys, which can form the basis of targeted observations, all of the previously published CH detections are towards OH maser sites. The combination of OH and CH (with their respective broad Zeeman splitting factors) can provide a useful diagnostic of magnetic fields in differing stages of the interstellar medium. Surveys of OH that are planned with ASKAP (Dickey et al. Reference Dickey, McClure-Griffiths, Gibson and Gómez2013) along the Galactic plane and long-term surveys like the The Southern Parkes Large-Area Survey in Hydroxyl (Dawson et al. Reference Dawson, Walsh, Jones, Breen, Cunningham and Lowe2014) may provide the best targets to be used for understanding CH and its role in the interstellar medium.
Both of the components (mid- and low-frequency arrays) of the future SKA telescope will be in the southern hemisphere, whereas most of the searches for CH at radio wavelengths have been towards targets accessible by the northern hemisphere. As such, the precursors like ASKAP can provide us with useful regions to target later with the SKA.
The CSIRO Parkes 64-m Telescope, an SKA technology pathfinder, has a new ultra-wide band receiver (Hobbs et al. Reference Hobbs, Manchester, Dunning, Jameson and Roberts2020), which covers the frequency range of 704–4 000 MHz, allowing simultaneous studies of the 724.788 MHz and $\sim$
3.3 GHz CH transitions. Rydbeck et al. (Reference Rydbeck, Elldér and Irvine1973) observed CH ground state transitions at 3.264 GHz in 17 HII regions. They found a resemblance of CH to the OH excited state of
$\sim$
3.3 GHz CH transitions. Rydbeck et al. (Reference Rydbeck, Elldér and Irvine1973) observed CH ground state transitions at 3.264 GHz in 17 HII regions. They found a resemblance of CH to the OH excited state of $2\Pi1/2,\ J=1/2$
transitions, which can also be observed with Parkes.
$2\Pi1/2,\ J=1/2$
transitions, which can also be observed with Parkes.
Searches for other low-frequency molecular transitions associated with CH may also prove to be beneficial to understanding the interstellar medium. Rydbeck et al. (Reference Rydbeck, Elldér and Irvine1973) found that CH velocities matched those of formaldehyde, an important tracer of core collapse in early high-mass stars. Both formaldehyde and deuterated formaldehyde have transitions detectable by the Murchison Widefield Array (MWA; also a SKA precursor) between 70 and 300 MHz, and deuterated formaldehyde was found in the Orion complex with the MWA by Tremblay et al. (Reference Tremblay, Jones, Cunningham, Hurley-Walker, Jordan and Tingay2018).
A further consideration for future studies, as alluded to earlier, is that Truppe et al. (Reference Truppe2013) found that the 722–724 MHz transitions of CH to be particularly sensitive to magnetic fields and the line shows polarisation, which ASKAP is capable of detecting. As CH is detectable in diffuse and dense gas, this provides a new way of studying the role magnetic fields play in the early stages of star formation in comparison to OH which is only detectable in dense gas.
6. Conclusion
Using the ASKAP telescope, an SKA precursor in Western Australia, we have completed the first interferometric search of the low-frequency transition of the CH molecule at 724.7883 MHz towards RCW 38. We established a five-sigma upper limit for non-detection of 0.09 Jy, which corresponds to a total column density upper limit of 1.9 $\times 10^{18}$
cm–2 for emission and 1.3
$\times 10^{18}$
cm–2 for emission and 1.3 $\times 10^{14}$
cm–2 for absorption with an optical depth limit of 0.95. Based on the column density limit of previous detection of CH, this should have been adequate for detection. These limits, combined with a spectrum free from radio frequency interference, show that detection of the 724-MHz transition should be possible with ASKAP with an integration time of
$\times 10^{14}$
cm–2 for absorption with an optical depth limit of 0.95. Based on the column density limit of previous detection of CH, this should have been adequate for detection. These limits, combined with a spectrum free from radio frequency interference, show that detection of the 724-MHz transition should be possible with ASKAP with an integration time of $\sim$
8 h, but would benefit from having the full 36 antenna array to increase the sensitivity to the diffuse gas.
$\sim$
8 h, but would benefit from having the full 36 antenna array to increase the sensitivity to the diffuse gas.
Acknowledgements
We thank the anonymous referee for their comments and assistance on improving this manuscript. This scientific work makes use of the Murchison Radio-astronomy Observatory, operated by CSIRO. We acknowledge the Wajarri Yamaji people as the traditional owners of the Observatory site. Operation of ASKAP is funded by the Australian Government with support from the National Collaborative Research Infrastructure Strategy. Establishment of ASKAP, the Murchison Radio-astronomy Observatory, and the Pawsey Supercomputing Centre are initiatives of the Australian Government, with support from the Government of Western Australia and the Science and Industry Endowment Fund. This research has made use of NASAs Astrophysics Data System Bibliographic Services. We acknowledge the Pawsey Supercomputing Centre which is supported by the Western Australian and Australian Governments. Access to Pawsey Data Storage Services is governed by a Data Storage and Management Policy (DSMP). This publication makes use of data products from the Wide-field Infrared Survey Explorer, which is a joint project of the University of California, Los Angeles, and the Jet Propulsion Laboratory/California Institute of Technology, funded by the National Aeronautics and Space Administration.


