


Exercise is now commonly recommended to overweight and obese individuals for losing weight, but also to the general population for preventing body-weight gain(Reference Okay, Jackson and Marcinkiewicz1). However, exercise efficiency strongly depends on its power to create a negative energy balance, with energy expenditure (EE) induced by exercise not being compensated for by an increase in post-exercise energy intake (EI). A review based on a large panel of studies has recently concluded that spontaneous EI does not compensate for exercise-induced EE(Reference Elder and Roberts2), leading to a negative energy balance. However, the magnitude of weight loss is small in overweight or obese subjects when exercise is not associated with a diet programme(Reference Kerksick, Thomas and Campbell3), suggesting that a certain level of energy compensation (EC) occurs. It was actually shown that individuals who experienced a lower than predicted weight loss are compensating for the increase in EE(Reference King, Hopkins and Caudwell4).
Although they have limited relevance to everyday life conditions and to long-term adaptations, laboratory studies assessing the response to an acute bout of exercise allow an accurate measurement of EI and EE. In these conditions, most studies conducted in human subjects have not reported any post-exercise change in EI(Reference Elder and Roberts2, Reference King, Miyashita and Wasse5–Reference O'Donoghue, Fournier and Guelfi9), and when compensation was observed, it was small and far from complete(Reference Martins, Morgan and Bloom10, Reference Laan, Leidy and Lim11). However, there is large inter-individual variability in the EI response to exercise, leading some authors to classify subjects as compensators and non-compensators(Reference Finlayson, Bryant and Blundell6, Reference Unick, Otto and Goodpaster12). One important objective would be to determine the factors that modulate this level of compensation.
Among these factors, the fatness and fitness levels may represent good candidates. Due to the role of body fatness as endogenous energy stores, it could be expected that EC would be lower in subjects with a higher body fat level. On the contrary, a high fitness level may require energy homeostasis to be accurate for supplying high and intermittent energy needs and may be associated with a higher EC.
To this day, the influence of body fatness on this compensation level has only been assessed through the overweight or obese status, and most studies have reported no differences in EC compared with normal-weight subjects(Reference Dodd, Welsman and Armstrong13–Reference Ueda, Yoshikawa and Katsura17). However, the clear overweight status of subjects may have influenced their intake and, moreover, their fitness status was not documented. Fitness level has rarely been considered in the compensation to exercise-induced EE. Recently, based on the weekly exercise duration of male subjects, it has been reported that only lean, active individuals displayed an incomplete compensation, whereas no compensation occurred in lean, inactive ones(Reference Jokisch, Coletta and Raynor18). It was also shown that active young or senior subjects compensated more accurately for the energy of a preload than sedentary ones(Reference Van Walleghen, Orr and Gentile19, Reference Long, Hart and Morgan20), or after than before a 2-week(Reference Whybrow, Hughes and Ritz21) or a 6-week exercise programme(Reference Martins, Truby and Morgan22).
Another important outcome is whether exercise induces changes in further macronutrient intake. Specific compensation in the form of dietary fat might enhance energy adjustment due to its higher energy density. In normal-weight male or female individuals, studies assessing macronutrient intake after an exercise session have yielded varying results with subjects increasing the fat(Reference Pomerleau, Imbeault and Parker23, Reference Klausen, Toubro and Ranneries24), carbohydrate (CHO)(Reference Pomerleau, Imbeault and Parker23, Reference Dionne, Johnson and White25, Reference Westerterp-Plantenga, Verwegen and Ijedema26) or protein(Reference Jokisch, Coletta and Raynor18, Reference Farah, Malkova and Gill27, Reference Verger, Lanteaume and Louis-Sylvestre28) proportions of their spontaneous diet.
Thus, we conducted a study to determine whether young, non-obese male subjects with high body fatness and low fitness levels would show reduced compensation of exercise-induced EE and a different macronutrient selection after a single aerobic exercise bout compared with that observed for subjects with low body fatness and high fitness levels.
Materials and methods
Study design
The study followed a within-subject design, with subjects separated into two groups according to their body fatness and fitness status, and completing in random order the two following test conditions: 60 min of exercise (EX) and 60 min of rest (RT). These conditions were completed on two consecutive weeks, and on the same day of the week. The procedure is described in Fig. 1.
Fig. 1 Schedule of the experimental procedure. B, breakfast; L, lunch; EI, energy intake.
Subjects
Male subjects were recruited through board advertisements in the Paris 13 University area (Paris, France). Inclusion criteria were that the volunteers be male, healthy and ranging in age between 18 and 25 years. Smokers, subjects who drank alcohol more than occasionally, who had food allergies or who took medication were excluded from the study. Volunteers were also excluded if they reported any personal medical history and any familial history of sudden death during exercise. Any current obesity (BMI >30 kg/m2), change in body weight >5 kg over the year before the study or a dietary restraint score (R1 >7) on the Three-Factor Eating Questionnaire(Reference Stunkard and Messick29) were also the exclusion criteria. Lastly, they had to consume every day at least three meals including breakfast, lunch and dinner, with no less than 10 % represented by breakfast. They were separated into two groups according to their body fatness and fitness levels. Subjects were included in a low-fatness/high-fitness (Lfat/Hfit) group if their fat mass index (FMI, body fat mass divided by height squared)(Reference Van Itallie, Yang and Heymsfield30) was lower than 4 kg/m2, their VO2max was higher than 45 ml/kg per min and they practised moderate to intense or moderate physical activity more than 5 h every week. They were included in a high-fatness/low-fitness (Hfat/Lfit) group if their FMI was higher than 5 kg/m2, their VO2max was lower than 45 ml/kg per min and they practised moderate to intense or moderate physical activity less than 3 h every week. Body fat mass was assessed by an eight-electrode bioelectrical impedance analyser (Tanita BC 418MA; Tanita Company). This device has a very low ( < 1 %) between-day CV, and a very high correlation (r >0·92) with dual X-ray absorptiometry(Reference Pietrobelli, Rubiano and St-Onge31). Although it has been found to slightly underevaluate (about 4 %) the percentage of fat mass(Reference Volgyi, Tylavsky and Lyytikainen32), it was considered to be accurate enough to correctly distribute subjects in each group without possible misclassification. The cut-off value for FMI was based on previous reports about this index in populations(Reference Kyle, Schutz and Dupertuis33) according to the age range of our subject sample. The cut-off value for VO2max was derived from the data reported by Wilson & Tanaka(Reference Wilson and Tanaka34) in the 20–29-year-old sedentary category. The subjects' characteristics are displayed in Table 1. The present study was conducted according to the guidelines laid down in the Declaration of Helsinki, and all procedures were approved by the French National Ethics Committee no. 10. Written informed consent was obtained from all subjects who received a financial compensation for their participation.
Table 1 Subjects' characteristics (Mean values and standard deviations)
Lfat/Hfit, low fatness/high fitness; Hfat/Lfit, high fatness/low fitness.
* Mean value was significantly different from that of the Lfat/Hfit group (P <0·05).
Preliminary testing
At least 3 d before the experimental trial, VO2max was determined by a progressive maximal workload conducted on a bicycle ergometer (Ergoselect 100P; Ergoline). Gas exchange rates were measured by open-circuit spirometry using Vmax Encore (Viasys Healthcare). Heart rate was monitored by a twelve-electrode Cardiosoft electrocardiogram (Viasys Healthcare). VO2max was considered to have been reached when the two following criteria were met: (1) less than 2 ml/kg per min VO2 increase despite workload increase and (2) RER >1·15.
Foods
Subjects were asked to maintain consistent eating and activity habits over the 2 d preceding each session. The day before a session, they ate dinner at home at approximately the same time. The dinner consisted of lasagna (6·1 kJ/g with 39, 45 and 16 % from CHO, fat and protein, respectively). They were allowed to add some bread, a dessert and beverages to this main course but were instructed to maintain similar contents of their dinner meals before each session. Food consumption was then forbidden until the next morning.
Subjects were asked to come to the laboratory at 08.00 hours in a fasting state. They were then served a breakfast with an energy content calculated on the basis of their regular intake at this meal. This procedure is classically used and is intended to avoid any potential disturbing effect of a mandatory fixed meal on future eating behaviour due to an unusual quantity consumed compared with subjects' habits. However, to limit inter-individual variability, the same foods were provided to all subjects (bread, butter, marmalade, cottage cheese with sugar and orange juice) and macronutrient proportions were matched (70, 20 and 10 % from CHO, fat and protein, respectively).
Lunch consisted mainly of one large dish exceeding the expected intake at a meal to encourage real ad libitum intake. This procedure has been found to be reliable to evaluate EC after an exercise session(Reference Laan, Leidy and Lim11). Although it precludes observing any difference in macronutrient intake, it is preferred to the buffet-type meal that we found to often result in over-consumption and selection of different items at each session for the purpose of variety. This dish was composed of minced meat mixed with mashed potatoes (‘hachis parmentier’; 5·1 kJ/g with 38, 38 and 24 % from CHO, fat and protein, respectively). However, to mimic a real French meal, bread (10·6 kJ/g with 86, 3 and 11 % from CHO, fat and protein, respectively) and stewed apples (4·2 kJ/g with 96, 3 and 1 % from CHO, fat and protein, respectively) completed it. Given the macronutrient composition of these two food items, this allowed subjects to specifically modify their CHO intake only. Before inclusion, subjects attested that they liked and ate on a regular basis the items provided at lunch. All foods were freshly prepared on the morning of each session day, chilled in a refrigerator and then reheated in an oven when required.
From the end of lunch to the end of breakfast the day after, subjects were instructed to consume foods available at home (restaurants or meals outside home were forbidden). To improve homogeneity across subjects, the main course of the dinner was supplied: couscous (6·2 kJ/g with 31, 44 and 25 % from CHO, fat and protein, respectively), but the other courses were not. Snacks were allowed.
Exercise
Exercise intensity but not EE was fixed across subjects on the basis of the percentages of individual VO2max. This option is based on the risk that fixed EE may represent a very different physiological ‘stress’ between the groups of different fitness levels, and may create a bias if responses vary according to the relative physical load. After a 5 min warm-up period at 75 W, the workload was progressively increased over a 10 min period until the subjects reached 70 % of their VO2max; this intensity was then maintained over 45 min. Continuous gas exchange permitted measurement of EE and constant adjustment of the workload so that exercise was maintained at the desired intensity.
This exercise intensity was chosen because it is considered enough to induce potent effects on eating behaviour(Reference King, Burley and Blundell35) and to be well tolerated even by moderately active young men. To reduce the role of dehydration and thirst in further intake, subjects were required to drink an amount of water matching the exercise-induced weight loss (between 200 and 400 ml). At resting conditions, a 500 ml water load ingested 30 min before meal has been reported not to modify EI in young subjects(Reference Van Walleghen, Orr and Gentile36). Thus, similarly to other studies(Reference Laan, Leidy and Lim11), compensating for fluid loss was preferred.
Energy expenditure and substrate oxidation
During the 60 min rest, EE was calculated by the energy equivalent of O2 derived from the Weir equation(Reference Weir37), and substrate oxidation was calculated using the Peronnet & Massicotte(Reference Peronnet and Massicotte38) equations, with the assumption that protein oxidation is negligible. During exercise, the Jeukendrup & Wallis(Reference Jeukendrup and Wallis39) equations for moderate- to high-intensity exercise (50–75 % VO2max) were used to assess substrate oxidation and EE. These stoichiometric equations are more appropriate for exercise because it takes into account the fact that at this intensity, only 20 % of glucose oxidised derives from plasma, whereas 80 % comes from glycogen.
Food and macronutrient intakes
Food intake at lunch was measured in the laboratory. Before and after consumption, foods were accurately weighed (PM 3000; Mettler; accuracy: 0·1 g) to determine actual intake. Then, subjects had to return home and to accurately report until next breakfast included the amount of food consumed as measured by a portable weighing balance (Oasis; Tefal; accuracy: 1 g), and a complete description of the food eaten (name and brand of the product). They were provided diaries specifically conceived for this experiment. A professional dietitian then determined energy content and macronutrient composition of each eaten item.
Motivation to eat
Motivation to eat was assessed every 30 min from the beginning of the breakfast to the end of lunch on classic 100 mm visual analogue scales preceded by the following questions: ‘Do you feel hungry?’ (hunger scale); ‘Do you want to eat something?’ (desire-to-eat scale); ‘How full do you feel?’ (gastric fullness scale). These scales were anchored with ‘not at all’ and ‘extremely’ at the left and right ends, respectively. The distance from the extreme left to the subject's vertical dash represented the rating score, expressed in mm.
Data analysis
EI was analysed in absolute (EI) and in relative (REI) values. REI corresponded to EI corrected for the energy cost of exercise above the resting level, i.e. EI on the RT day and EI minus exercise-induced EE on the EX day. EC was calculated as the percentage of energy adjustment: EC = ((EIEX− EIRT)/(EEEX− EERT)) × 100. A score of 100 % would reflect perfect compensation and a lower or higher score would reflect a tendency to under- or overcompensate, respectively. The difference in EE between the EX and RT conditions was considered the energy challenge. The macronutrient composition of food intake was calculated as absolute values and as percentages of EI. All of these variables were calculated (1) at lunch; (2) after lunch until the next breakfast; (3) cumulated over the 24 h.
Data were analysed using SYSTAT Software (version 10.1; SPSS, Inc.). A single mixed-model repeated-measures 2 × 2 ANOVA was used with condition (EX or RT) as the within-subject factor and group (Lfat/Hfit or Hfat/Lfit) as the between-subject factor. Subjects served as their own controls. When an effect of condition or an interaction between condition and group was significant, post hoc comparisons of means were carried between the conditions in each group using paired Student's t tests in order to verify whether this difference was significant for each group. Lastly, Pearson's correlations were conducted between fitness (VO2max and physical activity) or fatness (fat mass in percentage of weight or kg and FMI) parameters and EC, EI (in absolute or relative data) or macronutrient intake (in percentage or kJ) at lunch, after lunch and over 24 h. Correlations between EC at lunch and over the 24 h were also conducted to determine whether individual differences in EI at lunch were correlated with the daily compensation. All results are expressed as means with their standard errors except for the descriptive characteristics of the subjects (means and standard deviations). Statistical significance was fixed at the 5 % level for all analyses.
Results
Energy expenditure and substrate oxidation during the rest or exercise period
As expected, there were significant effects of condition for EE (P< 0·001), CHO oxidation (P< 0·001), fat oxidation (P= 0·001) and RER (P< 0·001) during the intervention period, all these variables being higher in EX (during exercise) that in RT (during rest). Moreover, there was an interaction between condition and group for EE (P= 0·046). Comparisons (see Table 2) showed that exercise induced a greater EE in the Lfat/Hfit group (2892 (sem 126) kJ) than in the Hfat/Lfit group (2462 (sem 137) kJ) (P= 0·035).
Table 2 Respiratory and metabolic parameters during rest (RT) or exercise (EX) (Mean values with their standard errors)
Lfat/Hfit, low fatness/high fitness; Hfat/Lfit, high fatness/low fitness; EE, energy expenditure; CHO, carbohydrate.
* Mean value was significantly different from that of the RT condition (P <0·05).
† Mean value was significantly different from that of the Lfat/Hfit group (P <0·05).
Motivation to eat
ANOVA revealed no effect of condition or group and no interaction with groups for motivation to eat. Thus, exercise did not alter hunger, desire to eat or gastric fullness according to groups. Therefore, profiles are represented in Fig. 2 for both groups pooled.
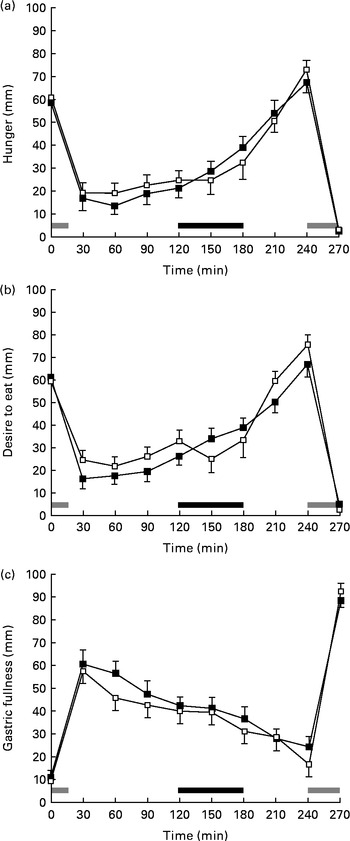
Fig. 2 (a) Hunger, (b) desire-to-eat and (c) gastric fullness scores during the laboratory session in the rest (![]() ) and exercise (
) and exercise (![]() ) conditions. Values are means, with standard errors represented by vertical bars. Both groups are pooled since ANOVA did not reveal any effect of condition or group.
) conditions. Values are means, with standard errors represented by vertical bars. Both groups are pooled since ANOVA did not reveal any effect of condition or group. ![]() , Meals (breakfast and lunch, respectively);
, Meals (breakfast and lunch, respectively);![]() , intervention (i.e. 60 min of exercise or rest).
, intervention (i.e. 60 min of exercise or rest).
Energy and macronutrient intake
There was no effect of condition or group for EI at lunch, but there was an effect of condition for EI after lunch (P= 0·025) and for the 24 h EI (P= 0·013) without interaction with the group factor. EI was actually significantly higher in EX than in RT from lunch to breakfast (8226 (sem 460) and 7607 (sem 426) kJ, respectively) and over the 24 h (13 089 (sem 596) and 12 111 (sem 471) kJ, respectively), and this was significant in each group (Fig. 3). There was an effect of condition for REI at lunch (P <0·001), from lunch to breakfast (P <0·001) and over the 24 h (P =0·002) without interaction with the group factor. REI was actually lower in EX than in RT at lunch (2582 (sem 280) and 4504 (sem 236) kJ, respectively), from lunch to breakfast (5945 (sem 473) and 7607 (sem 426) kJ, respectively) and over the 24 h (10 808 (sem 595) and 12 111 (sem 471) kJ, respectively), and this was significant in each group (Fig. 3).
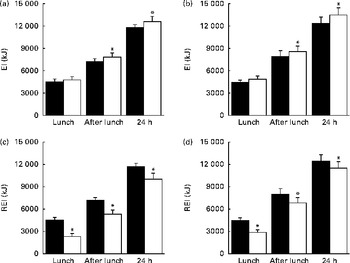
Fig. 3 Energy intake (EI, (a) and (b)) and relative energy intake (REI, (c) and (d)) after rest (RT, ■) and exercise (□) in the low-fatness/high-fitness ((a) and (c)) and high-fatness/low-fitness ((b) and (d)) groups at lunch, after lunch and over 24 h. Values are means, with standard errors represented by vertical bars. REI and EI were similar during the rest session but REI during the exercise session corresponded to EI corrected for the energy cost of exercise above the resting level. *Mean value was significantly different from that of the RT condition (P< 0·05).
There was no effect of condition or group for CHO, fat and protein intakes at lunch. An effect of condition almost reached significance for fat from lunch to breakfast (P= 0·055), and was significant over the 24 h for fat (P= 0·005) and protein (P= 0·027) intakes without interaction with the group factor. Therefore, comparisons were conducted, even for the lunch-to-breakfast period due to the almost significant condition effect, and the results showed that fat intake was actually higher in EX than in RT from lunch to breakfast (77 (sem 5) and 70 (sem 4) g, respectively) and over the 24 h (113 (sem 6) and 103 (sem 5) g, respectively), and this was significant in each group (see Table 3 for values and statistics by group). Protein intake was also higher in EX than in RT over the 24 h (132 (sem 7) and 121 (sem 6) g, respectively). However, this resulted in a higher percentage of EI derived from fat (2·1 (sem 0·6) %, P= 0·026) and a lower percentage derived from CHO ( − 2·9 (sem 0·8) %, P= 0·033) in EX than in RT over the 24 h in the Hfat/Lfit group only.
Table 3 Relative and absolute macronutrient composition of energy intake (Mean values with their standard errors)
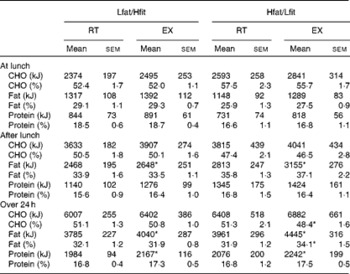
Lfat/Hfit, low fatness/high fitness; Hfat/Lfit, high fatness/low fitness; RT, 60 min of rest; EX, 60 min of exercise; CHO, carbohydrate.
* Mean value was significantly different from that of the RT condition (P <0·05).
Individual data for differences in EI between the RT and EX sessions compared with energy challenge showed that there was a wide variety of EC across subjects (Fig. 4). Considering that a REI reaching at least 75 % of exercise-induced EE was close to complete compensation, eight subjects could be classified as compensators (four in each group). The mean level of EC was not different between the groups (49·8 (sem 16·5) % for the Hfat/Lfit group and 37·8 (sem 24·6) % for the Lfat/Hfit group).
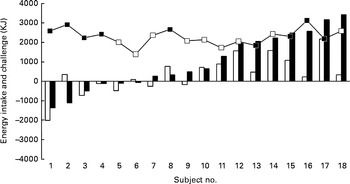
Fig. 4 Individual differences in energy intake between the rest (RT) and exercise (EX) conditions at lunch (□) and over 24 h (■) compared with energy challenge (![]() , low-fatness/high-fitness;
, low-fatness/high-fitness; ![]() , high-fatness/low-fitness). Energy challenge was calculated as energy expenditure during EX minus energy expenditure during RT. If the bar (■ or □) reaches the square, it means that the exercise-induced energy challenge is totally compensated for.
, high-fatness/low-fitness). Energy challenge was calculated as energy expenditure during EX minus energy expenditure during RT. If the bar (■ or □) reaches the square, it means that the exercise-induced energy challenge is totally compensated for.
Correlations showed that fat mass (%, kg or FMI), VO2max and physical activity (h of practice/week) were not associated with EC, EI, REI or macronutrient intake (in % or kJ) either at lunch, between lunch and breakfast or over the 24 h. Interestingly, EC at lunch and compensation after lunch were each highly positively associated with EC over the 24 h (r 0·76, P< 0·001 and r 0·73, P< 0·001, respectively).
Discussion
The present study was based on the hypothesis that overweight but non-obese individuals with a ‘high fatness and a low fitness status’ would show a different level of energy adjustment after an exercise session compared with normal-weight individuals with a low fatness and a high fitness status. On a metabolic basis (more energy stored, less frequent energy depletions), this difference should logically result in a reduced compensation in this population, but the weak effect of exercise to reduce body weight in overweight individuals suggests that the level of compensation occurs with a larger magnitude than expected. The present study was an attempt to assess the effect of ‘body fat and fitness’ levels in subjects not belonging to a clear overweight and sedentary category, in order to avoid biases linked to this status. This is of interest since many individuals willing to lose weight through physical activity (usually planned on the basis of individual relative intensity) might be classified as ‘unfit and high fat’ but not obese or sedentary. Therefore, it is necessary to verify whether such a population is differently vulnerable to compensate for the EE induced by an exercise session. This was a first attempt to verify this hypothesis using a single-session procedure.
Before any intake, exercise did not alter further motivation to eat. After a similar physical workload, aerobic exercise has been reported to reduce hunger ratings in some(Reference Laan, Leidy and Lim11, Reference Westerterp-Plantenga, Verwegen and Ijedema26, Reference King, Burley and Blundell35, Reference King and Blundell40–Reference Broom, Stensel and Bishop44), but not all studies(Reference Finlayson, Bryant and Blundell6, Reference Pomerleau, Imbeault and Parker23, Reference Hubert, King and Blundell45–Reference Imbeault, Saint-Pierre and Almeras51). Thus, this exercise-induced reduction in hunger seems at best short-lived and inconsistent. Therefore, subjects usually initiate their post-exercise meal in a similar state of motivation to eat. However, this indicates that energy deficit due to exercise is not followed by a greater motivation towards EI as a homeostasis model would suggest.
Before discussing EI results, it is important to note that, on average, the energy cost of the exercise session was significantly lower in the Hfat/Lfit subjects than in the Lfit/Hfat subjects. This represents a limitation for interpreting EC, but this difference is usual in studies involving two groups with different anthropometrical characteristics or fitness levels(Reference George and Morganstein14–Reference Harris and George16, Reference Jokisch, Coletta and Raynor18, Reference Lluch, King and Blundell49). This option is often preferred since a fixed EE would induce a very different physiological ‘stress’ between groups and may create a bias if mechanisms vary according to the physical load that an exercise represents for the body. However, this limits any conclusion about an absolute magnitude of EC. For this reason, although results of EI will be discussed, REI is the main discriminant variable, with energy expended being taken into account. Actually, EI at the post-intervention meal was not different between conditions, and therefore no compensation of the energy cost of exercise was found. Therefore, at the end of the meal, REI was similarly reduced in each group. This absence of EC at the meal following the exercise session is in agreement with most previous results observed in adults(Reference Elder and Roberts2, Reference King, Miyashita and Wasse5–Reference O'Donoghue, Fournier and Guelfi9, Reference Westerterp-Plantenga, Verwegen and Ijedema26, Reference Broom, Stensel and Bishop44), although some reported a significant EC in physically active subjects(Reference Laan, Leidy and Lim11, Reference Jokisch, Coletta and Raynor18) or in moderately active women(Reference Pomerleau, Imbeault and Parker23). In overweight and obese subjects, results are highly variable, with EI being reported to be reduced(Reference Ueda, Yoshikawa and Katsura17), similar(Reference Unick, Otto and Goodpaster12) or increased(Reference George and Morganstein14) after an exercise session, compared with the rest condition. However, in most of these studies, including the present study, energy balance based on the energy cost of exercise, compared with the rest session, was negative at the end of the meal that followed exercise. As there was no effect of groups, it seems that this absence of EC is not dependent on the individual ‘fatness and fitness’ status, at least in the ranges selected in the present study. However, since there was a strong correlation between EC at lunch and over the 24 h, this suggests that on an individual basis, subjects who compensated more at the post-exercise meal will show the higher EC within 24 h. This could be a useful predictive factor but would need to be validated in various populations.
Significant EC occurred during the period between lunch and breakfast. There was a significant correlation between compensation during this time period and over the 24 h, suggesting that EC is cumulative over the circadian period.
Similar to previous studies(Reference King, Burley and Blundell35, Reference King, Lluch and Stubbs47, Reference Stubbs, Sepp and Hughes52, Reference Maraki, Tsofliou and Pitsiladis53), we used self-reported food diaries to assess intake between lunch and breakfast on the next day. This is a limitation since diaries are considered to be weakened by under-reporting(Reference Livingstone54). Under-reporting is higher in women, subjects with a low socio-economic status, restrained eaters and obese subjects(Reference Hill and Davies55). In the study herein, subjects were males of similar middle-class, socio-economic statuses, they were unrestrained and the BMI of the Hfat/Lfit group was under the obesity threshold. Moreover, although less accurate than laboratory recording, food diaries are more relevant to typical environment conditions, with improved accuracy when individuals are highly motivated and closely managed as was the case in the present study. The results showed a significant but incomplete compensation of the exercise-induced EE over the 24 h, leading to a highly significant lower REI the day subjects exercised. In a study using similar exercise characteristics but conducted in lean women(Reference Pomerleau, Imbeault and Parker23), EI was higher at the post-exercise lunch than at the post-rest lunch, but was not different any more between the conditions over the 24 h. Although apparently in contrast with the present results, this more probably shows that a partial compensation may occur over the next 24 h with various kinetics specific to the individual. However, compensation levels in the present study were less than 50 % of the energy cost of exercise, and did not preclude REI to be significantly lower the day exercise was performed. Interestingly, after 2 d, King et al. (Reference King, Burley and Blundell35) did not observe any significant compensation of the EE induced by an exercise session performed on day 1.
Recently, in a study conducted with normal-weight women(Reference Finlayson, Bryant and Blundell6), a dissociation between compensators and non-compensators was proposed. Although mean EI was not different at the meal following exercise or rest, the authors have examined the individual data and observed that some participants compensated and even over-compensated for the energy cost of exercise, i.e. energy challenge, whereas other participants did not change their intake or even under-compensated. We analysed our data from lunch and over the 24 h period in the same way, and we found a similar distribution to that reported by these authors, although there was more of a continuity in the compensation magnitudes than a clear distinction between compensators and non-compensators. A similar continuous distribution was recently described in overweight and obese subjects(Reference Unick, Otto and Goodpaster12). Therefore, we believe that it was not possible to separate our subjects into two groups according to their compensation level, and that such a dichotomous distinction deserves more demonstration. Finlayson et al. (Reference Finlayson, Bryant and Blundell6) also reported that compensators tended to have a higher body fat mass than non-compensators, but the difference was not significant. The present results do not argue for a role of this variable in compensation, but fitness level may have altered the response.
Although macronutrient choice was limited to CHO at lunch, both groups increased their fat and protein intake over the 24 h period, supporting a role for these macronutrients in the compensation process. Dietary fats were more specifically increased between lunch and breakfast. Such a fat-specific compensation has been previously reported on the day following 30 min of exercise at 60 % VO2max, but not following 60 min at 30 % VO2max(Reference Klausen, Toubro and Ranneries24). Pomerleau et al. (Reference Pomerleau, Imbeault and Parker23) also found that the increased EI at a buffet-type lunch was associated with increased fat intake. On a longer term (5 weeks), this relative specificity of increase in fat intake has also been reported in women(Reference Ambler, Eliakim and Brasel56). Thus, given the varied procedures and the similarity in the results, it seems that any EI increase following an exercise session may lead to a significant increase in fat intake. In the present study, this dietary fat increase induced an increased higher proportion of fat in the diet in the Hfat/Lfit group only. This suggests that low-fit individuals with a rather high body fatness level may be more vulnerable to this effect. This is important because a positive energy balance has been observed when high-fat foods are consumed after exercise(Reference Tremblay, Almeras and Boer57). Moreover, it has recently been shown that subjects overestimate exercise-induced EE and tended to consume 2- to 3-fold greater EI than necessary when asked to compensate this EE(Reference Willbond, Laviolette and Duval58). Thus, in free-living conditions, a subset of the population may be at risk to compensate for the energy cost of the exercise they practised by targeting high-fat foods at their next meals, due to the enhanced attractiveness of this macronutrient or its sensory characteristics.
Interestingly, all of the short-term observations are also supported in the longer term. Thus, after 5(Reference Staten59), 7(Reference Stubbs, Sepp and Hughes52) or 14 d(Reference Whybrow, Hughes and Ritz21) of daily exercise in lean men or women, only a very small compensation of the energy cost of exercise has been reported. Thus, it seems that the absence of EC observed after a single bout of exercise is not followed by a delayed compensation, and that the negative energy balance is maintained over several weeks of regular exercise. When those who failed to reach expected weight loss (non-responders) and those who succeeded (responders) were separated, non-responders were found to increase their EI in particular from fat at the expense of fruits and vegetables(Reference Caudwell, Hopkins and King60), and showed a preference for sweet, high-fat foods(Reference Finlayson, Caudwell and Gibbons61). Thus, dietary fat influences the effects of exercise on energy balance in the long term.
In conclusion, the present results did not support the hypotheses of a different compensation of the energy cost of an aerobic exercise session between subjects with a ‘high fatness and low fitness’ level and subjects with a ‘low fatness and high fitness level’ over the further 24 h. Both groups displayed an incomplete energy adjustment, mainly due to an increase in dietary fat and protein. Only the composition of the energy compensated slightly differed between the groups, the percentage of energy derived from fat being higher over the 24 h following exercise than rest, in the ‘high-fat and low-fit’ group only. These findings suggest that ‘high-fat and low-fit’ individuals may be more inclined to modify the macronutrient composition of their diet towards a higher proportion of dietary fat. Long-term studies with chronic exercise would, however, be necessary to evaluate the consequences of these results on body weight and fatness.
Acknowledgements
The authors would like to thank the subjects for their participation. The present study received no specific grant from any funding agency in the public, commercial or not-for-profit sectors. K. C. designed the study, managed the subjects, collected and analysed the data and wrote the first draft of the manuscript. D. C. designed and supervised the study, helped to collect the data and wrote the last version of the manuscript. The authors declare no conflict of interest of any kind.


