


1. INTRODUCTION
Greenland, being home to the second largest contemporary ice mass in the world, has a long history of glaciological field investigations. For more than a century glaciologists have studied the climate, the mass budget and the dynamics of ice sheet and glaciers. Recent studies into the mass balance of the ice sheet make extensive use of remote sensing products and large-scale modelling. Investigations aiming at assessing the balance state of the entire ice sheet or large glacier samples provide clear evidence of substantial loss of ice (e.g. Shepherd and others, Reference Shepherd2012; Bolch and others, Reference Bolch2013; Andersen and others, Reference Andersen2015). Surface mass balance calculated from regional climate models indicates that between half to two thirds of the Greenland ice sheet's current mass loss stem from increased meltwater runoff, with enhanced iceberg production accounting for the remainder (van den Broeke and others, Reference van den Broeke2009; Enderlin and others, Reference Enderlin2014).
Evaluating models and remote sensing data against field observations is essential. The most comprehensive intercomparison of the aforementioned surface mass-balance models to date (Vernon and others, Reference Vernon2013), however, revealed an asymmetry in the availability of accumulation and ablation observations. Ice and firn cores in the accumulation area provide over 3000 observation-years across 100 sites. By contrast, only 100 measurements from one single site were available in the ablation area. Naturally, far more ablation-area observations have been performed throughout the history of Greenland glaciological research, but until recently they have been largely unavailable.
Difficulties in accessing data from the ablation area are related to the nature of ablation processes. While in the accumulation zone one could drill and analyse an ice core unravelling 100 a of accumulation history within one field season, the ablation zone requires 100 annual visits to a measuring site to obtain an ablation record of equal length. The melting surface requires repeated re-installation of measuring equipment, which can create inconsistencies and renders measurements in the ablation area labour intensive and costly. Consequently, ablation observations are mostly confined to local projects of shorter duration. Given the crucial role of melt in the ice sheet mass balance, it is paramount to collect these scattered measurements to enable, for instance, model evaluation in a broad spatiotemporal context.
Here we present the first database of surface mass-balance measurements from the ablation area of the ice sheet and the local glaciers dynamically disconnected from the ice sheet. The major purpose of the data collection is to make available quality tested and georeferenced point observations, i.e. predominantly stake readings and snow pit data. The data can be downloaded from http://www.promice.dk. The database also sheds light on an important chapter of the history of Greenland glaciology and is intended to counter the risk of eventually losing data and metadata. We hereby also suggest a methodological framework for editing and archiving point surface mass-balance observations.
2. GREENLAND'S HISTORY OF SURFACE MASS-BALANCE OBSERVATIONS
Greenland spans the latitudes between 59°N and 83°N, has a surface area of 2.16 × 10⁶ km2 and is dominated by the ice sheet (Fig. 1). The ice sheet itself is surrounded by numerous smaller glaciers covering an area of 90 000–130 000 km2, depending on the definition used to delineate ice sheet from local glaciers (Rastner and others, Reference Rastner2012). Combined, the ice sheet and the local glaciers cover 1.81 × 10⁶ km2 or 84% of the surface area of Greenland (Rastner and others, Reference Rastner2012; Citterio and Ahlstrøm, Reference Citterio and Ahlstrøm2013).
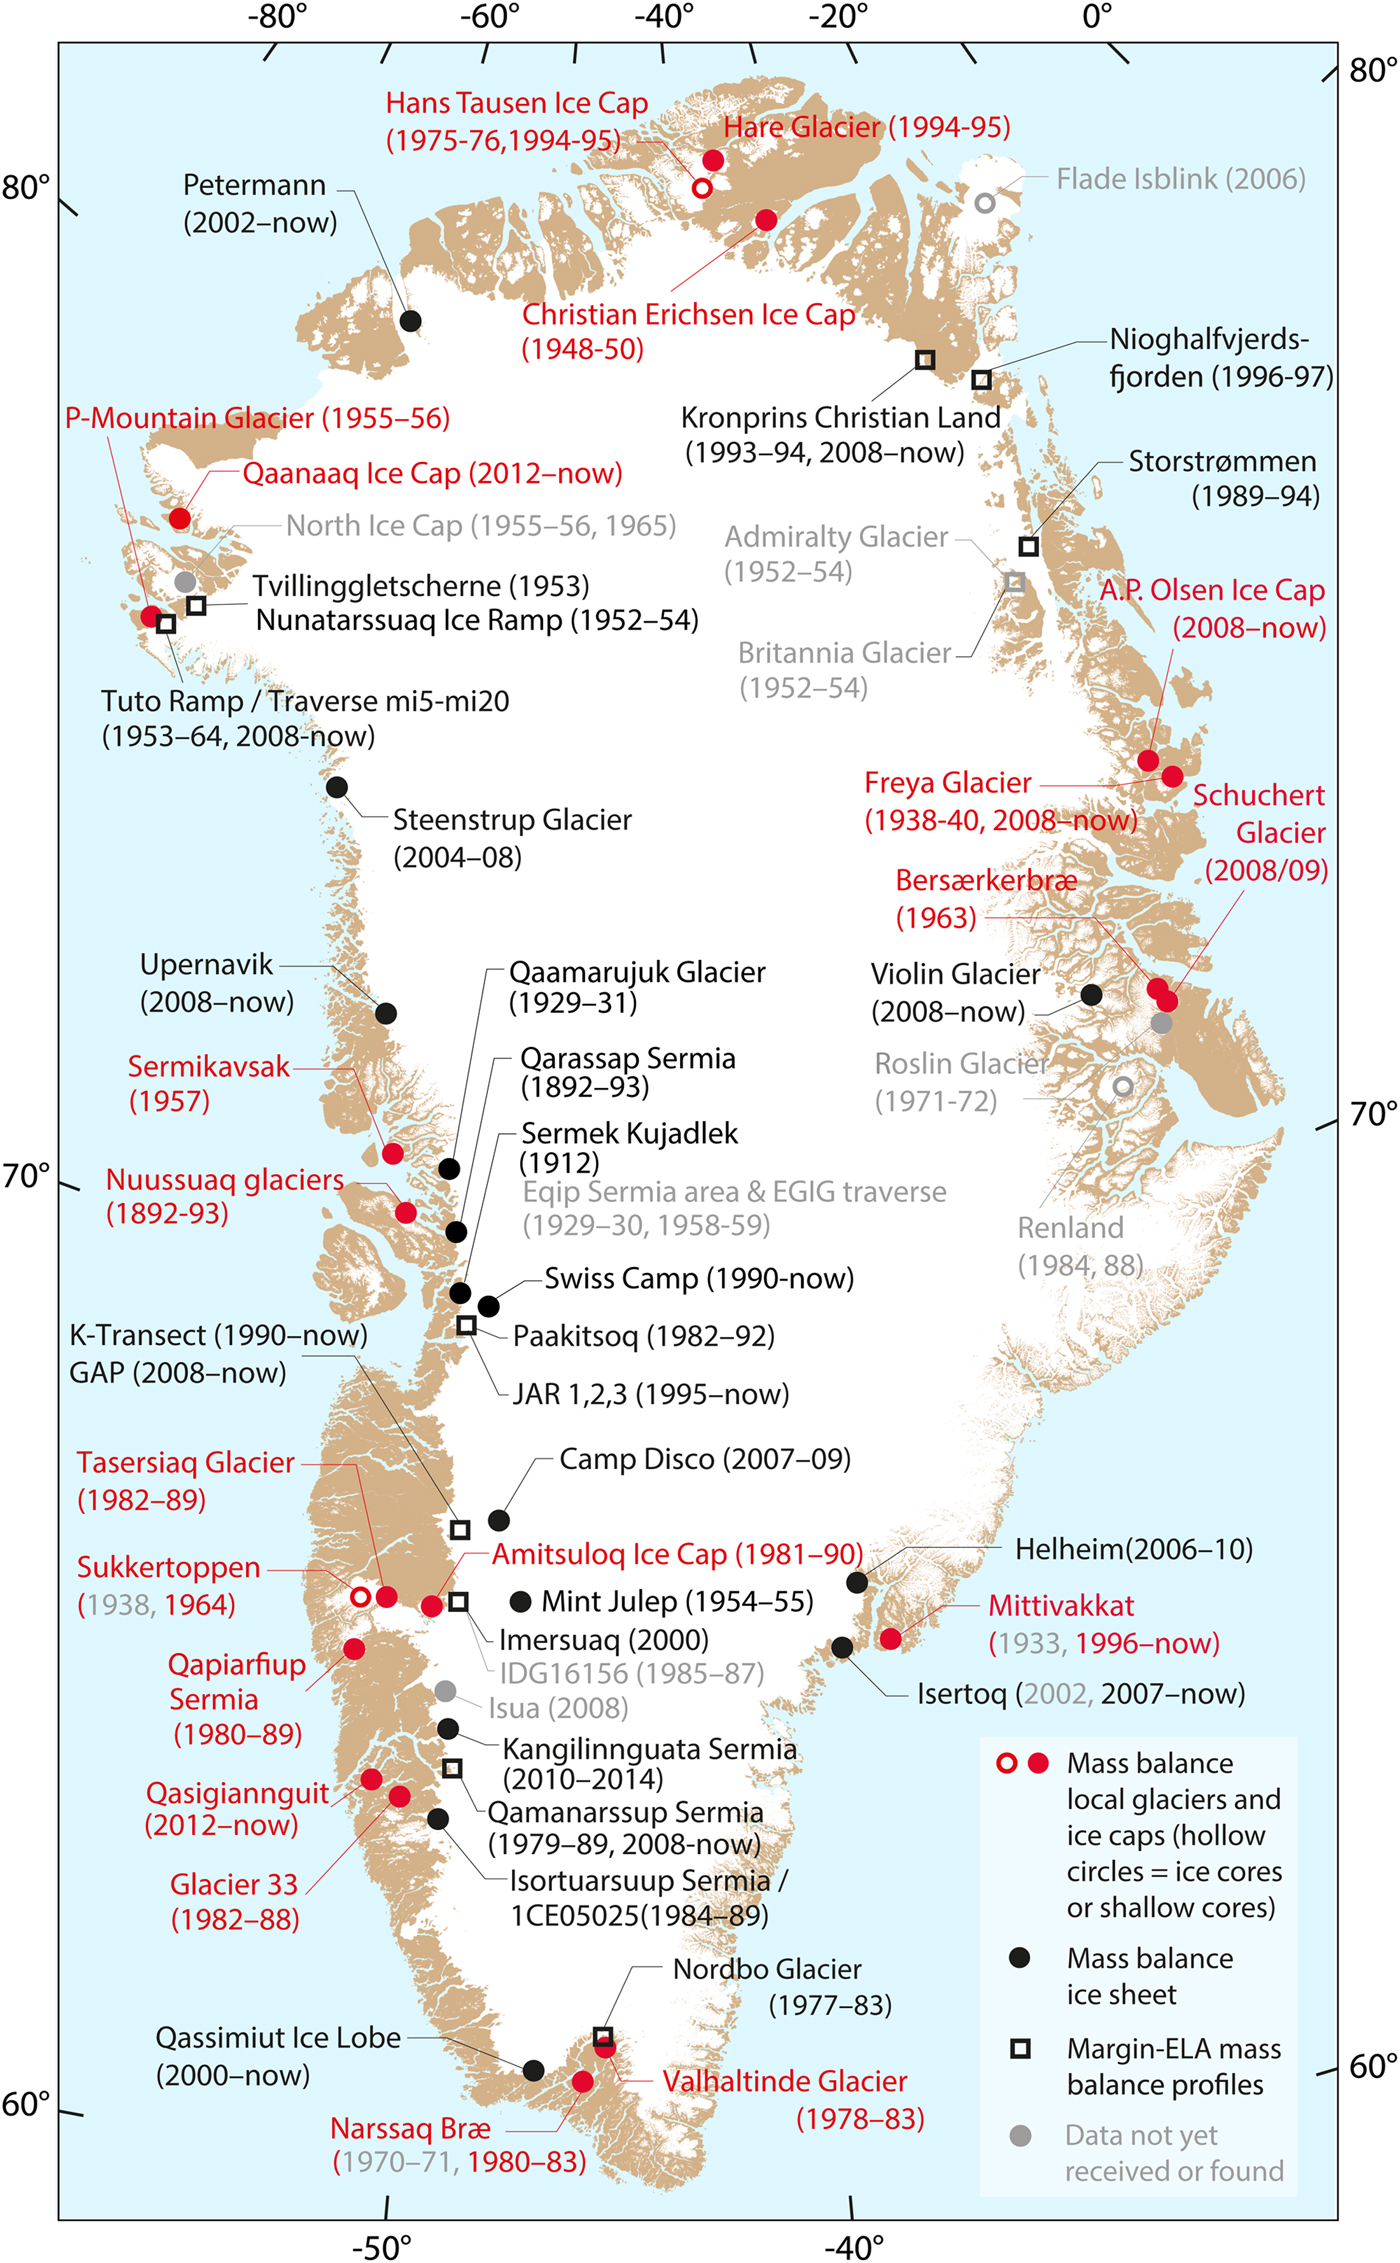
Fig. 1. Map of Greenland showing location and duration of observation of all currently known surface mass-balance sites located in the ablation area of the ice sheet and on the local glaciers (a considerable number of the entries are on the basis of Weidick, Reference Weidick1995).
Documented scientific interest in the ice sheet and its origin dates back to the middle of the 19th century (e.g. Rink, Reference Rink1877, Reference Rink1887) and was soon followed by glaciological exploration (e.g Nansen, Reference Nansen1890; von Drygalski, Reference von Drygalski1897). Early expeditions addressed basic questions such as measuring the surface elevation of the interior of the ice sheet (de Quervain and Mercanton, Reference de Quervain and Mercanton1925), but soon a diverse set of research questions evolved as listed in Fristrup (Reference Fristrup1959)'s overview of glaciological research on Greenland. One of these research questions is the measurement of mass balance, whereby a distinction is made between the actual mass balance, which is the result from surface, internal and basal mass balance as well as ice dynamics, the climatological mass balance (as e.g. measured by Schytt, Reference Schytt1955), which comprises the surface mass balance as well as internal ablation and accumulation (Cogley and others, Reference Cogley2011), and the surface mass balance, which quantifies mass changes resulting solely from surface processes.
2.1. History of surface mass-balance measurements
The mass budget of the ice sheet is among the research questions that were addressed very early on; Hinrich Rink's estimations of the unknown interior of the ice sheet were based on mass budget considerations with focus on iceberg discharge, and led to the first recognition of its vast size (‘at minimum 20 000 square miles’ ( $\sim 1.15 \times {10^6}\;{\rm k}{{\rm m}^2}$
at 1 Danish mile =7.532 km); Rink, Reference Rink1877) and a reasonable estimate of the position of the ice divide (called ‘drainage divide’ by Rink, Reference Rink1877). The same author also measured the velocity of Jackobshavn Glacier, but the oldest preserved measurements of ice sheet and glacier surface mass balance are somewhat younger and date, to our knowledge, from the 1891 to 1893 German expedition under the leadership of Erich von Drygalski (Reference von Drygalski1897). Similar to the second oldest known and preserved ablation dataset (1912, Sermek Kujadlek; de Quervain and Mercanton, Reference de Quervain and Mercanton1925), the measurements were basically a by-product of the determination of ice velocities. While ablation data remain scarce in the early years of Greenland glacier research, accumulation data are more abundant as they have been measured during all of the early crossings of the ice sheet (e.g. The Danish expedition to Dronning Louise Land and across the Inland Ice, 1912–1913; Koch and Wegener, Reference Koch and Wegener1930).
$\sim 1.15 \times {10^6}\;{\rm k}{{\rm m}^2}$
at 1 Danish mile =7.532 km); Rink, Reference Rink1877) and a reasonable estimate of the position of the ice divide (called ‘drainage divide’ by Rink, Reference Rink1877). The same author also measured the velocity of Jackobshavn Glacier, but the oldest preserved measurements of ice sheet and glacier surface mass balance are somewhat younger and date, to our knowledge, from the 1891 to 1893 German expedition under the leadership of Erich von Drygalski (Reference von Drygalski1897). Similar to the second oldest known and preserved ablation dataset (1912, Sermek Kujadlek; de Quervain and Mercanton, Reference de Quervain and Mercanton1925), the measurements were basically a by-product of the determination of ice velocities. While ablation data remain scarce in the early years of Greenland glacier research, accumulation data are more abundant as they have been measured during all of the early crossings of the ice sheet (e.g. The Danish expedition to Dronning Louise Land and across the Inland Ice, 1912–1913; Koch and Wegener, Reference Koch and Wegener1930).
After the Second World War a number of large-scale expeditions were organized, among them the Greenland expeditions of the ‘Expéditions Polaires Françaises’ (EPF, 1949–1953), the ‘Expéditions Glaciologiques Internationale au Groenland’ (EGIG, 1959–1960 and 1967–1968) and the ‘British North Greenland Expedition’ (1952–1954) (Hamilton and others, Reference Hamilton1956). These expeditions also involved surface mass-balance studies, but it is the contemporary US investigations that provided the most extensive, comprehensible and accessible documentation of surface mass-balance observations (e.g. Schytt, Reference Schytt1955; Benson, Reference Benson1996). A focus on the accumulation area is a common characteristic of the aforementioned large-scale investigations, and also of the more recent accumulation measurements in the framework of the Program for Arctic Regional Climate Assessment (PARCA) (e.g. Bales and others, Reference Bales, McConnell, Mosley-Thompson and Csathe2001; Mosley-Thompson and others, Reference Mosley-Thompson2001).
Until recently no coordinated effort targeted the ablation area of the ice sheet or the local glaciers as a whole. Instead, measurements were performed in the framework of numerous local and shorter term studies (Fig. 1). The earliest ablation measurements (von Drygalski, Reference von Drygalski1897; de Quervain and Mercanton, Reference de Quervain and Mercanton1925) were followed by the 1929–31 observations of the Alfred Wegener expedition (Wegener and others, Reference Wegener1933), the 1933 short-term measurements on a number of glaciers in East Greenland (Hasholt and others, Reference Hasholt, van As and Knudsenin press) and the 1939–41 measurements on Freya Glacier, a small mountain glacier in northeast Greenland (Ahlmann, Reference Ahlmann1941). After the Second World War the number of investigations strongly increased, mainly due to the US Army's extended glaciological studies in the vicinity of the Thule Air Base, founded in 1951 in North-West Greenland (e.g. ACFEL, 1955; Schytt, Reference Schytt1955; Griffiths, Reference Griffiths1960; Nobles, Reference Nobles1960). Starting in the 1970s, the Danish GGU (Grønlands Geologiske Undersøgelse, in English: The Geological Survey of Greenland) soon became the institution involved in the largest number of ablation-area studies. During the 1970s and 1980s GGU's glaciological activities were focused on numerous sites in south and central West Greenland and were mostly related to estimating the glacier melt contribution to hydropower potential. GGU's glaciological activities in the 1990s focused on north and northeast Greenland (in collaboration with the Alfred Wegener Institute, Helmholtz Centre for Polar and Marine Research, AWI) and addressed surface mass balance in the context of ice-sheet dynamics as well as climate reconstruction.
None of the aforementioned studies produced surface mass-balance series exceeding 10 a in duration, and there is a general lack of longer-term surface mass-balance series. Only the observations near Kangerlussuaq along the so-called K-Transect (1990–present, initiated during the Greenland Ice Margin Experiment) (Oerlemans and Vugts, Reference Oerlemans and Vugts1993; Van de Wal and others, Reference Van de Wal, Greuell, van den Broeke, Reijmer and Oerlemans2005, Reference Van de Wal2012), on the local Mittivakkat Glacier (1995–now, East Greenland) (Knudsen and Hasholt, Reference Knudsen and Hasholt2008; Mernild and others, Reference Mernild2011) and at Swiss Camp (see the following paragraph) have reached 20 a in duration.
The Program for the Monitoring of the Greenland Ice Sheet (PROMICE), run by the Geological Survey of Denmark and Greenland (GEUS), the successor of GGU, is the first large scale effort focusing on the ablation area of the ice sheet. Observations started in 2007 (Ahlstrøm and others, Reference Ahlstrøm2008; van As and others, Reference van As2011) and automated ablation measurements are currently carried out at ~20 automatic weather stations (AWS) located in eight marginal regions of the ice sheets. The PROMICE network complements the Greenland Climate Network (GC-Net), which started in 1995 (Steffen and Box, Reference Steffen and Box2001) and operates ~15 AWS predominantly located in the accumulation area. Among the ~4 stations located in the ablation area is the so-called Swiss Camp site (Steffen and others, Reference Steffen, Phillips, Colgan and McGrath2010), with a record of continuous measurements starting in 1990 (Steffen and others, Reference Steffen, Phillips, Colgan and McGrath2010; Stober and others, Reference Stober, Rott, Hönes, Grom, Floricioiu and Tijm-Reijmer2015).
2.2. Previous surface mass-balance data collections
The brief historical overview of surface mass-balance observations on Greenland highlights that data are scattered across numerous projects and that there is a need to collect and standardize the data. Accumulation measurements have already been compiled by, for example, Mock (Reference Mock1967a, Reference Mockb); Ohmura and Reeh (Reference Ohmura and Reeh1991) for the purpose of estimating the accumulation distribution over the ice sheet. The same data were later filtered and combined with new measurements to calculate updated accumulation maps (e.g. Jung-Rothenhäusler, Reference Jung-Rothenhäusler1998; Bales and others, Reference Bales, McConnell, Mosley-Thompson and Csathe2001; Cogley, Reference Cogley2004; Bales and others, Reference Bales2009). Two recent efforts, Benson (Reference Benson2013) and the Surface Mass Balance and Snow on Sea Ice Working Group (SUMup; Koenig and others, Reference Koenig, Box and Kurtz2013), aim at compiling accumulation data in tabulated format for the purpose of easy accessibility by the scientific community.
To date no comprehensive compilation of ablation-area data exists. Braithwaite (Reference Braithwaiteunpubl. a) and Weidick (Reference Weidick1984) provide first summaries of surface mass-balance measurements in the ablation area of the ice sheet and on local glaciers. The latter author gives an updated and more comprehensive listing of surface mass balance measuring sites in Weidick (Reference Weidick1995). Six (Reference Six2000) performed a statistical analysis of glacier surface mass-balance data from the northern hemisphere, including data from a number of Greenland sites. Glacier wide mass balance, as well as surface mass-balance profiles and some point data for a few glaciers on Greenland are furthermore available at the World Glacier Monitoring Service (e.g. WGMS, 2015) and summarized by Jania and Hagen (Reference Jania and Hagen1996).
3. DATA COLLECTION
3.1. Focus
The goal of this study is to compile the existing point surface mass-balance observations, from the ablation area of the ice sheet and the local glaciers of Greenland, into a database optimized for ease of use and automated analysis.
Observations are extracted from a multitude of documents detailed below. The source documents reveal not only surface mass balance, but include other data, such as, for instance, measurements of ice velocities and detailed meteorological observations. In accordance with the focus of this study, such data are not considered here.
The surface mass-balance data, contained in the source documents, come in a variety of formats: the temporal resolution of measurements varies from several years to minutes, as measured from AWS. Some authors list uncommented numbers while others provide rich metadata such as, for example, detailed descriptions of snow stratigraphy. To maintain a consistent character of the collected data, the following set of rules was applied:
-
(1) Only point measurements of surface mass balance from the ablation area of the Greenland ice sheet and the ablation and accumulation areas of local glaciers are collected.
-
(2) Preference is given to including a larger number of quality labelled data over a collection restricted to a smaller number of high-quality data. In the latter case, the database would lack information about the rejected data, and users having knowledge of such data would be in doubt whether the data were rejected or have been overlooked.
-
(3) Where available, raw measurements are collected. Virtually all the collected measurements were carried out on so-called floating dates (cf. Cogley and others, Reference Cogley2011). The data are not extrapolated, spatially or temporally, to, for example, a fixed data system (cf. Cogley and others, Reference Cogley2011) or unmeasured locations.
-
(4) Measurement periods should approximately correspond to summer, winter or annual surface mass balance. Where none of the previous exist, also short-term measurements of at least 1 month in duration or multi-annual measurements are permitted.
-
(5) Time periods of measurements at one point are not allowed to overlap and the higher temporal resolution is given preference, i.e. if for one site and 1 a both winter and summer mass balance exist, and consequently annual balance can be calculated, then only summer and winter balance are included in the database.
-
(6) In the few cases where both surface and climatic mass balance (cf. Cogley and others, Reference Cogley2011) are available, preference is given to the former because meltwater retention, included in climatic mass balance, is often estimated rather than measured.
-
(7) Metadata are limited to a number of mostly mandatory parameters as listed in Section 3.4. If the set of mandatory parameters cannot be completed, then a surface mass balance entry is discarded.
To ease access to full background information, the database contains unique links to all source documents. The latter are scanned (if not already available in digital format) and listed in a literature database provided together with the surface mass-balance database.
Focusing on raw data guarantees that these are preserved and become available to the community. While the raw data can be used in evaluating numerical models (e.g. Ettema and others, Reference Ettema2009; Vernon and others, Reference Vernon2013), the disadvantage is that their direct analysis is difficult, as spatiotemporal distribution is not standardized. In order to maintain a clear focus on collecting, archiving and preserving the raw data, spatiotemporally standardizing the data should be addressed in subsequent studies.
3.2. Data sources
Various archives were scoured for documents describing surface mass-balance measurements, people involved in the measurements were contacted for raw data in analogue or digital format, and an internet search was performed. The collected material encompasses a large variety of document types, including hand written notes, expedition reports, technical reports, data reports, digital files, books and peer-reviewed publications. The latter, however, play a minor role since they rarely include raw data in tabulated format together with comprehensive metadata.
3.3. Database structure
Stake readings encompass three hierarchical entities:
-
(1) The measuring site, which can be defined as the area or location target by a project or study. One site contains at least one, but usually multiple, measuring points.
-
(2) Measuring points are the specific stakes, weather stations or locations of snow pits where measurements are performed. They are often being revisited more than once, and consequently with each point several readings are generally associated.
-
(3) The actual reading is defined as the surface mass balance measured at one measuring point over a certain time period.
A strict definition of measuring site is challenging and also not crucial for the purpose of collecting point observations. Examples of measuring sites are the Tuto Ramp (e.g. Davis, Reference Davis1967), the Paakitsoq area (e.g. Thomsen and others, Reference Thomsen, Thorning and Olesen1989) (both on the ice sheet) as well as Hare Glacier (Reeh and others, Reference Reeh, Olesen, Thomsen, Starzer, Bøggild and Hammer2001) or Amitsuloq Ice Cap (Ahlstrøm and others, Reference Ahlstrøm, Bøggild, Olesen, Petersen and Mohr2007) (both on local glaciers). If geographical locations of independent studies are very similar, all measuring points are assigned to a single measuring site. The term reading is illustrated using the most negative annual reading contained in the database: from 10 October 2009 to 18 December 2010, −8.4 m w.e. was measured at the measuring point QAS_L, belonging to the ‘Qassimiut’ site.
The structure of the actual database is flat, and addresses the three hierarchical entities using two layers: a superordinated overview table contains basic information about all measuring sites, and subordinated data tables represent the measuring sites and contain all readings (Fig. 2). The main purpose of the superordinated table is to ease data access. Each measuring site is represented by one data table, which is organized according to the concept ‘one reading = one row in the table’. Information on the measuring points is included as metadata with each reading.
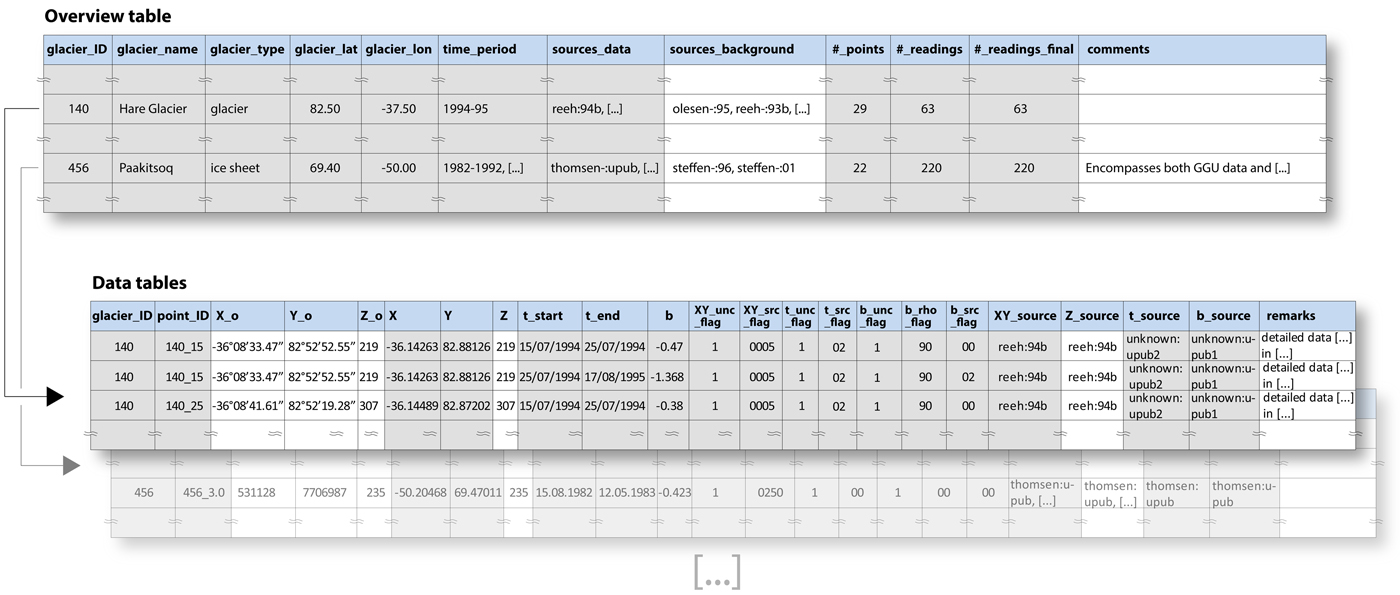
Fig. 2. Schematic illustration of the database structure. Grey shading denotes mandatory fields. If a ‘Z’ (elevation) value is provided, then the field ‘Z_source’ is considered mandatory as well.
3.4. Data fields
Figure 2 shows the data fields every data table is composed of, and Table 1 provides a description of the content and formatting of each field. While the actual readings (field ‘b’) are at the core of the database, metadata are required. It was decided to include a limited number of metadata, to quantify uncertainties as accurately as possible using quality flags and to provide unique links to the sources of each data field. We refrained from including metadata whose availability is generally limited, such as, for example, the material of the stakes used or the type of glacier surface (i.e. snow, firn or ice) at the beginning or ending of a measurement.
Table 1. Description of content and format of all columns of the data tables (cf. Fig. 2)

Each measuring point is assigned a unique identifier (field ‘Point_ID’) composed of the glacier ID and the point name as given in the source. Including the original point name optimizes linkage between database and the source documents. The most important metadata are the edited X and Y geographic coordinates (‘X’ and ‘Y’) as well as start and end dates of each measurement (‘t_start’ and ‘t_end’). All metadata are mandatory except for the edited Z coordinates (‘Z’) and the unmodified X, Y and Z coordinates as given in the original source (‘X_o’, ‘Y_o’ and ‘Z_o’). The ‘X_o’ and ‘Y_o’ entries are optional because older sources show locations on maps rather than providing geographical coordinates. ‘Z’ is optional because ‘Z_o’ in older sources, if provided, is often subject to large uncertainties strongly limiting the informative value.
3.5. Data editing
Data obtained from the original sources were edited as described in the following.
3.5.1. Surface mass-balance values
All data are given in meter water equivalent (m w.e.). Original data (m w.e.) are directly included, data given in meter ice or meter snow are converted to m w.e. if the density is known or if the value refers to ice melt alone, which justifies the assumption of ice density. The latter was assumed to be 900 kg m−3 as this value reflects a slight lowering in density (compared with pure ice at 917 kg m−3) due to air bubble content and the formation of a brittle surface melt crust (e.g. Cogley and others, Reference Cogley2011). Data values from the original sources are never truncated and always entered into the database with the full number of digits (this also applies to data converted to m w.e.). This does not imply a certain level of accuracy, but allows for optimal tracing of the values in the original sources.
3.5.2. Geographical coordinates
All coordinates are provided in latitude/longitude WGS 84, decimal degree format. Where coordinates are available and considered reliable they were converted and added to the database. Limited availability of coordinates from the pre-GPS era required a major effort to reconstruct geographical locations. Older sources often show locations on maps of varying detail and quality. To obtain approximate coordinates these maps were georeferenced against a number of spatial datasets: DEMs, digital maps, glacier polygons (Rastner and others, Reference Rastner2012; Citterio and Ahlstrøm, Reference Citterio and Ahlstrøm2013; Howat and others, Reference Howat, Negrete and Smith2014; Noh and Howat, Reference Noh and Howat2015), as well as Landsat imagery. Figure 3 shows an example of how such data were combined to assess point locations from a map. For certain older sites (e.g. Nordbo Glacier and Qamanarssup Sermia) accurate coordinates referring to a local reference system exist, but the linkage to a global system is missing. In such cases local coordinates are included under ‘X_o’ and ‘Y_o’, while ‘X’ and ‘Y’ are derived from maps. In most cases only one set of coordinates per measuring point could be established and hence the movement of the measuring point through time is not taken into account. Where more than one set of coordinates exist and the dates of the measurements are known, the respective coordinate values are assigned to the readings with the closest dates. It is often unknown whether, upon replacement, stakes were set back to their initial location to compensate for ice flow, or whether they were redrilled at their current location. Unambiguous coordinates exist only for the few sites with annual measurements of geographical positions.
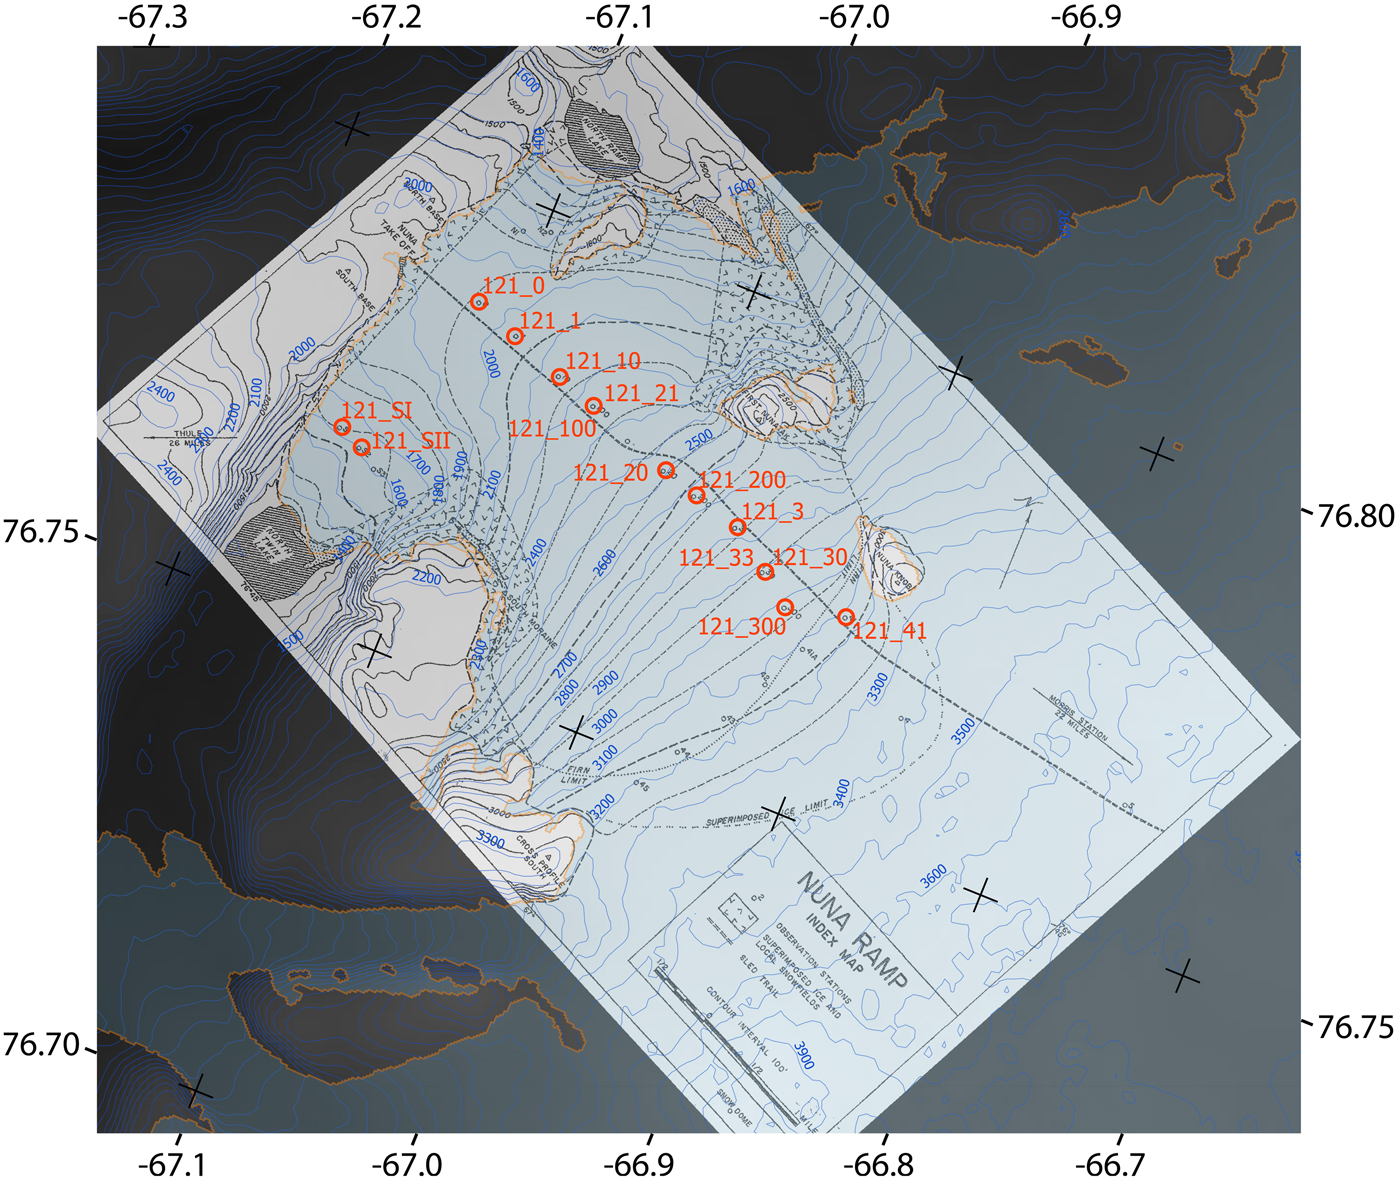
Fig. 3. Map of Nunatarssuaq Ice Ramp (Nobles, Reference Nobles1960) georeferenced against GIMP 30 m resolution DEM (hillshade in the background and blue elevation contours in feet; Howat and others, Reference Howat, Negrete and Smith2014) and ice-sheet margin according to Rastner and others, Reference Rastner2012 (blue polygon with orange outline). The georeferenced points and their names, as listed in the database, are shown in red.
3.5.3. Surface elevation
Surface elevation is always taken from the original source, and the edited ‘Z’ entry is intended to reflect height above the Earth's EGM96 geoid. Surface elevations, however, are subject to relatively large uncertainties. In most cases it is unknown whether measurements refer to an ellipsoid or a geoid and also the specific geoid or ellipsoid is not specified. Furthermore, accurately measuring elevation on the ice sheet in the pre-GPS era was a major challenge, sometimes becoming manifest in contradictory height information (e.g. initial estimates of surface elevation of measuring points at the Paakitsoq site differ from later and more precise measurements by up to 140 m, (cf. Thomsen, Reference Thomsen1984, Reference Thomsenunpubl.)). If an elevation is considered unreliable, a ‘Z_o’ value is provided but ‘Z’ is left empty. Often both ‘Z_o’ and ‘Z’ are empty as numerous sources do not provide any elevation data. We refrain from deriving missing surface elevations from DEMs because ice-surface elevation is subject to changes. Recent DEMs (e.g. the GIMP DEM; Howat and others, Reference Howat, Negrete and Smith2014) might be of limited representativeness for the time of measurements.
3.5.4. Dates
All dates are given with 1 d precision in dd.mm.yyyy format. In consecutive readings the starting date is always considered identical to the end date of the previous reading. This is done because the time of a day a reading has been performed is rarely known. It appears reasonable to assume that readings start and end at noon of a given day. When and where available, dates from the original source were used. Numerous sources, however, state only that measurements refer to ‘winter balance’, ‘summer balance’ or a certain year. In some cases, a reconstruction of the dates was possible from other pieces of information. Where this was not possible, yet it is clear that readings refer to the concept of the hydrological year, it is assumed that summer and winter/annual balance start at the end of May and at the end of August respectively. Dates based on such assumptions are flagged with correspondingly high uncertainties.
The archiving framework follows modern-day terminology according to Anonymous (1969); Cogley and others (Reference Cogley2011). As outlined by Braithwaite (Reference Braithwaiteunpubl. a), terminology of the oldest literature sources differs by, for example, the use of the term ablation to denote surface mass balance in the ablation area. Such differences were taken into account when working with old literature sources. It was also noted, throughout the entire literature, that observations labelled summer or winter balance often only loosely refer to the seasons. To guarantee safe arrival at, and return from, remote field sites, measurements are generally started in early summer when winter snow at lower elevations has already melted, and are ended before the onset of the accumulation season. As a consequence, ‘seasonal’ measurements from certain field sites (mainly northeast Greenland) often do not represent winter and summer balance in a strict sense.
3.6. Quality management
For a few sites (e.g. Qamanarssup Sermia; Braithwaite, Reference Braithwaite1986; Braithwaite and Olesen, Reference Braithwaite and Olesen1989) quality assessments are available and the information therein was used to flag suspicious measurements. However, comprehensible uncertainty estimates also need to be provided for the vast majority of data points (i.e. the surface mass-balance readings and the related metadata) lacking such information. The following measures were implemented to achieve this goal.
-
(1) A series of quality criteria was applied during the process of data editing as outlined in the previous section, and certain metadata were declared mandatory (see Section 3.4). Data not complying with these basic criteria were rejected, likely avoiding the most uncertain entries.
-
(2) The surface mass-balance values and the related metadata all receive quality flags describing; (i) the format and level of detail of the information in the original sources, (ii) the transformation performed for compliance with the database format and (iii) the estimated uncertainty of the database entry (following section). The quality flags allow filtering the data prior to use and thus the database can contain entries of varying levels of quality.
-
(3) The information content of quality flags needs to be limited to remain comprehensible and to ease their application in automated filtering. Important information not fitting the format of the quality flags is included in the ‘remarks’ field. Access to complete meta information is secured by linking each piece of information to its source. Where required, the user can thus access additional information, reproduce the data, make an own quality assessment or compare with other sources.
3.7. Uncertainty assessment
The database specifies uncertainties of surface mass balance, geographical coordinates and measuring dates through quality flags. The criteria of the uncertainty assessment are outlined in the following.
3.7.1. Surface mass balance
Error sources in point surface mass-balance measurements have been discussed in the literature (e.g. Bauer, Reference Bauer1961; Østrem and Brugman, Reference Østrem and Brugman1991; Braithwaite and others, Reference Braithwaite, Konzelmann, Marty and Olesen1998; Fausto and others, Reference Fausto, Van As, Ahlstrøm and Citterio2012). Thereby two types of errors are distinguished: (1) measurement can be flawed by erroneous readings. Sources of this type of error are diverse and comprise, for example, wrong measurements, floating, submerged or melting-out of stakes, undulations in the surface a stake is placed in, erroneous density measurements or conversions, as well as a variety of sensor issues at AWSs; (2) the second type of error is related to assuming a measuring point to be representative for a certain area of a glacier. As most stake networks are ‘sparse’ (cf. Braithwaite, Reference Braithwaite1986), areas of assumed representativeness can reach many square kilometres. Sparse networks are generally capable of capturing large-scale variability in surface mass balance, but representativeness is nevertheless limited as measurements are also influenced by surface mass-balance variability on smaller scales. Maintaining a network dense enough to quantify and filter out small-scale variability is generally not feasible, and thus the deviations between measurements and the unknown, truly ‘representative’ values are treated as an error.
Type (1) errors depend on the quality of the individual data contained in the database. Type (2) errors affect all data and are assumed to be of more similar magnitude among measurements. Separating the contributions of the two types of errors to overall measuring uncertainties is challenging. Uncertainty is thus addressed as follows: each surface mass-balance entry is assigned an uncertainty value (field ‘b_unc_flag’; m w.e.), which provides an estimate of additional uncertainty related to Type (1) errors. ‘Additional’ thereby refers to the influence of any extra sources of Type (1) measuring errors, as compared with data of optimal quality. Consequently ‘b_unc_flag’ is set to zero for good quality data. Only few sources quantify measuring uncertainties, and thus most estimates of ‘b_unc_flag’ are based on subjective evaluations of data quality. It is furthermore noted that the collected data generally refer to surface mass balances. Any internal accumulation that takes place below the ice surface (in the case of ablation measurements) or below the bottom of a snow pit (in the case of accumulation measurements) is neglected and also not treated as contributing to Type (1) errors.
Total uncertainties from the combined effect of Type (1) and (2) errors are not quantified in the database as their calculation would require the existence of stake farms (Braithwaite and others, Reference Braithwaite, Konzelmann, Marty and Olesen1998), which is rarely the case. To nevertheless suggest a range of plausible total uncertainties, the measurements at Nordbo Glacier stake farm are analysed in the context of other literature sources (see Section 5.1).
Older measurements, in particular, involve an additional error source that is difficult to characterize as either Type (1) or (2): the ice movement requires stakes to be redrilled at their initial positions to prevent measurements becoming biased due to the downhill movement of the stake location. Measuring coordinates was challenging in the pre-GPS era and thus in many cases, such as on Qamanarssup Sermia (Braithwaite, Reference Braithwaite1986), stakes were replaced at their current locations. The aforementioned glacier is relatively steep and ice flow velocities reach 250 m a−1. This means horizontal movement over the total observation period of 7 a translates, in the steepest sections of the glacier, into a lowering of measuring points of almost 100 m. Given the surface mass-balance gradient at the glacier (~0.004 m w.e. m−1 a−1) a bias of almost 0.4 m w.e. in measured annual surface mass balance can result. Given the high flow speed, steep slope and the relatively long observation period, the example likely represents a maximum estimate of this type of error. Currently the data are not corrected for this type of error.
3.7.2. Geographical coordinates
Each geographical location, specified by the two fields ‘X’ and ‘Y’, is assigned an uncertainty (‘XY_unc_flag’; m). Uncertainties refer to one standard deviation and are quantified directly where the measuring method is known. For instance handheld GPS devices are assigned an uncertainty of 5 m. Uncertainties of coordinates derived from georeferenced maps are based on a qualitative assessment of the accuracy of the map and the georeferencing. Furthermore, uncertainties of measuring points denoted on maps are considered smaller for points in structured terrain (e.g. on a narrow glacier tongue) and larger for featureless locations (e.g. higher elevations on the ice sheet).
Positions of measuring points are shifting due to ice movement. However, for most measuring points only one location is known, and in many cases a time stamp is missing. Furthermore, it is often unknown whether stakes have been redrilled at their initial or current locations. For simplicity, uncertainties in the geographical position refer only to the given locations and do not consider the aforementioned issues related to ice movement.
3.7.3. Dates
Start and ending dates (‘t_start’ and ‘t_end’) are assigned a common uncertainty value (one standard deviation, field ‘t_unc_flag’) quantified in days. The uncertainty is set to zero where exact dates are given. A value of typically 2 d is chosen if measurements have been carried out over a time period of a few days, but are summarized in the source document under a common date. Where it is only known that measurements refer to summer or winter balances, starting and ending dates are set to either 1 May or 1 September and uncertainty is typically chosen to be 15 d. The starting point of the time period represented by accumulation measurements in snow pits is often not exactly known as the time stamp of the previous summer surface can be subject to ambiguity. Consequently, snow pit data are assigned a temporal uncertainty of 10–15 d.
4. DATA ANALYSIS
4.1. Data overview
At the time of publication the database contains 2961 readings from 633 unique measuring points. Figure 1 and Table 2 illustrate the locations and provide basic information for all 53 measuring sites known to the authors. For seven sites no data were found or the available data were considered unsuitable. The readings presently included in the database stem from the remaining 46 sites.
Table 2. Overview of all currently known surface mass-balance sites located in the ablation area of the ice sheet and on the local glaciers. Field sites for which readings have been included are highlighted in bold, sites that are lacking any readings are in italic
Numerous institutions contributed to the measurements as listed in the Appendix. Approximately 60% of the data have been derived through projects headed by GEUS/GGU, Denmark. Another important contributor to the database is the US Army through a number of its research and engineering institutions who worked mainly in north-west Greenland. The Institute for Marine and Atmospheric Research Utrecht (IMAU) at Utrecht University, The Netherlands, established the longest uninterrupted time series of ablation-area measurements along the so-called K-Transect.
Roughly half of all readings have not been published before and were therefore inaccessible to the broader scientific community. Data previously published are mostly contained in grey literature, which can also be difficult to access.
Half of the measurements were carried out on the ice sheet. Seasonal surface mass balance readings account for 61% of all readings, annual balance for 36%, short-term readings for 2% and multi-annual readings for 1%. A majority (56%) of the seasonal readings are summer balances. The duration of all readings adds up to 2064 measurement-years and thus exceeds the number of measuring years of ablation-area data used by Vernon and others (Reference Vernon2013) by an order of magnitude.
4.2. Spatial and temporal coverage of the data
Figure 4 illustrates the spatial and temporal coverage of the collected data. Over the 123 a (1892–2015) almost all coastal areas of Greenland have been subject to surface mass-balance observation. Only larger sections of the south eastern coast remain unmeasured.
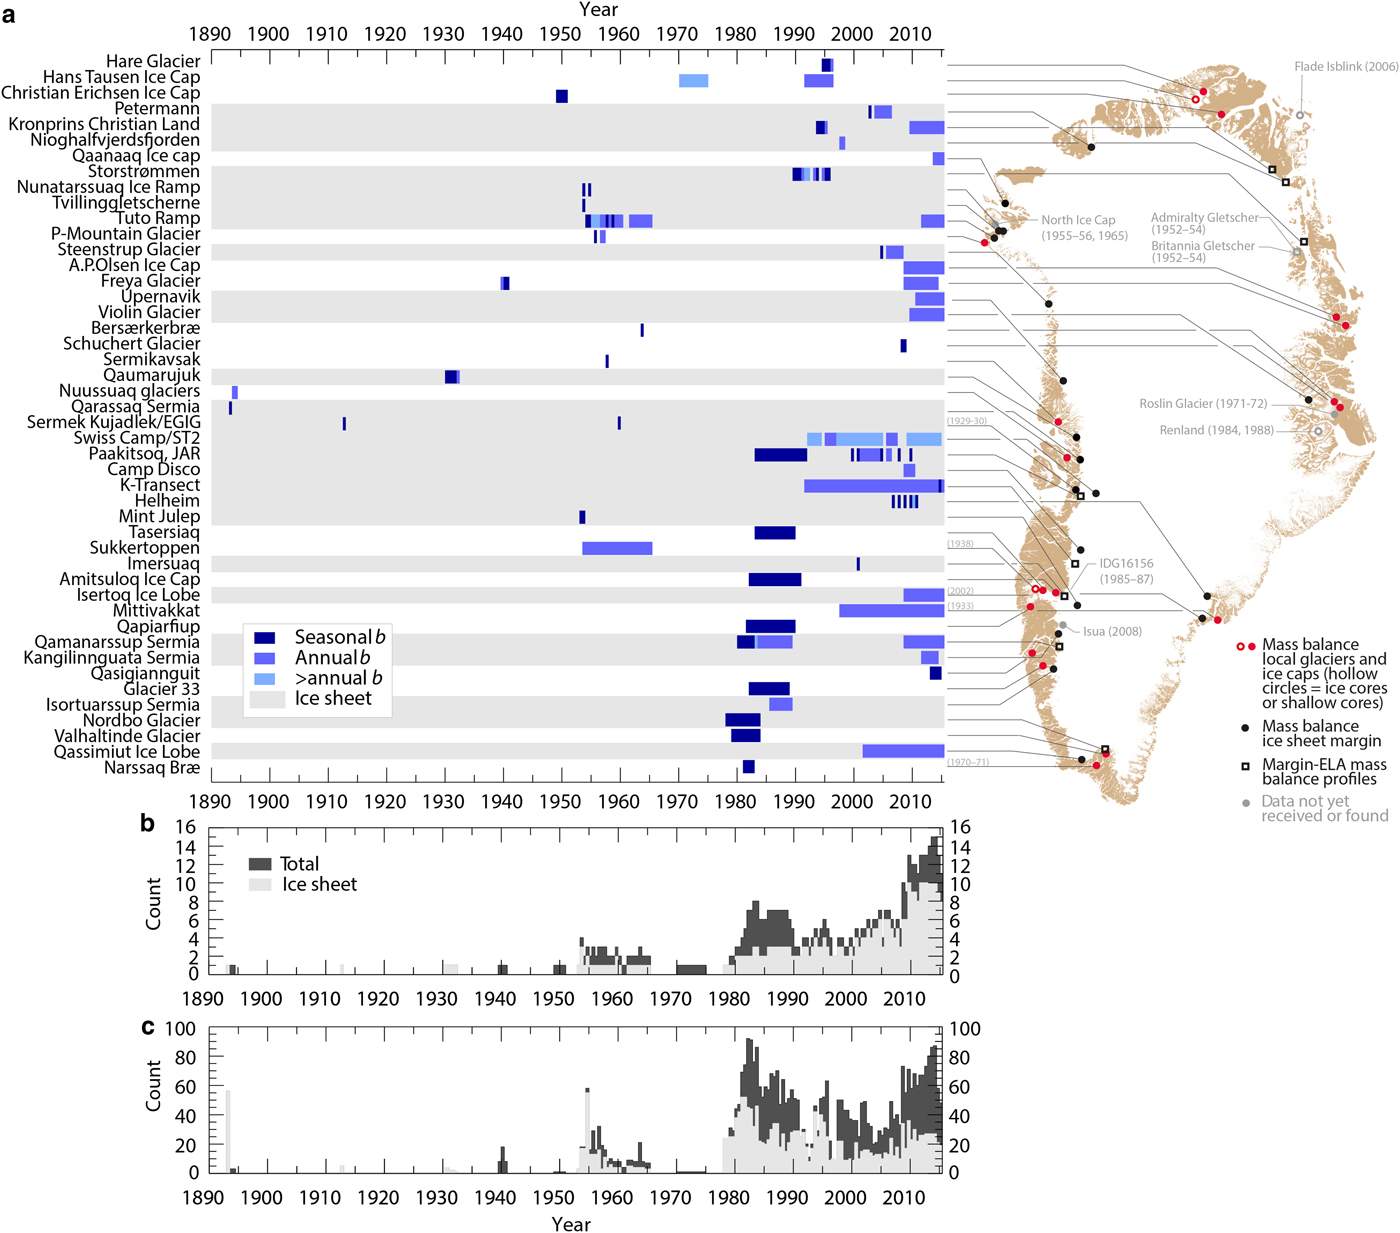
Fig. 4. Overview of the data currently contained in the surface mass-balance database. (a) Temporal availability of data for each site and temporal resolution of the data. (b) Number of active measuring sites over time. (c) Number of active measuring points over time.
The very early measurements were carried out in central west Greenland. Driven by US-Army research, the focus shifted to the north-west in the 1950s. Planning of hydropower plants has been the major funding source of extensive surface mass-balance measurements in the 1970s and 1980s. The measuring networks have been maintained by GGU and are clustered along the most densely populated south and south-western section of the coast. The 1990s saw extensive observations performed in the north and northeast, again with strong involvement from GGU. With the start of the PROMICE program in 2007 the ice-sheet ablation area is for the first time monitored in many regions simultaneously.
4.3. Data quality
The aforementioned issues related to establishing coordinates (Section 3.5) are reflected in only 43% of all entries having geographical positions with an accuracy better than 100 m. For comparison, 78% of all dates are considered accurate (uncertainty of ±2 d or better) and 82% of all readings are considered reliable (additional uncertainties are estimated at 0.1 m w.e. or less). Although not declared mandatory, 86% of all readings contain surface elevations (‘Z’ field). For reasons stated in Sections 3.4 and 3.5, however, it is recommended that original sources be consulted prior to using elevation data.
5. GLACIOLOGICAL INTERPRETATION
5.1. Representativeness of the data
Using the collected data requires knowledge of their uncertainties. As outlined in Section 3.7, two basic sources of uncertainty are distinguished. Their combined effect can only be quantified where measuring points are spaced densely enough to assume their mean value approximates an unknown truly representative value. Here we quantify total uncertainties on the example of Nordbo Glacier (Fig. 1) where summer and winter balance was measured in a farm of 22 stakes (Fig. 5). The stake farm covered an area of ~ 1.8 × ~1.8 km and was maintained over six consecutive hydrological years (1977/78–1982/83). Summer and winter balance was measured over the full 6 a at 14 stakes and during 4 a at the remaining eight stakes.
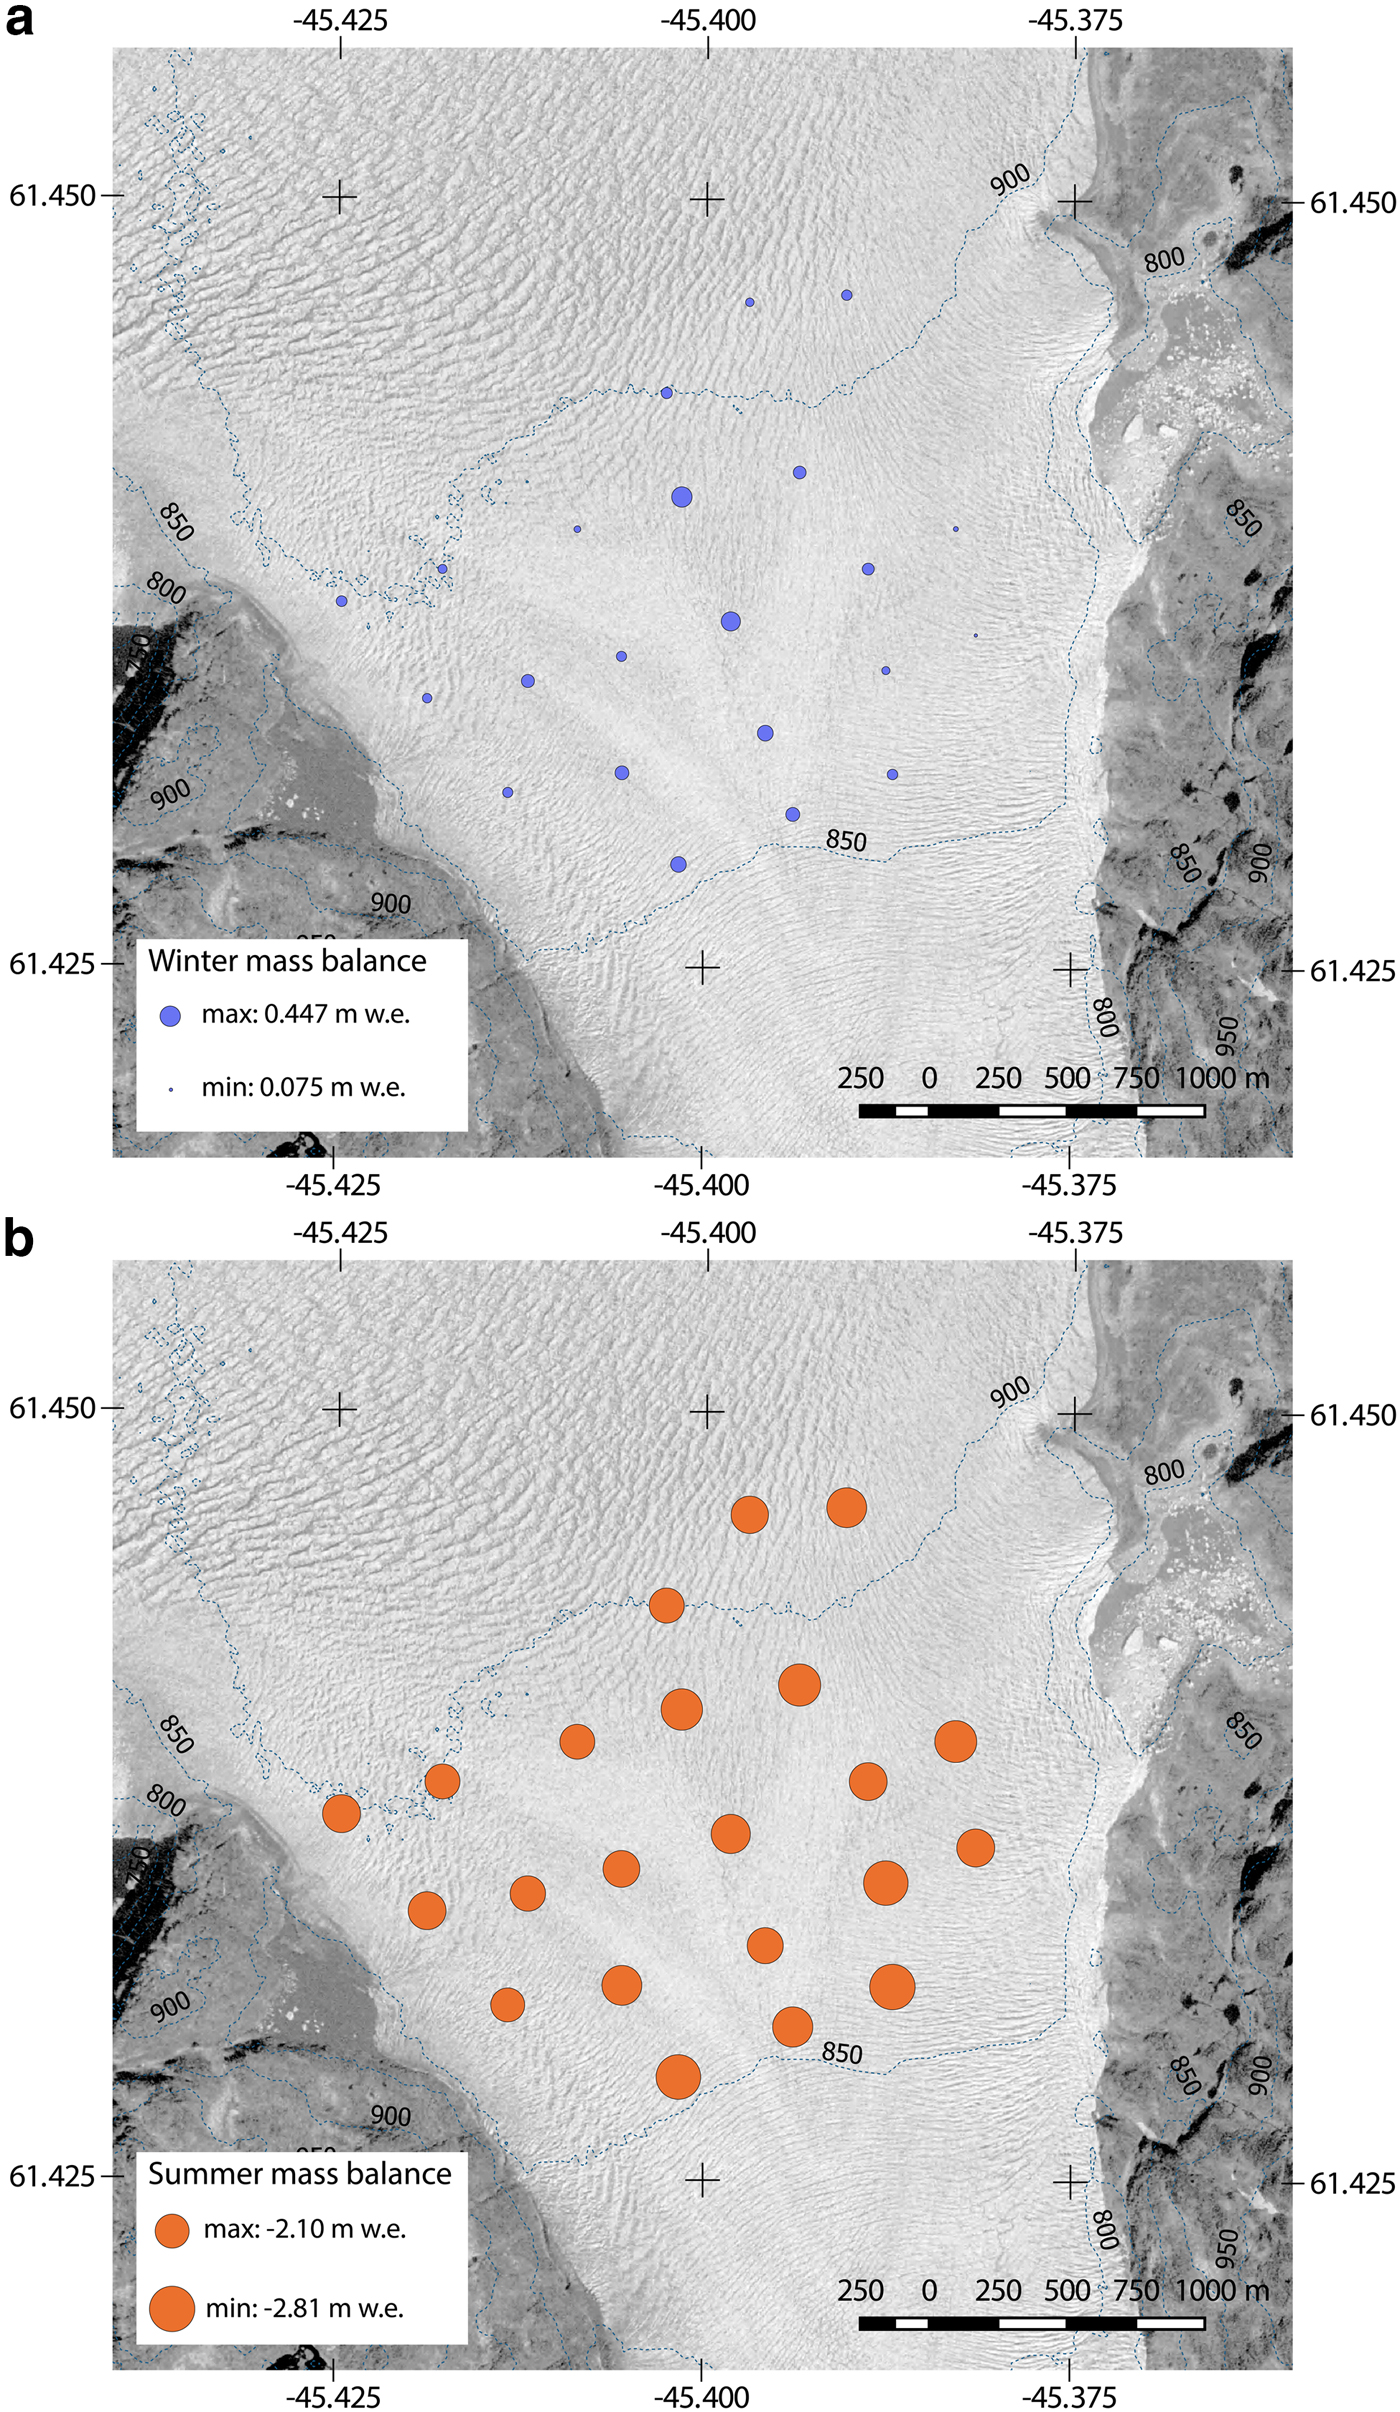
Fig. 5. Variability of surface mass balance within a farm of 22 stakes on the tongue of Nordbo Glacier: (a) Mean winter surface mass balance. (b) Mean summer surface mass balance. The observation period encompasses the 6 hydrological years from 1977/78 to 1982/83 and at all stakes at least four summer and four winter balance values have been recorded. The characteristics of the glacier surface are illustrated with elevation contours (blue) and an aerial orthophoto from the year 1987 (Korsgaard and others, Reference Korsgaard2016).
We calculated a series of 18 variograms applying the R-function ‘variog’ (Cressie, Reference Cressie1993) to summer, winter and annual mass-balance readings of each hydrological year. Furthermore, three variograms were calculated for the average summer, winter and annual mass-balance readings. In each variogram the sill was estimated using the R-function ‘variofit’ (Barry and others, Reference Barry, Crowder and Diggle1997). The standard deviation was calculated according to $\sigma = \sqrt {sill} $
. All calculated standard deviations are shown in Table 3. Most variograms indicate a limited or almost no spatial autocorrelation between the mass-balance readings. In three cases (marked with an asterisk in Table 3), an unrealistically high sill was estimated. In these cases, the sill was replaced by the variance of the data without the use of geostatistics.
$\sigma = \sqrt {sill} $
. All calculated standard deviations are shown in Table 3. Most variograms indicate a limited or almost no spatial autocorrelation between the mass-balance readings. In three cases (marked with an asterisk in Table 3), an unrealistically high sill was estimated. In these cases, the sill was replaced by the variance of the data without the use of geostatistics.
Table 3. Variability of winter, summer and annual balance measurements across the Nordbo Glacier stake farm. For each category the number of stake readings n and the average $\overline b $
(m w.e.) of all available mass balance readings is provided. σ (m w.e.) corresponds to
$\overline b $
(m w.e.) of all available mass balance readings is provided. σ (m w.e.) corresponds to $\sqrt {sill} $
of the semivariograms or to the standard deviation calculated without the use of geostatistics (marked with an asterisk)
$\sqrt {sill} $
of the semivariograms or to the standard deviation calculated without the use of geostatistics (marked with an asterisk)
The results are interpreted as follows: if annual surface mass balance measured at only one stake would be considered representative for the area covered by the stake farm, then this single measurement falls with a probability of 68% within ±0.28 m w.e. of the truly representative value. Thereby annual averages over all stakes are assumed to be the truly representative values and ±0.28 m w.e. a−1 is the average of all six annual standard deviations. The latter, however, vary substantially from 0.17 to 0.45 m w.e. a−1 (Table 3). At the cost of reduced temporal resolution, uncertainty could be slightly reduced by temporal averaging (i.e. to 0.24 m w.e. a−1 for the mean annual balance over the 6 a period). The location of the aforementioned single stake is of limited importance as there appears to be no systematic pattern in annual and summer balance distribution. Winter balance, in contrast, is subject to a spatial pattern with systematically higher values along the centre line of the glacier (Fig. 5a). This pattern, however, cannot be generalized as snow accumulation is controlled by local topography and surface properties (e.g. Machguth and others, Reference Machguth, Eisen, Paul and Hölzle2006; Taurisano and others, Reference Taurisano2007). Prior knowledge of site-specific accumulation patterns (cf. Sold and others, Reference Sold2016) is beneficial for choosing sparse measuring points representing average accumulation.
Braithwaite and others (Reference Braithwaite, Konzelmann, Marty and Olesen1998) list a selection of studies having analysed errors in surface mass-balance measurements. Bauer (Reference Bauer1961), for instance, quantifies variations of a 2-month (summer) melt record at six stakes on the Greenland ice sheet to be ±0.23 m w.e. Values in the range of ±0.2 m w.e. a−1 to ±0.4 m w.e. a−1 for annual balances are given in other studies (Lliboutry, Reference Lliboutry1974; Braithwaite, Reference Braithwaite1986; Cogley and others, Reference Cogley, Adams, Ecclestone, Jung-Rothenhäusler and Ommanney1996). Notably, these values have been derived using various calculation approaches and are based on measurements covering both Arctic and Alpine sites. Uncertainties calculated for the Nordbo Glacier stake farm lie within the same bounds. Thus it appears justified to adopt values in the range of 0.2–0.4 m w.e. a−1 as a first order approximation of the basic level of uncertainty in point measurements of surface mass balance. Uncertainty estimates have to be adjusted, for example, if the measured quantity is on average very small (e.g. accumulation measurements at low-accumulation sites).
5.2. Surface mass-balance profiles
Elevation profiles of surface mass balance have earlier been shown for a few areas of Greenland by, for example, Ambach (Reference Ambach1979); Reeh (Reference Reeh1991); Weidick (Reference Weidick1995). Here we use the collected data to provide a first comprehensive overview of surface mass-balance profiles for all major regions of Greenland.
Stake networks vary over time and are often irregularly spaced in elevation. These issues need to be addressed to derive surface mass-balance profiles that are smooth enough to remain readable when plotted against other profiles. To reduce the influence of individual years we first filter out all measuring points that have been measured during <50% of the total duration of a time series. In a second step we divide the elevation extent of each surface mass-balance network into 100 m intervals and average all readings falling into the same intervals. Linear interpolation is subsequently used to generate values for elevation intervals lacking observations. The resulting profiles can still look jagged and are smoothed by first increasing the vertical resolution to 50 m (using linear interpolation), followed by moving window (three 50 m elevation intervals) averaging.
We select sites where annual balance values are available and elevations of measuring points are considered reliable and reasonably well distributed over the elevation extent of the network. Eventually surface mass-balance profiles for 17 sites are calculated and displayed in Figure 6. Six selected profiles are also visualized in Figure 7 together with the mean annual mass balances at the individual measuring points. While the point values are generally well represented by the profiles, Figure 7 also shows that point measurements carried out at similar elevations on a glacier deviate to a certain degree (see also Section 5.1).
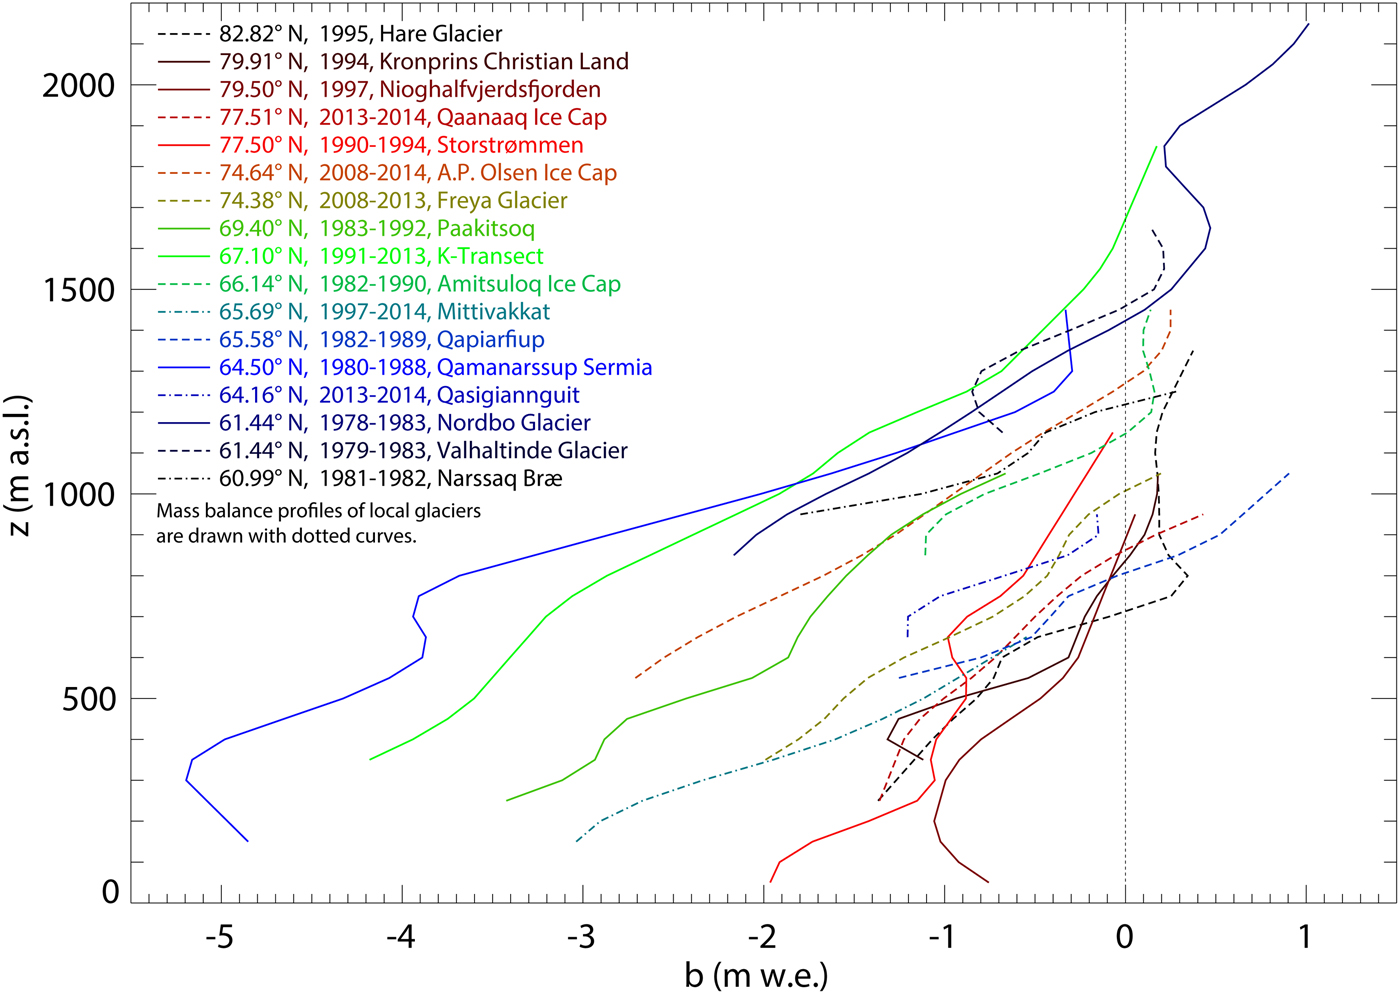
Fig. 6. Mean annual surface mass balance profiles for 17 sites in Greenland. Note, the figure illustrates qualitative differences in balance profiles, any quantitative comparison is hampered by differing time periods of measurements.
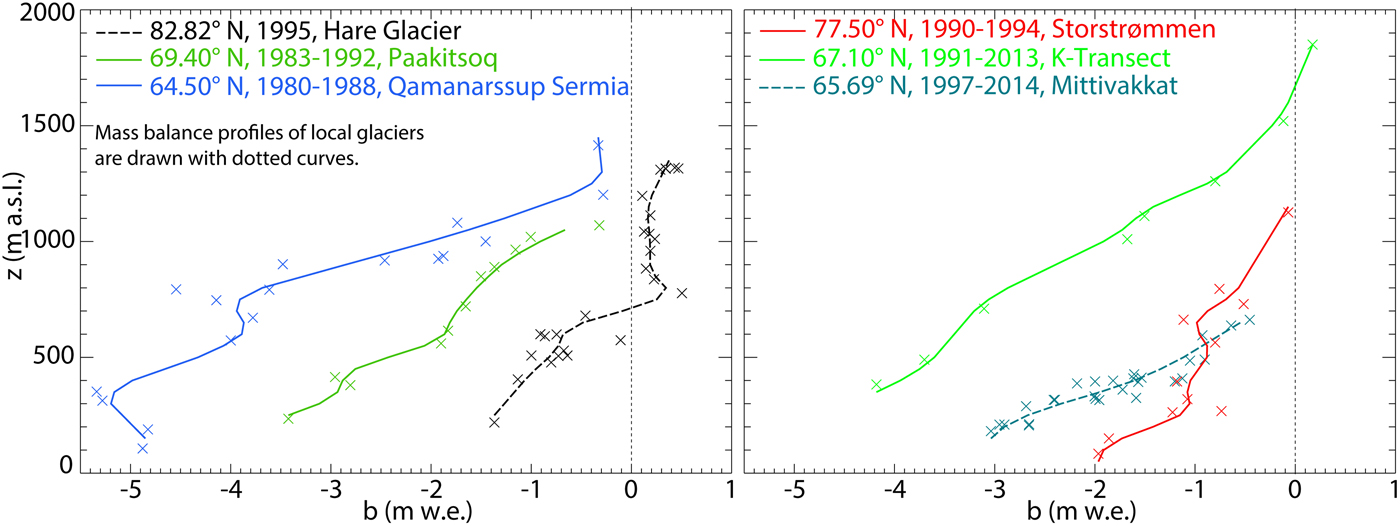
Fig. 7. Mean annual surface mass-balance profiles for six sites shown together with mean annual mass balances (crosses) measured at the individual points.
Differences between the profiles are discussed qualitatively as differing time periods and duration of measurements (cf. Fig. 6) prohibit quantitative comparisons. ELAs in the north are considerably lower than in the south-west and surface mass-balance gradients db/dz, here approximated by linearly regressing surface mass balance below the ELA, increase from north to south (db/dz = 1.3517 − 0.014158y; R 2 = 0.66, where y is latitude and the unit of db/dz is m w.e. (100 m)−1). This is to be expected as the length of the ablation period influences db/dz (e.g. Kuhn, Reference Kuhn1981) and increases on Greenland from north to south. A simple linear regression of db/dz against longitude does not yield a significant correlation because climate along both Greenland's east and west coast varies substantially. Hence, there is no clear longitudinal trend in the factors controlling db/dz (cf. Kuhn, Reference Kuhn1981; Oerlemans and Hoogendorn, Reference Oerlemans and Hoogendorn1989). Consequently, the surface mass balance at any given elevation decreases mainly from north to south but is also strongly influenced by regional-scale variability of, for example, precipitation.
Certain sites feature inverted profiles at low elevations, most prominently seen at Qamanarssup Sermia and Nioghalvfjerdsfjorden. In the first case, effects related to local topography (e.g. shadows from surrounding mountains) might reduce melt at the tongue. In the second case, local topography is expected to have no influence as the tongue of Nioghalvfjerdsfjorden forms an extended shelf. Possible explanations are albedo effects or the strong and persistent temperature inversions of northeast Greenland (e.g. Hansen and others, Reference Hansen2008).
6. DISCUSSION AND CONCLUSIONS
The collected data cover a time span reaching from the last phase of the Little Ice Age (cf. Weidick, Reference Weidick1959) to the present period of continued strong warming. This exceptionally long time period, spanning 123 a, bears the potential to, for example, utilize the data to assess longer term surface mass-balance trends. Such an assessment, however, needs to rely on a spatially and temporally discontinuous dataset: from the 1890s to the 1940s only snapshots in time can be provided with no time series exceeding 3 a in duration. Starting from the 1970s, surface mass-balance observations become continuous, but are fragmented between mostly shorter-term measuring programs. Naturally, the fragmentation of the data also reflects in varying data quality. Coordinated monitoring of the entire ablation area of the ice sheet has recently started, but limited resources led to extremely sparse networks (i.e. two measuring points per elevation ‘transect’ in the PROMICE network vs. typically 10–30 points in regional networks).
Two major questions result from the above and are assessed in the following: (1) how can surface mass-balance data measured in the past be optimized for use in contemporary research and (2) what can be learnt from past measurements to optimize current and future observations?
6.1. Optimizing historical data
Unlocking historical data for modern day usage requires locating, interpreting and archiving the data. Quality of interpretation and archiving greatly benefits from a clearly defined structure in archiving. An extensive set of metadata would be desirable, but comprehensiveness and quality of data reporting and publishing was found to vary strongly (following section). Given these constraints, we refrained from extensive metadata requirements as this would have either led to the inclusion of uncertain data or data fields would have remained mostly empty.
The developed structure is considered suitable to accommodate most existing surface mass-balance data, is flexible with respect to the fragmentation of the data sources and allows the user to perform efficient and automated data selection. We recommended using the various quality flags to filter the data or to provide feedback on which uncertainties impact usability of the data most. Detailed linkage to the sources provides the possibility of easily accessing additional information or investigating suspicious data. Data assimilation into regional climate models (e.g. MAR, RACMO2; Ettema and others, Reference Ettema2009; Fettweis and others, Reference Fettweis2013; Noël and others, Reference Noël2015) is seen as a promising approach to maximize the use of the spatially and temporally discontinuous data.
It is planned to amend the database regularly by including additional data and updating existing entries. Utilizing the data in scientific studies will hopefully be of mutual benefit, to research on Greenland mass balance but also to the quality of the database through user-feedback.
6.2. Recommendations for future work
The large range in accuracy and comprehensiveness of data sources was perceived as the major obstacle in establishing a consistent database. Whether data are thoroughly postprocessed and made accessible in comprehensible reports or publications seems to depend strongly on the individuals running the measurements. In many cases an imbalance is perceived between resources invested in the actual measurements, and the effort spent on reporting. While the background of projects varies greatly and it is acknowledged that results from purely scientific projects are published differently from contract work, comprehensible documentation is always compulsory to optimize the use of measurements.
Raising the general level of data reporting is considered imperative, and thus the following list of basic recommendations is made:
Thanks to direct experience and background knowledge, superior postprocessing and reporting is generally done by the persons who also supervised the measurements. Inferior results are achieved if interpretation of raw measurements is left to the enduser.
Planning of research programs should allocate substantial amounts of time to data management. Funding agencies should label this a crucial project deliverable. Scientific publishers can contribute by requiring data and related metadata, used in scientific publications, to be archived and made publicly accessible.
The work on post-processing and reporting can be assisted by providing guidelines and by offering platforms for data storage, as operated by, for example, the World Glacier Monitoring Service (WGMS) or the National Snow and Ice Data Centre (NSIDC). Guidelines and data platforms need to be regularly adapted to changing user needs and technological progress.
These recommendations do not directly refer to technological development, regardless of recent discussions revolving around, for example, the design of novel ablation devices (Bøggild and others, Reference Bøggild, Olesen, Ahlstrøm and Jørgensen2004; Hulth, Reference Hulth2010). Further automatized and miniaturized, such devices have the potential to improve effectiveness and density of measuring networks. However, it would be a misconception to argue that technological progress will render the above recommendations obsolete. Sheer simplicity is the reason for stake readings remaining such a successful concept; simplicity eases working with the data and minimizes potential error sources. Fully automated and continuously measuring devices provide a much more complex set of data. Exploiting their potential requires developing and applying adequate methods for post-processing and data management.
ACKNOWLEDGEMENTS
The contributions from countless individuals form the basis of the measurements presented in this manuscript. It is with esteem and gratitude that the results of their commitment to glaciological research are hereby made available to the scientific community. Numerous funding agencies and institutions made the various measuring programs possible. They are hereby greatly acknowledged and are listed, to the best of our knowledge, in the Appendix under the respective measurements they funded. This study is under the auspice of the Programme for Monitoring of the Greenland ice sheet (PROMICE), funded by The Danish Energy Agency DANCEA program. This publication is contribution number 72 of the Nordic Centre of Excellence SVALI, ‘Stability and Variations of Arctic Land Ice’, funded by the Nordic Top-level Research Initiative (TRI). HM acknowledges financial support by the Swiss National Cooperative for the Disposal of Radioactive Waste (Nagra) in the framework of the project ‘Glacial Erosion Potential of LGM Glaciers’.
APPENDIX
The appendix provides basic background information for all 53 surface mass-balance sites known to the authors (Table 2). The sites are listed in alphabetical order.
Admiralty Glacier Ice sheet: Admiralty Glacier is a small (~35 km long) outlet glacier of the ice sheet. Surface mass balance on the glacier was measured in the hydrological year of 1952/53. The work was performed in the framework of the British North Greenland Expeditions, 1952–54 (Hamilton and others, Reference Hamilton1956). The aforementioned source provides a detailed map showing the locations of the extensive stake network, but provides only average surface mass balance for the entire measured section of the glacier. Hamilton and others (Reference Hamilton1956) indicate that in contrast to Britannia Glacier, Admiralty Glacier was not measured in 1953/54.
No suitable data could be found.
Amitsuloq Ice Cap Local glacier: The Amitsuloq Ice Cap, covering ~200 km2 and being located just ~3 km west of the ice-sheet margin, discharges into Tasersiaq Basin, considered as one of the basins with the largest hydropower potential on Greenland (Weidick and Olesen, Reference Weidick and Olesen1978). Glaciological observations were carried out by GGU in the framework of mapping hydropower potential of West Greenland. Surface mass-balance observations, consisting of 26 stakes situated along 5 transects on the ice cap (Olesen, Reference Olesen1986), were initiated in autumn 1981 and discontinued in 1990 (Ahlstrøm and others, Reference Ahlstrøm, Bøggild, Olesen, Petersen and Mohr2007). Complete data from Amitsuloq could not be restored as seasonal surface mass-balance values are preserved (Ahlstrøm, Reference Ahlstrøm2003; Ahlstrøm and others, Reference Ahlstrøm, Bøggild, Olesen, Petersen and Mohr2007) while information on exact measuring dates appears lost. Daily resolution measurements for one measuring point could be located (Olesen, Reference Olesenunpubl. b, Reference Olesenc) and comparing daily resolution surface mass balance with seasonal values for the same point (Ahlstrøm, Reference Ahlstrøm2003; Ahlstrøm and others, Reference Ahlstrøm, Bøggild, Olesen, Petersen and Mohr2007) allowed reconstructing seasonal survey dates of the stake network to within a few days accuracy. The measurements have been funded from the GGU budget supplemented with funding from the Ministry of Greenland, Denmark and the EEC Regional Development Fund.
Surface mass-balance readings contained in the database were acquired from Ahlstrøm (Reference Ahlstrøm2003); Ahlstrøm and others (Reference Ahlstrøm, Bøggild, Olesen, Petersen and Mohr2007); Olesen (Reference Olesenunpubl. b, Reference Olesenc, Reference Olesend).
A.P. Olsen Ice Cap Local glacier: Surface mass-balance observations at A.P. Olsen, a 300 km2 ice cap in northeast Greenland, started in 2008 by means of ablation stakes, snow pits, snow radar and three AWS, labelled ZAC-M (650 m a.s.l.), ZAC-S (880 m a.s.l.) and ZAC-T (1470 m a.s.l.) (Larsen and others, Reference Larsen, Citterio, Hock and Ahlstrøm2015). The observations are distributed on one of the major outlet glaciers, from its terminus to the top of its catchment area, coinciding with the highest point of the ice cap. The measurements are carried out in the framework of the GlacioBasis program, being funded by the Danish Energy Agency (ENS).
Surface mass-balance readings and metadata contained in the database were acquired from Citterio and Ahlstrøm (Reference Citterio, Ahlstrøm, Jensen and Rasch2010); Citterio and others (Reference Citterio, Jensen, Rasch and Schmidt2013); Citterio and Larsen (Reference Citterio and Larsenunpubl.).
Bersærkerbræ Local glacier: Located in the northern part of the Stauning Alper, the glacier was studied in the framework of the 1963 Imperial College East Greenland Expedition (Pert, Reference Pert1971). The work of the expedition focused on moraine structures and glacier length changes in the region, and for the duration of ~1.5 months surface mass balance was measured on the tongue of Bersærkerbræ. The expedition was mainly supported by the Mount Everest Foundation and the Imperial College Exploration Board.
Surface mass-balance readings contained in the database were acquired from Pert (Reference Pert1971).
Britannia Glacier Ice sheet: Britannia Glacier is a smaller (~20 km long) outlet glacier of the ice sheet. Surface mass balance on the glacier was measured in the hydrological years of 1952/53 and 1953/54. The work was performed in the framework of the British North Greenland Expeditions, 1952–54 (Hamilton and others, Reference Hamilton1956). The aforementioned source provides a detailed map showing the locations of the extensive stake network, but surface mass-balance data are only provided as averaged values for sections of the glacier. Lister and Taylor (Reference Lister and Taylor1961) study measured energy fluxes and ablation on Britannia Glacier and show a few shorter term ablation measurements in graphs.
No suitable data could be found.
Camp Disco Ice sheet: Camp Disco located on the ice sheet in the upper ablation area at 67.14008°N, 48.49877°W, 1420 m a.s.l. was populated 11 July 2007–2 September 2007 and visited briefly in the subsequent 2 periods for resurvey of the 10 bamboo stakes. Activities at Camp Disco were funded initially by a Discovery Channel production, hence the name Disco. The site was re-visited on 3 September 2008, 20 June 2009 and 1 September 2009 to re-measured the heights of permanent marks on the bamboo stakes. Subsequently, the site was decommissioned. Logistics were covered by Svensk Kärnbränslehantering AB.
Surface mass-balance readings contained in the database were acquired from Box (Reference Boxunpubl. b).
Christian Erichsen Iskappe Local glacier: Christian Erichsen Iskappe is an ~510 km2 ice cap in southernmost Peary Land. For the two hydrological years of 1948/49 and 1949/50 surface mass balance was measured along stake transects on the eastern lobe of the ice cap. The measurements were carried out as part of the 1947–50 Danish expedition to Peary Land (Fristrup, Reference Fristrup1952). The two references that were found (Fristrup, Reference Fristrup1951, Reference Fristrup1952) both provide a superficial description of the glaciological results, without using a map or a table. Høy (Reference Høy1970) provides a detailed map showing the stake locations but no surface mass-balance values.
Surface mass-balance readings contained in the database were acquired from Fristrup (Reference Fristrup1952); Høy (Reference Høy1970).
Flade Isblink Local glacier: Flade Isblink, at ~8000 km2 the largest local glacier on Greenland, was the locale of an ice core drilling program in 2006 (Larsen and others, Reference Larsen, Steffensen and Dahl-Jensen2006).
No publications from the project have been found and no suitable data could be acquired.
Freya Glacier (Fröya Gletscher) Local glacier: Freya Glacier is a small land terminating valley glacier on Clavering Island, 10 km southeast of Zackenberg Research Station (northeast Greenland). The northwest-orientated polythermal glacier covers an area of 5.3 km2 (2013), reaching from 1305 to 275 m a.s.l. and has a maximum ice thickness of 200 m (2008). Detailed glaciological observations on Freya Glacier were initiated in 1939 but were discontinued already in 1940 due to outbreak of the Second World War (Ahlmann, Reference Ahlmann1941). The measurements encompassed surface mass-balance observations, which are included in the present database.
In the International Polar Year 2007/08 a surface mass-balance program was initiated by the Zentralanstalt für Meteorologie and Geodynamik (Austria; e.g. Hynek and others, Reference Hynek, Binder, Weyss, Schöner, Jensen, Christensen and Schmidt2014a). Annual surface mass balance is measured at ~15 sites on the glacier, and in most years winter surface mass balance was also measured. Monitoring on Freya Glacier includes an AWS and automatic cameras. In 2013 a high-resolution DEM was created (Hynek and others, Reference Hynek, Verhoeven, Binder, Boffi, Schöner, Jensen, Christensen and Schmidt2014b). All recent surface mass-balance data are published as point measurements, as mean values on elevation bands and as glacier-wide values, by Hynek and others (Reference Hynek, Weyss, Binder and Schöner2014c).
Surface mass-balance readings contained in the database were acquired from Ahlmann (Reference Ahlmann1941); Hynek and others (Reference Hynek, Weyss, Binder and Schöner2014c).
Glacier 33 (Gletscher 33) Local glacier: ‘Gletscher 33’ is a small local glacier of 0.8 km2, located in the Kangerluarsunnguaq catchment, to the south of Ameralik Fjord. The glacier's name is an abbreviation of its glacier ID 1GC14033 according to Weidick and others (Reference Weidick, Bøggild and Knudsen1992). Surface mass balance of the glacier was measured at eight stakes from 1981 to 1988, in the framework of feasibility studies to supply the city of Nuuk with hydropower. A hydropower plant at Kangerluarsunnguaq was commissioned in 1993 and nowadays supplies Nuuk with electricity. Investigations started in the early 1980s and were led by the Greenland Technical Organization (GTO; now Asiaq Greenland Survey); responsibility for the glaciological measurements was with GGU (Braithwaite, Reference Braithwaite1989). According to Braithwaite (Reference Braithwaiteunpubl. b, Reference Braithwaite1989) the measurements on the small glacier suffered from always being carried out under time pressure. The measurements have been funded from the GGU budget supplemented with funding from the Ministry of Greenland, Denmark and the EEC Regional Development Fund.
Surface mass-balance readings contained in the database were acquired from Braithwaite (Reference Braithwaiteunpubl. b, Reference Braithwaite1989).
Hans Tausen Ice Cap Local glacier: With a surface area of ~4000 km2 and reaching 83°N, Hans Tausen Ice Cap is one of the northernmost large ice bodies in the world. In 1975 and 1976 two shallow cores were drilled in the accumulation area and accumulation rates were measured (Unknown, unpubl. a; Clausen and others, Reference Clausen and Hammer2001; Gundestrup and others, Reference Gundestrup, Keller, Knudsen, Jonsson and Hammer2001). The aforementioned sources do not cite any publication related to the drillings in the 1970s and provide only accumulation values averaged over various time periods. The accumulation value of the shortest of them, 1970–75, was included in the database. In 1993 and 1994 potential sites for deep drilling were investigated, including measurement of accumulation in snow pits (year 1994; Clausen and others, Reference Clausen and Hammer2001). In 1995 a 345 m surface-to-bed ice core was drilled down to the bed and additional snow pits were dug (Olesen and others, Reference Olesen, Reeh, Braithwaite, Obleitner and Olesen1995; Hammer and Thomsen, Reference Hammer and Thomsen1998; Clausen and others, Reference Clausen and Hammer2001). The accumulation rates from snow pits were included in the database. The studies performed from 1993 to 1995 were funded by The Nordic Environmental Research Programme 1993–97 of the Nordic Council of Ministers.
Surface mass-balance readings contained in the database were acquired from Clausen and others (Reference Clausen and Hammer2001); Gundestrup and others (Reference Gundestrup, Keller, Knudsen, Jonsson and Hammer2001); Unknown (unpubl. a).
Hare Glacier (Hans Tausen Ice Cap) Local glacier: Hare glacier is an ~130 km2 outlet glacier of Hans Tausen Ice Cap. The glacier, lacking an official name, was labelled ‘Hare Glacier’ for the purpose of the 1994/95 surface mass-balance measurements (Reeh and others, Reference Reeh, Olesen, Thomsen, Starzer, Bøggild and Hammer2001). The glacier was selected for surface mass-balance measurements during an aerial survey of Hans Tausen Ice Cap in 1993 (Reeh and others, Reference Reeh, Oerter and Bøggild1993b). The measurements were carried out for the purpose of confining surface mass-balance parametrizations of the ice cap in connection with an ice core drilling program (description of ‘Hans Tausen Ice Cap’ above; Reeh and others, Reference Reeh, Braithwaite and Olesen1994a, Reference Reeh, Olesen, Thomsen, Starzer, Bøggild and Hammer2001; Olesen and others, Reference Olesen, Reeh, Braithwaite, Obleitner and Olesen1995). The study was funded by The Nordic Environmental Research Programme 1993–97 of the Nordic Council of Ministers.
Surface mass-balance readings contained in the database were acquired from Reeh and others (Reference Reeh, Braithwaite and Olesen1994a); Unknown (unpubl. h, i).
Helheim Glacier Ice sheet: Helheim Glacier is a major outlet glacier located on the east coast at 66.35°N. During 2006–2010, networks of GPS instruments were deployed on the glacier trunk with the purpose of observing ice flow dynamics in the context of glacial earthquakes (Andersen and others, Reference Andersen2010). Each GPS site comprised an antenna and an instrument box, each tethered to an aluminium stake. Together the two poles at each site produced one surface mass-balance value, yielding 13, 21, 12 and 7 values across the glacier for the years 2006, 2007, 2008 and 2009, respectively. The work was conducted collaboratively by Columbia University (USA), University of Maine (USA), Harvard-Smithsonian Center for Astrophysics (USA), University of Kansas (USA), GEUS (Denmark) and Institute for Space Sciences and Marine Technology Unit (Spain) with funding from the Gary Comer Science and Education Foundation, the US NSF, KVUG (Denmark), the Spanish Ministry of Science and Innovation, GEUS, Geocenter Copenhagen, the Danish National Space Center, NASA, the Lamont-Doherty Climate Center, and the Dan and Betty Churchill Exploration Fund.
Surface mass-balance readings contained in the database were acquired from Andersen (Reference Andersenunpubl. a, Reference Andersenb).
Imersuaq/1DG16156 Ice sheet: Imersuaq/1DG16156 stands for a set of three outlet glaciers (located within 30 km from each other) at the southwest Greenland ice sheet margin. In the framework of the GGU program for the regional mapping of the hydroelectric potential of West Greenland, a transect of stakes was installed in 1985 on the outlet 1DG16156 (Olesen, Reference Olesen1986). The intended purpose of the measurements was to compare melt at the local Amitsuloq Ice Cap with the adjacent ice sheet. Relocating the ice-sheet stakes in the following year proved to be challenging and the measurements were soon abandoned. In the framework of the Imersuaq project, surface mass balance transects on two nearby outlet glaciers were surveyed during the 2000 melt season. Similar to the GGU program, the Imersuaq project aimed at improving estimates of the ice-sheet contribution to hydropower potential (Ahlstrøm, Reference Ahlstrøm2003). The measurements from the 1980s have been funded from the GGU budget supplemented with funding from the Ministry of Greenland, Denmark and the EEC Regional Development Fund. The Imersuaq Project was funded under the North Atlantic Programme of the Danish Natural Science Research Council.
No measurements were found from the 1980s. Surface mass-balance readings contained in the database stem from the year 2000 and were acquired from Ahlstrøm (Reference Ahlstrøm2003).
Isertoq ice lobe Ice sheet: The south-facing Isertoq ice lobe of the Greenland ice sheet is ~15 km wide covering over 300 km2 on the southeast coast of Greenland. The PROMICE AWSs, TAS_L, TAS_U and TAS_A are/were located ~3, 10 and 26 km from the margin (along a flow line), all in the ablation area. TAS_L and TAS_U were established in 2007 and TAS_A, at higher elevation than TAS_U, in 2013. This site was chosen due to its relative proximity to the Tasiilaq heliport, and to continue the (intermittent) measurement series taken here since 2004 as part of the GEUS IceMon project. The stations are named after the nearby town of Tasiilaq.
Together with the SCO (see site description for ‘Violin Glacier’), KPC (Kronprins Christian Land), QAS (Qassimiut ice lobe), NUK (Qamanarssup and Kangilinnguata Sermia), KAN (Kangerlussuaq), UPE (Upernavik) and THU (Tuto Ramp) stations, these make up the network of the Programme for Monitoring of the Greenland Ice Sheet (PROMICE). PROMICE is an effort to monitor ice-sheet climatology and mass change. The program was initiated in 2007 and is operated by GEUS in collaboration with the DTU Space institute of the Technical University of Denmark and Asiaq Greenland Survey, Nuuk. The PROMICE AWS network focuses on the ablation area of the ice sheet and therefore complements the Greenland Climate Network (GC-Net) in the accumulation area. Per measuring site, two or three stations (typically labelled ‘L’ for lower and ‘U’ for upper) make up a (minimal) elevation transect to assess elevation-dependent ice/atmosphere interaction. PROMICE, as well as its precursor IceMon, is funded by the DANCEA program of the Danish Energy Agency. The KAN weather stations were funded by the Greenland Analogue Project (GAP; see ‘K-Transect’ for details).
Surface mass-balance readings contained in the database were acquired from Fausto (Reference Faustounpubl.); Podlech and others (Reference Podlech, Mayer and Bøggild2004).
Isortuarssup Sermia Ice sheet: Outlet glacier of the ice sheet, located in the Isortuarsuup Tasia basin, to the south of Kangerluarsunnguaq (see ‘Glacier 33’). Surface mass balance on the outlet was measured at three stakes from 1984 to 1988, in the framework of feasibility studies to supply Nuuk with hydropower. No hydropower plant was planed in Isortuarsuup Tasia, but consideration was given to transferring water from the mainly glacier-fed basin to Kangerluarsunnguaq, which offers good conditions to build a hydropower plant but has only a sparse glacier cover and depends mainly on precipitation. The investigations started in the early 1980s and were led by the Greenland Technical Organization (GTO; now Asiaq Greenland Survey); responsibility for the glaciological measurements was with GGU (Braithwaite, Reference Braithwaite1989). The measurements have been funded from the GGU budget supplemented with funding from the Ministry of Greenland, Denmark and the EEC Regional Development Fund.
Surface mass-balance readings contained in the database were acquired from Braithwaite (Reference Braithwaiteunpubl. b, Reference Braithwaite1989).
Isua Ice sheet: Surface mass-balance and ice-velocity measurements at the Isua site have been carried out in summer 2008 by Niels Reeh and assisted by Simone Bircher. The measurements were discontinued, no surface mass-balance values could be found.
K-Transect (Søndre Strømfjord, Russell Glacier)
Ice sheet: Since 1990 mass-balance observations have been carried out along the 67°N parallel at eight sites ranging from 300 to 1850 m a.s.l. Stake measurements are combined with sonic height ranger data from four weather stations (S5, S6 and S9, S10) along the transect. At each site at least two stakes are maintained throughout the entire period. Data are not reduced to a fixed date, but measurements are usually carried out in late August. An exception to this rule is the mass-balance year 2009/10, which showed a significant melt in autumn 2010. Based on sonic height ranger data at S5, S6 and S9 we reconstructed the autumn 2010 melt, subtracted this from 2010/11, and added this to the mass-balance year 2009/10. This correction ranges from 0.9 m w.e. at S4 to 0.19 m w.e. at S9. Sites near the margin have been relocated a few times because of crevasse zones; data at the lowest two sites are therefore reduced to a fixed elevation. The mass-balance data for the other sites are not corrected for the small height differences due to ice flow or stake replacement. The largest uncertainty (estimated at $1\sigma = 0.2\;{\rm m}{\kern 1pt} {\rm w}{\rm. e}{\rm.} $
) in the measurements in the lower region (S4, S5, SHR) is caused by the rough surface topography. Details are described by Van de Wal and others (Reference Van de Wal, Greuell, van den Broeke, Reijmer and Oerlemans2005, Reference Van de Wal2012). The K-transect program has been funded by Utrecht University, the Netherlands Polar Program of NWO/ALW and a Spinoza grant awarded to J.Oerlemans.
$1\sigma = 0.2\;{\rm m}{\kern 1pt} {\rm w}{\rm. e}{\rm.} $
) in the measurements in the lower region (S4, S5, SHR) is caused by the rough surface topography. Details are described by Van de Wal and others (Reference Van de Wal, Greuell, van den Broeke, Reijmer and Oerlemans2005, Reference Van de Wal2012). The K-transect program has been funded by Utrecht University, the Netherlands Polar Program of NWO/ALW and a Spinoza grant awarded to J.Oerlemans.
Adding further detail to the transect, the Greenland Analogue Project (GAP), funded by the Swedish and Finnish nuclear fuel and waste management agencies SKB and Posiva respectively, initiated surface mass-balance measurements at three locations in 2008 and 2009. The AWSs KAN_L and KAN_M (named after the nearby town of Kangerlussuaq) were placed in the ablation area at 13 and 62 km respectively, from the glacier front in late summer 2008. KAN_U was established at ~140 km from the glacier front in the lower accumulation area in spring 2009. The relatively dense regional observational network was utilized for a detailed study of surface mass balance and meltwater runoff (Van As and others, Reference Van As2012), which is updated annually.
Camp Dark Snow was a temporary camp installed in summer 2014 on the K-Transect, 250 m down-glacier of the point 67.0785°N, 49.399°W; 1011 m a.s.l. At the camp daily ablation (19 June–11 August 2014) was measured on 10 bamboo stakes. Camp Dark Snow 2014 was funded by Villum Young Investigator Programme grant VKR 023121 and more than 700 crowd funders to darksnow.org.
Surface mass-balance readings contained in the database were acquired from Van de Wal and others (Reference Van de Wal2012); van de Wal (Reference van de Walunpubl.); Fausto (Reference Faustounpubl.); Box (Reference Boxunpubl. a).
Kangilinnguata Sermia Ice sheet: On a west-facing ice lobe just north of Kangilinnguata Sermia, the northernmost glacier draining into Godthåbsfjord, the PROMICE AWS NUK_N (‘Nuuk north’) was established in the ablation area in summer 2010, within the framework of the Greenland Climate Research Center (GCRC) project (see also ‘Qamanarssup Sermia’). The purpose of the station was to investigate the along-slope gradients in surface mass-balance forcings between this glacier and Qamanarssup Sermia. With the ending of this project, the station was removed in 2014. See ‘Isertoq ice lobe’ for more details on PROMICE.
Surface mass-balance readings contained in the database were acquired from Fausto (Reference Faustounpubl.).
Kronprins Christian Land Ice sheet: The area under investigation at the ice margin in southwestern Kronprins Christian Land (KPCL) covered a range from 79.56° to 79.94°N and from 24.01° to 26.29°W. In the summer seasons 1993, 1994 and 1995 a team from AWI (now: Alfred-Wegener Institute, Helmholtz Centre for Polar and Marine Research) and Danish Polar Centre joined the GGU (now: GEUS) geological expedition to northeast Greenland (base camp at Centrum Sø) to carry out glaciological investigations at the ice margin. In the area under investigation the inland ice was ascending smoothly and thus the ice was easily accessible. The investigations were carried out along a 60 km long stake line, starting at an altitude of 186 m and ending at 1065 m (Oerter and others, Reference Oerter, Jung-Rothenhäusler, Bøggild and Higgins1995b). The 18 main stakes were positioned by means of GPS measurements, intermediate stakes were surveyed from a fixed rock point (NG9300; 79.909594°N, 24.004639°W; 390 m a.s.l. WGS84) beside the ice margin, which was also used as a fixed point for the other GPS measurements and referred to an earlier triangulation point at Centrum Sø, (CTSO; 80.150761°N, 22.506378°W; 15 m a.s.l. WGS84) (Oerter and others, Reference Oerter, Jung-Rothenhäusler, Bøggild, Reeh and Henriksen1994). The ice surface displays a lineated structure originating from stadial (brownish) and interstadial (white) ice layers during the Wisconsin ice age (Konzelmann and Braithwaite, Reference Konzelmann and Braithwaite1995; Bøggild and others, Reference Bøggild, Oerter and Tukiainen1996). The work in 1993/94 was financially supported by the EC ENVIRONMENT program (contract EV5 V-CT91-0051).
The KPC (Kronprins Christian Land) AWSs were established in summer 2008, and the site was chosen due to its relative proximity to Station Nord and because of the aforementioned earlier measurements. The lower station KPC_L is located at a site previously monitored by GGU within 1 km of the margin. The upper station KPC_U was established 23 km inland near the present-day ELA. More details on PROMICE are provided under ‘Isertoq ice lobe’.
Surface mass-balance readings contained in the database were acquired from Oerter (Reference Oerterunpubl.); Oerter and others (Reference Oerter, Jung-Rothenhäusler, Bøggild, Reeh and Henriksen1994, Reference Oerter, Bøggild, Jung-Rothenhäusler, Reeh, Obleitner and Olesen1995a); Fausto (Reference Faustounpubl.).
Mint Julep Ice sheet: Project Mint Julep served the continuation of investigations of the construction and maintenance of airfields on the ice sheet (ACFEL, 1954). An area close to the apparent firn line was selected because it was expected to be suitable for landing and take-off of wheeled aircrafts. In the framework of Project Mint Julep detailed snow (Schuster, Reference Schuster1954) and ablation studies (LaChapelle, Reference LaChapelle1955) were carried out. Ablation was measured at ~20 points along a transect of ~30 km in length (Fig. 2 of LaChapelle, Reference LaChapelle1955). Only a limited number of the ablation measurements are included in the database as LaChapelle (Reference LaChapelle1955) reports snow depth, and changes therein, mostly without stating snow densities. Project Mint Julep was led by the American Geographical Society, under contract with the Air University, US Air Force, and was furthermore supported by a number of US Army research institutions.
Surface mass-balance readings contained in the database were acquired from LaChapelle (Reference LaChapelle1955); Holmes (Reference Holmes1955).
Mittivakkat (Mitdluagkat)
Local glacier: Mittivakkat Gletscher (26.2 km2; $65.68{\kern 1pt} {\rm ^\circ} {\rm N}$
, 37.8°W) is a temperate glacier ranging from ~160 to 880 m a.s.l., located in the Ammassalik region, southeast Greenland, ~15 km northwest of the town of Tasiilaq and 50 km east of the eastern margin of the Greenland ice sheet.
$65.68{\kern 1pt} {\rm ^\circ} {\rm N}$
, 37.8°W) is a temperate glacier ranging from ~160 to 880 m a.s.l., located in the Ammassalik region, southeast Greenland, ~15 km northwest of the town of Tasiilaq and 50 km east of the eastern margin of the Greenland ice sheet.
Based on the earliest scientific glacier work on Mittivakkat Gletscher in 1933 conducted by the geologist Keld Milters, Mittivakkat Gletscher was during the International Geophysical Year (IGY) 1957/58 picked as one of the Danish focus sites for Arctic research. Mittivakkat Gletscher is the only local glacier in Greenland for which there exists long-term mass-balance observations. In 1995 the present ongoing observational glacier mass-balance program (based on the direct glaciological method) was established covering 16.3 km2 of the glacier area (e.g. Knudsen and Hasholt, Reference Knudsen and Hasholt2008; Mernild and others, Reference Mernild2011). The measurements are used to determine annual variations and trends in ice/snow extent and ice volume and to calculate the equilibrium line altitude. Surface mass balance is measured using cross-glacier stake lines at separations of ~500 m. The stakes in each line are 200–250 m apart, and measurements are obtained at a total of 45–50 stakes. The stake program has over the years been funded by University of Copenhagen, the EU funded InterAct program and by Miljøstyrelsen in Denmark.
Surface mass-balance readings contained in the database were acquired from Mernild (Reference Mernildunpubl.).
Narssaq Bræ local glacier: Narsaq Bræ is a small local glacier with an area of 1.4 km2 situated inside two cirque basins north of the town of Narsaq near to the coast in south Greenland. Surface mass-balance measurements were made in the period 1980–83 as part of a GGU program for regional mapping of the hydropower potential and partly funded by the Danish Ministry of Energy. The results from Narsaq Bræ, compared with Nordbo Glacier and Valhaltinde Glacier, clearly demonstrate that the mass exchange decreases as one goes from the coastal regions to the interior of the country (Clement, Reference Clement1982b).
Surface mass-balance readings for the first two balance years are acquired from Clement (Reference Clement1982b). Stake readings were performed also for a third balance year (personal communication P. Clement, Jania and Hagen, Reference Jania and Hagen1996), but could not be located.
Nioghalvfjerdsfjorden (79-Fjord) Ice sheet: Floating glacier tongue filling Nioghalvfjerdsfjorden at 79.5°N in northeast Greenland and one of the three major outlets of the North-East Greenland ice stream. The name is the Danish word for ‘79 Fjord’. Ice and climate studies were carried out by the Geological Survey of Denmark and Greenland (GEUS) 1996–98 and by the Alfred Wegener Institute (AWI) 1997/98 (Thomsen and others, Reference Thomsen1997, Reference Thomsen, Reeh, Olesen, Starzer and Bøggild1999; Reeh and others, Reference Reeh, Christensen, Thomsen and Forsbergunpubl.). Surface mass balance was measured by GEUS on the floating ice tongue and on the ice-sheet sector above the grounding zone. The project was supported by the European Community under the Environment and Climate Programme through contract ENV4-CT95-0124.
Surface mass-balance readings contained in the database were acquired from Unknown (unpubl. f); Thomsen and others (Reference Thomsen, Reeh, Olesen, Starzer and Bøggild1999).
Nordbo Glacier (Kuukuluup Sermia, Nordbogletscher) Ice sheet: On Nordbo Glacier, an outlet of the ice sheet at Johan Dahl Land, South Greenland, surface mass-balance measurements were carried out during the period 1978–83. Measurements were made from the snout of the glacier 660 m a.s.l. to the accumulation area 2100 m a.s.l. The glacier with a topographic area of ~208 km2 is the main water source to the Nordbosø, a lake proposed as a reservoir for a hydroelectric project (Clement, Reference Clement1983c). The main purpose was to calculate the meltwater contribution from the glacier to the lake as well as annual variations. The investigations also included observations of glacier dynamics, ice-dammed lakes and climate/ablation relationships (Clement, Reference Clement1980, Reference Clement1981d, Reference Clement1982c, Reference Clement1983c, Reference Clementd). The investigations were part of a GGU program for regional mapping of the hydropower potential and partly funded by the Danish Ministry of Energy. A detailed description of the techniques applied by GGU researchers to measure and calculate surface mass balance at stakes and snow pit locations is given in Clement (Reference Clement1983d).
Surface mass-balance readings contained in the database were acquired from Clement (Reference Clement1981a, Reference Clementb, Reference Clementc), Clement (Reference Clement1982a, Reference Clement1983a, Reference Clementb).
North Ice Cap Local glacier: In connection with the US Army investigations in north Greenland also the genesis, movement and changes in vertical ice cliffs were investigated. North Ice Cap is a larger local ice body whose margin in the Nunatarssuaq area forms a distinct, up to 40 m high land based ice cliff (Goldthwait, Reference Goldthwait1971). In the course of these investigations surface mass balance was measured in 1955 and 1956 (e.g. Goldthwait, Reference Goldthwait1956) and again in 1965 (Goldthwait, Reference Goldthwait1971).
To date, only the 1971 report could be found. Despite mentioning ablation measurements, it contains no data suitable for the present database.
Nunatarssuaq Ice Ramp (Nuna Ramp) Ice sheet: The Nunatarssuaq ice ramp is a land terminating and gently sloping ice-sheet marginal area (Nobles, Reference Nobles1960), which was investigated under the USA SIPRE Project 22.1.1, ‘Glaciological studies in Nunatarssuaq area’. The investigations aimed at studying marginal areas with a potential to provide road access to the ice-sheet interior. Among a variety of glaciological parameters, such as firn/ice temperature and ice movement, also surface mass balance was measured.
Surface mass-balance readings contained in the database were acquired from Nobles (Reference Nobles1960).
Nuussuaq Glaciers Local glacier: Flow velocities of three local glaciers on the Nuussuaq peninsula at 70°N were observed from August 1892 to August 1893 by von Drygalski (Reference von Drygalski1897). The measurements were carried out using rows of stones and bamboo stakes. Almost a full year of measurements could be achieved, but the surface mass-balance measurements are hampered by all stakes except one being melted out upon revisit in 1893. However, von Drygalski (Reference von Drygalski1897) claims that for some of the stakes meltout happened shortly before revisit as depressions were still visible where the holes of the stakes were located. To our knowledge, the measurements constitute the earliest surface mass-balance measurements on local glaciers of Greenland. The measurements were carried out in the framework of the Greenland Expedition of the Berlin Geographical Society (for details on the expedition see the entry on Qarassaq Sermia).
Surface mass-balance readings contained in the database were acquired from von Drygalski (Reference von Drygalski1897).
P-Mountain Glacier Local glacier: During the Cold War, the US Army undertook a large-scale research and development program in northwest Greenland. In the framework of the program surface mass balance of the local P-Mountain glacier was measured for comparison with the observations on the nearby Tuto ramp of the ice sheet (see below). The 2 a of P-Mountain glacier investigations are described in Griffiths (Reference Griffiths1960, Reference Griffiths1961). While annual surface mass-balance values are given for all stakes, the report does not mention whether values refer to ice, snow or both. The main conclusion of Griffiths (Reference Griffiths1961) is that the ELA is higher on P-Mountain glacier than on the nearby Tuto ramp.
Surface mass-balance readings contained in the database were acquired from Griffiths (Reference Griffiths1961).
Paakitsoq/JAR Ice sheet: Sector of the Greenland ice sheet 45 km northeast of the town Ilulissat in west Greenland. The sector, which drains ice down to three marginal lakes, was investigated by GGU, now Geological Survey of Denmark and Greenland (GEUS) from 1982 to 1992 in connection with hydropower planning for Ilulissat (Thomsen, Reference Thomsen1984; Braithwaite and others, Reference Braithwaite, Pfeffer, Blatter and Humphrey1992). Two different basin configurations were studied, a large basin called Paakitsup Ilordlia and a smaller basin called Paakitsup Akuliarusersua. Nowadays, meltwater from the ice sector is used in a hydroelectric power plant, which was inaugurated in 2013. The work at Paakitsoq were funded by the European Economic Community (EEC) through the European Regional Development Fund and by the former Ministry for Greenland, Denmark.
The Greenland Climate Network (GC-Net Steffen and others, Reference Steffen, Box, Abdalati and Colbeck1996; Steffen and Box, Reference Steffen and Box2001) maintains a transect of three AWS in close vicinity of the earlier transect of GGU ablation stakes. A first station, labelled JAR1, was installed in 1996. The stations JAR2 and JAR3 began operating in 1999 (the latter having been dismantled in the meantime). The stations measure surface mass balance together with a number of meteorological parameters.
Surface mass-balance readings contained in the database were acquired from Thomsen (Reference Thomsenunpubl., Reference Thomsen1984); Braithwaite and others (Reference Braithwaite, Pfeffer, Blatter and Humphrey1992). GC-Net data have been requested from http://cires1.colorado.edu/steffen/gcnet/.
Petermann Glacier Ice sheet: Petermann glacier is one of the larger remaining ice shelves in the Arctic. The Greenland Climate Network (GC-Net Steffen and others, Reference Steffen, Box, Abdalati and Colbeck1996; Steffen and Box, Reference Steffen and Box2001) maintains a transect of two AWS on the glacier. A lower station, labelled ‘Petermann Gl’, is situated close to sea level on the floating tongue and was installed in 2002. An upper station, labelled ‘Petermann ELA’, was installed 1 a later at 960 m a.s.l., close to the expected local ELA. The latter station was in the meantime removed from the field.
Surface mass-balance readings contained in the database were compiled from GC-Net data (requested from http://cires1.colorado.edu/steffen/gcnet/).
Qaanaaq Ice Cap Local glacier: Qaanaaq Ice Cap is located in Prudhoe Land in northwestern Greenland. The ice cap covers the central part of a peninsula over an area of 289 km2 and an elevation range 30–1110 m a.s.l. Surface mass-balance measurements have been carried out since 2012 along the flowline of Qaanaaq Glacier, one of the outlet glaciers of the southern part of the ice cap (Sugiyama and others, Reference Sugiyama2014). The measurements were performed by Hokkaido University and National Institute of Polar Research as a part of Green Network of Excellence (GRENE) Arctic Climate Change Research Project funded by Japanese Ministry of Education, Culture, Sports, Science and Technology.
Surface mass-balance readings contained in the database were acquired from Sugiyama (Reference Sugiyamaunpubl.).
Qamanarssup Sermia Ice sheet: Qamanarssup Sermia is a relatively steep, land-terminating outlet glacier bordering Godthåbsfjord in mountainous southwest Greenland. The glacier was surveyed from 1979 to 1987 as part of GGU's program of regional mapping of hydropower potential in west Greenland. No hydropower plant was planned at the glacier, but the site was chosen as a midpoint between Nordbo Glacier in the south and Amitsuloq Ice Cap further north. The glacier was subject to a relatively detailed survey, including meteorological observations, measurements of surface mass-balance and ice movement within a network of stakes installed at 15 measuring sites on the glacier (e.g. Braithwaite and Olesen, Reference Braithwaite and Olesen1982) and detailed mapping of the lower parts of the glacier (Andreasen and others, Reference Andreasen, Knudsen and Møller1982). The measurements have been funded from the GGU budget, supplemented with funding from the Ministry of Greenland, Denmark and the EEC Regional Development Fund.
The PROMICE AWSs NUK_L and NUK_U (named after the nearby town of Nuuk) were established in 2007 and are located, respectively, on the outlet glacier and in the ice-sheet ablation area feeding the glacier, respectively. NUK_U was moved north by 2 km in 2013 due to crevasse formation. This site was chosen because of the surface mass-balance measurements performed here by GGU in the 1980s, and its convenient location due-east of Nuuk. The Greenland Research Climate Center (GCRC) co-funded these stations for several years. See ‘Isertoq ice lobe’ for more details on PROMICE.
Surface mass-balance readings and related metadata contained in the database were acquired from Andreasen and others (Reference Andreasen, Knudsen and Møller1982); Braithwaite and Olesen (Reference Braithwaite and Olesenunpubl.); Braithwaite (Reference Braithwaite1983); Braithwaite and Olesen (Reference Braithwaite and Olesen1982); Braithwaite (Reference Braithwaite1986); Braithwaite and Olesen (Reference Braithwaite and Olesen1989); Fausto (Reference Faustounpubl.).
Qapiarfiup Local glacier: ‘Qapiarfiup Sermia’ is an ice cap of ~110 km2, located east of the town of Maniitsoq, close to the coast. Glaciological measurements were focused on one of the catchments of the ice cap ending in a lake whose hydropower potential was investigated. The observations were carried out in the framework of GGU's program for the mapping of the hydropower potential of west Greenland (Olesen, Reference Olesen1986). The observations complimented the Amitsuloq measurements and were used to investigate glaciological gradients from the coast to the ice-sheet margin. Over the time period 1981–89, surface mass balance was measured at five stakes (Ahlstrøm, Reference Ahlstrøm2003). The measurements have been funded from the GGU budget, supplemented with funding from the Ministry of Greenland, Denmark and the EEC Regional Development Fund.
Surface mass-balance readings contained in the database were acquired from Unknown (unpubl. b, e); Ahlstrøm (Reference Ahlstrøm2003).
Qarassaq Sermia (Karajak, Store Gletscher) Ice sheet: Glaciological investigations were the main focus of the 1892/93 ‘Grönland-Expedition der Gesellschaft für Erdkunde zu Berlin’ (Greenland Expedition of the Berlin Geographical Society) (von Drygalski, Reference von Drygalski1897; von Drygalski and others, Reference von Drygalski, Vanhöffen, Stade and Schumann1897; Lüdecke, Reference Lüdecke1992). Particular attention was devoted to studying the flow of the ice sheet. At the time the mechanics of ice sheets were debated controversially, and Greenland was seen as a potential analogy to the proposed Scandinavian ice sheet of the last glacial maximum (Lüdecke, Reference Lüdecke1992). On Qarassaq Sermia an extended stake network was installed to measure horizontal and vertical components of ice flow over the course of almost an entire year (17 July 1982–7 July 1893). At the ~100 stakes also surface mass balance was measured. As with the measurements on the Nuussuaq glaciers, many stakes melted out (von Drygalski, Reference von Drygalski1897). The expedition (including a preliminary expedition in 1891) was mainly sponsored by the Berlin Geographical Society.
Surface mass-balance readings contained in the database were acquired from von Drygalski (Reference von Drygalski1897).
Qasigiannguit Local glacier: Qasigiannguit is a small (0.7 km2) north-facing glacier situated on the north side of Kobbefjord, 18 km east of Nuuk, the capital of Greenland. The glacier spans an elevation range of 680-1000 m a.s.l. The entire drainage basin of the glacier covers 10.1 km2 and discharges into Kobbefjord. The Qasigiannguit surface mass-balance program is run by Asiaq, Greenland Survey, and was initiated in 2012 as a strategic initiative of ClimateBasis in the framework of the Greenland Ecosystem Monitoring (GEM) program, in order to better understand the cryospheric component in the hydrology of a low-Arctic ecosystem. The stake network includes nine stakes. A discharge station has been maintained further down-glacier since 2007. In 2014, an AWS has been established in collaboration with the PROMICE program in order to investigate climate and surface mass-balance gradients between the coast and the ice sheet (Abermann and others, Reference Abermann, van As, Petersen and Nauta2014).
Surface mass-balance readings contained in the database have been acquired from Abermann (Reference Abermannunpubl.).
Qassimiut ice lobe (Sermilik) Ice sheet: The Qassimiut ice lobe is a mostly land-terminating ice sheet marginal area with six marine-terminating outlet glaciers covering an area of ~3000 km2 in south Greenland. The PROMICE transect consists of three AWSs named after the ice lobe: QAS_L (at 2 km from the margin, established in 2007), QAS_U (near the present-day ELA, established in 2008), and QAS_A (9 km further inland, established in 2012). The QAS_L record started as ‘Station 71’ in 2001 and additional surface mass-balance observations were made along a transect in following years (Podlech and others, Reference Podlech, Mayer and Bøggild2004). The measurements were thus initiated in the framework of the IceMon project at GEUS, funded by the Danish Environmental Protection Agency under the program ‘Danish Cooperation for Environment in the Arctic – DANCEA’. The site was taken over by PROMICE in 2007. Since 2013 six stakes provide additional summer and winter balance measurements (not yet contained in the present database). The QAS_L station was moved 1.6 km east in 2009 due to increased crevasse extent at its original location. See ‘Isertoq ice lobe’ for more details on PROMICE.
Surface mass-balance readings contained in the database were acquired from Podlech and others (Reference Podlech, Mayer and Bøggild2004); Fausto (Reference Faustounpubl.).
Qaumarujuk (Kamarujuk) Ice sheet: The ‘Deutsche Grönland Expedition Alfred Wegener, 1929 und 1930/31’ (German Greenland Expedition Alfred Wegener, 1929 and 1930/31) consisted of a preliminary expedition in 1929 and the main expedition in 1930/31 (Wegener and others, Reference Wegener1933). The expedition is remembered for having achieved a comprehensive set of glaciological and meteorological observations, but also for being overshadowed by the tragic death of Alfred Wegener and his companion Rasmus Villumsen, on return from camp ‘Eismitte’. The latter was the site of the first ever over winter stay on the ice sheet and the locale of pioneering firn studies (e.g. ‘Sorge's Law’, cf. Sorge, Reference Sorge1935; Bader, Reference Bader1954). In the framework of the expedition the first set of measurements fully focused on surface mass balance in the ablation area of the ice sheet was performed. (Earlier expeditions used stakes primarily for velocity measurements.) For a full 2 a, surface mass balance was measured along a stake transect on Qaumarujuk, a small land-terminating outlet of the ice sheet (Loewe and Wegener, Reference Loewe and Wegener1933; Loewe, Reference Loewe1936). The measurements are also the first on Greenland to exceed 1 a in duration.
Surface mass-balance readings contained in the database were acquired from Loewe and Wegener (Reference Loewe and Wegener1933).
Renland Ice Cap Local glacier: The local Renland Ice Cap has been subject to the 1988 drilling of a surface-to-bedrock ice core (Johnsen and others, Reference Johnsen1992). Accumulation rates measured in the ice core could be included in the database but availability of the data has not yet been investigated.
Roslin Glacier Local glacier: The Cambridge Staunings Expeditions 1970 and Cambridge East Greenland Expedition 1971 performed research in the area of the central Stauning Alper. The 1970 expedition's radar measurements on Roslin Glacier constitute an early application of radar to measure ice thickness of a valley glacier (Davis and others, Reference Davis, Halliday and Miller1973). Furthermore, a stake network was installed on the same glacier (Miller, Reference Miller1971). According to Billinghurst (Reference Billinghurst1971) ablation from July/August 1970 to summer 1971 could be measured at 23 out of a total of 26 stakes. Billinghurst (Reference Billinghurst1971) provides only a very brief summary of the 1971 expeditions, but announces publication of a detailed report for the year 1972. The latter could not be located.
No suitable data could be found.
Schuchert Glacier Local glacier: Schuchert Glacier is a 31 km long (Machguth and Huss, Reference Machguth and Huss2014) land terminating valley glacier in the Stauning Alper, central east Greenland, where glaciological investigations were carried out in connection with planned mining activity at the Malmbjerg molybdenum prospect (Citterio and Mottram, Reference Citterio and Mottram2008; Citterio and others, Reference Citterio, Mottram, Larsen and Ahlstrøm2009). In 2008 the GEUS AWS QUA was established in the ablation area ~4.5 km from the terminus, at an elevation of 600 m a.s.l. and near the confluence with Arcturus Glacier. The measurements were carried out by GEUS in the framework of consultancy for Quadra Mining, Vancouver, Canada (now KGHM International Ltd, Lubin, Poland).
Surface mass-balance readings contained in the database were acquired from Citterio (Reference Citteriounpubl.).
Sermek Kujadlek/EGIG (Eqip Sermia) Ice sheet: The Eqip Sermia area is the starting point of one of the first crossings of the ice sheet, which took place in June and July 1912. The successful crossing was led by the expedition leader A. de Quervain while a second expedition party remained in the Eqip Sermia area and performed scientific investigation under the leadership of P.-L. Mercanton (de Quervain and Mercanton, Reference de Quervain and Mercanton1925). Sermek Kujadlek, a small lobe at the ice-sheet margin immediately south of Eqip Sermia, was subject to measurements of ice velocity and ablation in July and August 1912.
The area of Eqip Sermia is also the starting point of the so-called EGIG line, a transect subject to glaciological and geodetic studies during the ‘Expéditions Glaciologiques Internationale au Groenland’ (EGIG, 1959/60 and 1967/68), reaching from the west coast all the way to Cecilia Nunatak close to the eastern margin of the ice sheet (Fig. 1 in Bauer, Reference Bauer1961). To date only surface mass-balance measurements carried out in 1958/59 have been located (Bauer, Reference Bauer1961; Ambach, Reference Ambach1963, Reference Ambach1979).
Surface mass-balance readings contained in the database were acquired from Bauer (Reference Bauer1961) and de Quervain and Mercanton (Reference de Quervain and Mercanton1925).
Sermikavsaq Local glacier: At the occasion of the International Geophysical Year, Copenhagen University organized a 1956/57 glaciological expedition to West Greenland (Møller, Reference Møller1959). During the summer of 1957, one of the three expedition teams was working on Sermikavsak, a land terminating valley glacier on Upernivik Island, north of Uummannaq. Meteorological observations on the glacier as well as ablation measurements were carried out in the glacier's ablation area (Kuhlman, Reference Kuhlman1959). The expedition was supported by the Carlsberg Foundation and the Rask-Ørsted Foundation.
Surface mass-balance readings contained in the database were acquired from Kuhlman (Reference Kuhlman1959); Møller (Reference Møller1959).
Steenstrup Glacier (Melville Bay) Ice sheet: The so-called ‘Cryo’ AWS was established in 2004 on stagnant ice within 1 km of the calving front of Steenstrup glacier in the Melville Bay area, northwest Greenland. The purpose of the station involved in-situ validation for the failed CryoSat-1 satellite. The station initially was a basic station measuring chiefly ablation, but was replaced by a full surface energy balance station in 2006, which was removed from the field in 2008 (van As, Reference van As2011).
Surface mass-balance readings contained in the database were acquired from van As (Reference van As2011, Reference van Asunpubl. a, Reference van Asb).
Storstrømmen Ice sheet: Storstrømmen (Danish for ‘Large Stream’) is one of the three major outlets of the North-East Greenland Ice Stream. The glacier, believed to be a surge type glacier (Reeh and others, Reference Reeh, Bøggild, Oerter, Reeh and Oerter1993a; Jung-Rothenhäusler and others, Reference Jung-Rothenhäusler, Oerter, Bøggild, Reeh, Obleitner and Olesen1995), was subject to glaciological investigations by the Alfred Wegener Institute (AWI) and GGU. The investigations included studies on glacier dynamics, glacier/climate relationships and mass balance. Surface mass-balance observations have been carried out from 1989 to 1995 (Reeh and others, Reference Reeh, Oerter, Bøggild, Jung-Rothenhausler and Henriksen1994b; Bøggild and others, Reference Bøggild, Jung-Rothenhäusler, Oerter and Higgins1995, ; both refer to glaciological investigations starting in 1988 but no surface mass-balance measurements could be found for that year). The surface mass-balance measurements, carried out along an extensive stake transect reaching from sea level to the ELA, constitute the longest time series in Greenland north of 75°N. The work on the glacier was carried out in collaboration with the GGU Eastern North Greenland expedition and was supported by the European Programme on Climatology and Natural Hazards and by the Commission for Scientific Research in Greenland.
Surface mass-balance readings contained in the database were acquired from Reeh and others (Reference Reeh, Oerter, Bøggild, Jung-Rothenhausler and Henriksen1994b); Bøggild and others (Reference Bøggild, Jung-Rothenhäusler, Oerter and Higgins1995); Jung-Rothenhäusler and others (Reference Jung-Rothenhäusler, Oerter, Bøggild, Reeh, Obleitner and Olesen1995); Unknown (unpubl. c, Reference Olesend, g).
Sukkertoppen Local glacier: Sukkertoppen Ice Cap is the locale of one of the earlier glaciological expeditions on Greenland. The Oxford University expedition of 1938 (Etienne, Reference Etienne1940) had a goal to investigate surface mass balance and energy fluxes on Sukkertoppen Ice Cap. Due to logistical problems, only part of the planned investigations were performed (Braithwaite, Reference Braithwaiteunpubl. b), among them firn studies (Etienne, Reference Etienne1940). After a few more expeditions, mostly working in the area surrounding the ice cap, Rundle (Reference Rundle1965) performed a crossing of the ice cap and measured multi-annual accumulation in a series of snow pits. The work by Rundle (Reference Rundle1965) was supported by the Ohio State University Mershon Fund and by the US Army Natick Laboratories.
Accumulation readings contained in the database were acquired from Rundle (Reference Rundle1965).
Swiss Camp/ST2 Ice sheet: In a long-term project (1991–2014) one of the co-authors (M. Stober, Stuttgart University of Applied Sciences/HFT Stuttgart) has performed geodetic campaigns in the Swiss Camp area in order to determine elevation change, surface mass balance, ice flow velocity and surface deformation. The project was mainly funded by the German Research Foundation (DFG) and by HFT Stuttgart. A short summary of most results is published in Stober and others (Reference Stober, Rott, Hönes, Grom, Floricioiu and Tijm-Reijmer2015).
There are two research areas: (1) Swiss Camp at an altitude of 1170 m, and (2) ST2 at an altitude of 1000 m, both situated in the western part of the Greenland ice sheet. In both research areas a stake network was maintained consisting of four stakes (triangle with a central stake). At Swiss Camp 12 campaigns were undertaken. At ST2 measurements started in 2004, and up till 2014 there had been six campaigns.
At Swiss-Camp (Stober, Reference Stoberunpubl. b) and at ST2 (Stober, Reference Stoberunpubl. a) the specific surface mass balance was derived from stake readings and the geodetic mass balance was calculated from digital terrain models.
Surface mass-balance readings contained in the database were acquired from Stober (Reference Stoberunpubl. a, Reference Stoberb). The GC-Net measurements from Swiss Camp (Steffen and others, Reference Steffen, Phillips, Colgan and McGrath2010) have not yet been included in the database.
Tasersiaq Local glacier: Tasersiaq Glacier is an outlet glacier of the Sukkertoppen ice cap, protruding from its eastern end towards Tasersiaq Lake (Ahlstrøm, Reference Ahlstrøm2003). A transect of six ablation stakes was maintained on the glacier from 1983 to 1989. As with Amitsuloq Ice Cap and Qapiarfiup Sermia, the measurements were carried out in the framework of GGU's program for the mapping of the hydropower potential of West Greenland (Olesen, Reference Olesen1986). The measurements have been funded from the GGU budget, supplemented with funding from the Ministry of Greenland, Denmark, and the EEC Regional Development Fund.
Surface mass-balance readings contained in the database were acquired from Ahlstrøm (Reference Ahlstrøm2003); Olesen (Reference Olesenunpubl. a).
Tuto Ramp Ice sheet: The US Army undertook a large-scale research and development program in Northwest Greenland, with the goal of establishing year-round operations on the ice sheet. A key task of the program was maintaining reliable summer access across the ice sheet ablation area via ramp roads. Between 1954 and 1964, US Army Engineers constructed and maintained two ramp roads at Camp Tuto, located at ~500 m elevation on the ice-sheet margin inland of Thule AFB. Our review of US Army engineering literature finds, for the vicinity of the Tuto ramp roads, two types of mass balance data: (1) surface mass-balance measurements were carried out with the direct glaciological method (Schytt, Reference Schytt1955; Griffiths, Reference Griffiths1961). Most of the data are described and tabulated in great detail by Schytt (Reference Schytt1955), including surface mass-balance observations for parts of the accumulation area (up to 30 km away from the Tuto ramp). (2) We find numerous charts of annual ice surface profiles relative to ramp road centerline position (WES, 1959; ACFEL, 1963; Davis, Reference Davis1967, Reference Davis1971; Fig. 8). Given the US Army Engineer's design criterion of preventing ice ablation beneath the ramp roads (i.e. maintaining subzero year-round basal road fill temperatures; ACFEL (1963)), the annual increase in the elevation of a ramp road relative to surrounding ice reflects annual surface ablation (Fig. 8). This second class of measurements is described and discussed in the following.

Fig. 8. A sample of multi-annual cross-sectional ramp road profiles from ‘13+00’, also known as ‘MP1’ (figure reproduced from Davis, Reference Davis1971). South is to the right.
We digitally interpolated annual ice-surface elevation changes relative to ramp road centerline from cross sections presented in WES (1959); ACFEL (1963); Davis (Reference Davis1967, Reference Davis1971). Where necessary, we also digitally interpolated position information from a georeferenced version of the local coordinate system ramp road map created by Davis (Reference Davis1971) (Fig. 9). We only digitized relative elevation changes on the south side of the ramp roads, thus minimizing the apparent interference of the ramp roads themselves with solar radiation. We also employed the furthest field relative elevation changes possible, to minimize the potential influence of ramp road-derived dust and debris on surface ablation (Fig. 8). In assessing the uncertainty associated with digitizing these legacy observations, we combine in quadrature a fixed 0.30 m w.e. (or 1 US foot) digitization uncertainty, as well as a fractional ‘disturbance’ uncertainty that decreases with distance from ramp road centerline. This latter uncertainty reflects that these repeat profile surveys were not collected exclusively for glaciological use, and therefore acknowledges disturbance mechanisms such as elevated dust or debris and slight ablation of ice beneath the ramp road.
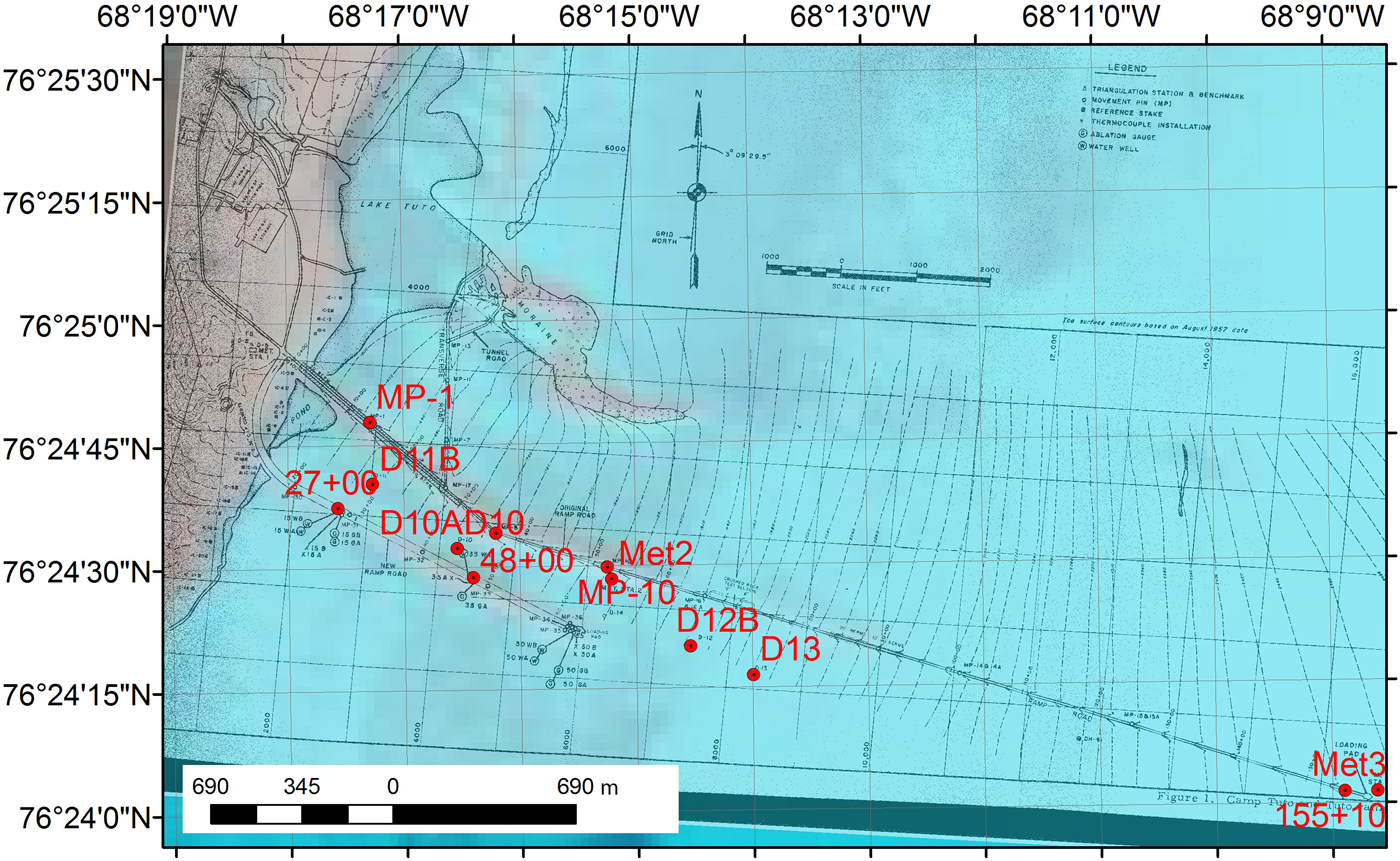
Fig. 9. Tuto ramp road sites of surface mass-balance observations. A georeferenced version of the site map of Davis (Reference Davis1967) overlaid on a 2002 Landsat 7 false colour image.
WES (1959) demonstrates that increased surface ablation on the south side of the original ramp road, due to enhanced debris and dust, decreases from 100% immediately adjacent to the ramp road, to negligible 105 m away. We therefore parameterize disturbance uncertainty as an exponential decrease from 100% at 0 m off centerline to a minimum of 10% at, and beyond, 105 m off centerline. We note that US Army Engineers intentionally spread both waste lubrication oil and diesel fuel along the ramp roads as an ‘effective dust palliative’, to prevent the removal of the topmost fine material cover over coarser fill (ACFEL, 1963). While dust may potentially increase the inferred ablation of surrounding ice, any ablation of the ice beneath the ramp road decreases relative elevation changes, and potentially underestimates inferred ablation. Using thermocouples and under-road ablation pin gauges, Davis (Reference Davis1967) demonstrated that the 0°C isotherm is capable of penetrating ~1.5 m of road fill and causing ~0.1 m of summer ablation. The net effect of this slight change in relative ramp road elevation potentially results in underestimating the ablation of surrounding ice by ~6%. We therefore suggest that the major sources of uncertainty associated with the Tuto ramp road legacy surface mass-balance data, namely digitization and counteracting dust and relative road elevation effects on ablation, are acknowledged within the measurement-specific uncertainty estimates we provide.
Surface mass-balance measurements were also carried out by Hooke (Reference Hooke1970) but have not yet been included in the database.
Two PROMICE AWSs, named THU_L and THU_U after the Thule region, were established on Tuto ramp. Due to the low ELA and a correspondingly narrow ablation area the stations are both positioned within 4 km from the margin. This site was chosen due to its proximity to the Thule Air Base, providing the possibility for land-based access to the stations. See ‘Isertoq ice lobe’ for more details on PROMICE.
Surface mass-balance readings contained in the database were acquired from Schytt (Reference Schytt1955); Griffiths (Reference Griffiths1961); ACFEL (1963); Davis (Reference Davis1967, Reference Davis1971); Fausto (Reference Faustounpubl.).
Tvillinggletscherne Ice sheet: Two neighbouring (‘Tvillinggletscherne’ = Twin Glaciers) valley shaped and land terminating outlet glaciers, located directly adjacent to the southern margin of the Nunatarssuaq ice ramp. The glaciers were monitored for ice movement and surface mass balance by White (Reference White1956) in parallel with the investigations at Nunatarssuaq.
Surface mass-balance readings contained in the database were acquired from White (Reference White1956).
Upernavik Ice sheet: The PROMICE AWSs UPE_L and UPE_U (named after the nearby town of Upernavik) were established in summer 2009 between large ice streams in the ablation area at ~2 and 26 km from the margin respectively. This site was chosen due to its representativeness of the regional ice margin, and its relative proximity to the Upernavik airport. See ‘Isertoq ice lobe’ for more details on PROMICE.
Surface mass-balance readings contained in the database were acquired from Fausto (Reference Faustounpubl.).
Valhaltinde Glacier (Valhaltindegletscher) Local glacier: Valhaltinde Glacier is a small local glacier of 1.9 km2 covering the northern slopes of the Valhaltinde mountain in Johan Dahl Land, south Greenland. The glacier is situated in the elevation range 1080–1630 m a.s.l. Surface mass-balance measurements were carried out during the period 1978–83. The main purpose was to ‘calibrate’ or compare the results with the results from the adjacent Nordbo Glacier. The investigations were part of a GGU program for regional mapping of the hydropower potential and partly funded by the Danish Ministry of Energy.
Surface mass-balance readings contained in the database were acquired from Clement (Reference Clement1981b, Reference Clementc, Reference Clement1982a, Reference Clementc, Reference Clement1983a, Reference Clementb).
Violin glacier Ice sheet: Violin glacier is a land terminating outlet glacier ~4 km in width and ~65 km in length, located in mountainous east Greenland. The PROMICE AWSs SCO_L and SCO_U are located ~15 and 45 km from the glacier front, respectively, both well into the ablation area. The measurement record started in summer 2008. This site was chosen due to its relative proximity to the airport at Constable Point, and named ‘SCO’ after the Scoresbysund region. See ‘Isertoq ice lobe’ for more details on PROMICE.
Surface mass-balance readings contained in the database were acquired from Fausto (Reference Faustounpubl.).


 Open access