


Introduction
The recycling of polyethylene terephthalate (PET) can be realized in many ways: primary recycling, mechanical recycling, chemical recycling, and energy recovery [Reference Karayannidis and Achilias1]. The chemical recycling is used for complete recovering of the molecules constituting the PET. The recovered monomers, mono-ethylene glycol (MEG), and purified terephthalic acid (PTA) can be used to produce virgin PET. However, the long reaction time in combination with the high energy consumption is the main concern of this recycling technique.
The microwave assisted de-polymerization of PET provides a significant acceleration of the reaction process by a factor greater than 10. Additionally, the microwave assisted de-polymerization takes place at lower temperatures and therefore under lower pressure conditions [Reference Achilias2].
Till today different investigations are ongoing in the area of microwave assisted PET recycling at laboratory scale [Reference Nikje and Nazari3–Reference Siddiqui5]. However, the main problem for the design of an industrial scale applicator is the restricted penetration depth (in the range of some millimeters) in the reaction mixture and the demand for a continuous operation to meet the economic needs. In the patents US 5,589,140 [Reference Takahashi6] and US 5,145,576 [Reference Lataillade7], a new method, the corresponding apparatus, and scenario for a continuous heating of the reaction mixture with an electromagnetic field are presented. The design relies on a metallic Archimedean screw placed in a microwave transparent tube, which transports the full mixture through the microwave cavity.
Though the present paper is based on the above mentioned two patents it is relying on an absolutely new, advanced microwave applicator design, which meets the needs of an industrial scale process of de-polymerization of PET.
Dielectric characterization of the reaction mixture
Materials
In the de-polymerization reaction, the PET is hydrolyzed in sodium hydroxide (NaOH) that yields to the disodium salt, Na2[PTA], and monoethylene glycol (MEG) [Reference Spaseska and Civkaroska8]:
 $$[{\rm PET}] + 2{\rm NaOH\;} \to {\rm Na}_2 [{\rm PTA}] + [{\rm MEG}].$$
Since the dielectric properties of the fully hydrolyzed mixture are not known a priori, two samples were characterized versus temperature: “initial mixture” (not reacted) and “final mixture” (100% reacted). The molar compositions of the reaction mixture before and after the hydrolysis are given in Table 1.
Table 1. Molar volumes of the reagents

MEG and PTA are obtained from Alfa Aesar with a grade purity ≥ 99% and ≥ 98%, respectively. NaOH is obtained from Merck Millipore with a purity of ≥ 99%. The PET particle size is about 20 µm.
Dielectric measurements
The electric component of an electromagnetic wave in the microwave range transfers energy into materials dominated by ionic or electronic conduction and polarization [Reference Dakin9]. Since many materials have both dielectric and conductive losses in the following those will be summarized as effective relative dielectric loss factor ε″r. The ratio of ε″r to the relative dielectric constant ε′r is defined as the dielectric loss tangent tanδ.
 $$\tan \delta = \displaystyle{{\varepsilon ^{\prime \prime}_r} \over {\varepsilon ^{\prime}_r}}. $$
 If the electromagnetic wave propagates through the dielectric material, its amplitude progressively attenuates in the propagation direction. The distance at which the power of the incident wave attenuates by  $1/e \approx 37{\rm \%} $ is called the penetration depth, D p [Reference Von Hippel10]. It can be approximated (for a plane wave) as follows [Reference Von Hippel10]:
 $$D_p = \displaystyle{{c_0} \over {4\pi f}}\sqrt {\displaystyle{2 \over {\varepsilon ^{\prime}_r}}} \left[ {\sqrt {1 + \tan ^2 \delta} - 1} \right]^{ - (1/2)}. $$
The higher the dielectric losses of the material, the lower the penetration depth. Accordingly, the dielectric properties of the material have a significant influence on the design of an appropriate microwave applicator.
A successful design of any microwave applicator requires the detailed knowledge of the dielectric properties of the processed material versus the operating temperature. In-situ measurements offer the unique possibility to characterize the transient behavior of the material constants. In the present work, the measurement setup is based on the simultaneous excitation of the TM 010 and TE 111 mode in a cylindrical cavity at the same frequency at around 2.45 GHz [Reference Ramopoulos11], enables the in-situ monitoring of the effective dielectric properties of the reaction mixture during the process of alkaline hydrolysis of PET. Note that the utilized approach allows the dielectric characterization of materials with significantly higher permittivity as usually considered for the classical perturbation method [Reference Bethe and Schwinger12, Reference Chen13]. The key component of this measurement system is a tunable solid-state power amplifier, which provides up to 50 dBm (100 W) output power and network analyzer which serves as a swept power source and detector for the transmitted power. It enables the simultaneous heating and measuring of studied material in the cavity at the resonance frequency.
The dielectric measurements were performed with the measurement setup based on the cavity perturbation method as described in [Reference Ramopoulos11]. The estimated measurement accuracy amounts about 5% for the dielectric constant and 10% for the dielectric loss factor. A photo of dielectric measurement setup is shown in Fig. 1. For active control of the cavity temperature, two Peltier elements of type QC-241-1.0-3.9 M were installed on the cavity wall.
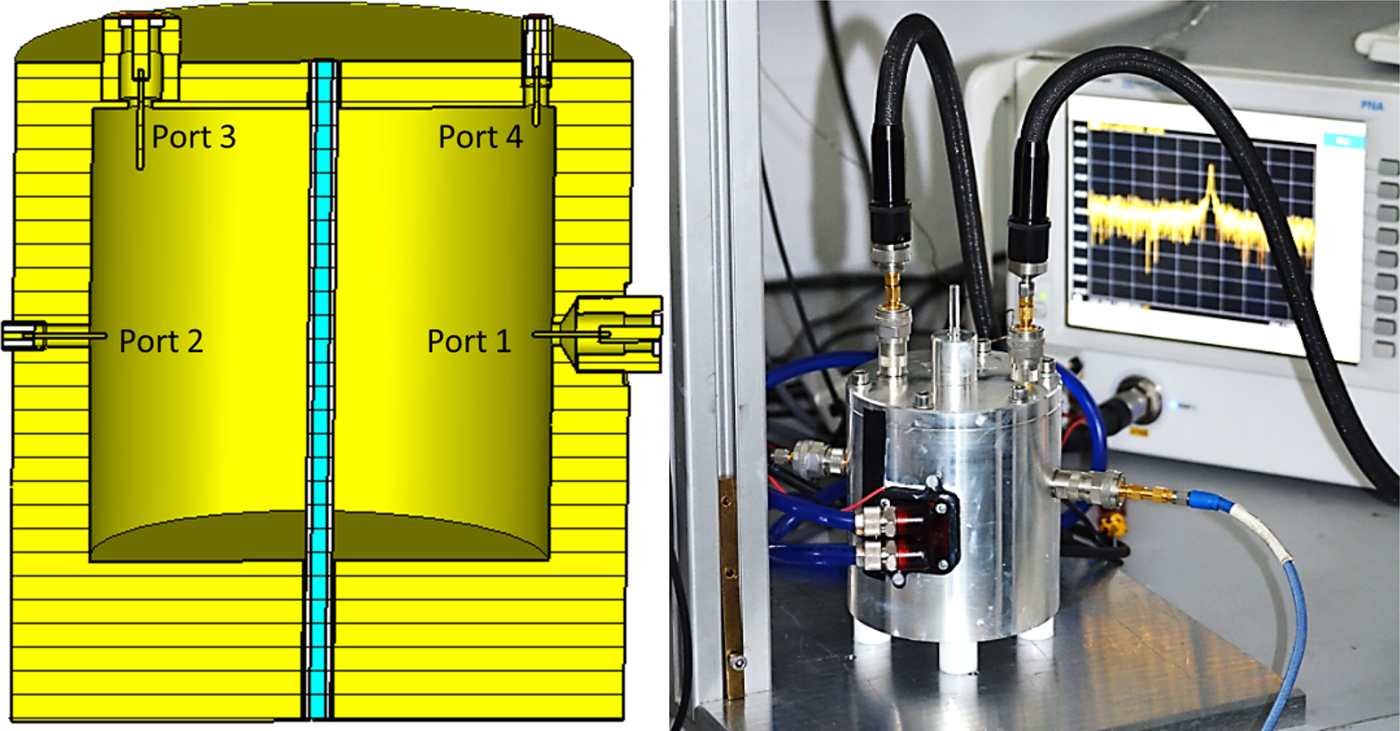
Fig. 1. Designed dual-mode cavity for the dielectric measurements setup.
The stabilization of the cavity temperature avoids parasitic changes in cavity geometry and electric conductivity that both influence the measurement accuracy. The TE 111-mode is coupled through a coupling element at port 1 and decoupled at port 2 which are placed at the side of the cavity (see Fig. 1). The TM 010-mode is coupled at port 3 and decoupled at port 4, which are placed at the top plane of the cavity (see Fig. 1). This coupling design enables an isolation of about 60 dB between both modes. As a sample holder, a fused quartz tube with an inner diameter of 2 mm and an outer diameter of 6 mm is used. During measurements, the sample and the resonator are oriented horizontally to avoid sedimentation of the solid PET parts of the sample. The sample holder was closed at both ends with Swagelok connectors, which can resist a pressure up to 18 bars. For the temperature measurements, a fiber optic thermo-sensor type Optocon Fotemp-H was used which is placed at the center of the sample. The thermo-sensor data are used for temperature control along a preset temperature scenario with the help of a PID control algorithm. The TM 010 mode was used for the sample heating as it provides a homogeneous sample heating over the full cavity length. In Fig. 2 the time and temperature dependent dielectric properties for mixtures from Table 1 are presented. The heating rate was set to be 3 °C/min and the cooling rate was 5 °C/min. Larger heating rates were not possible, because of the long integration time of the thermo-sensor, and due to the risk of boiling within the sample volume that could lead to leakage problems.
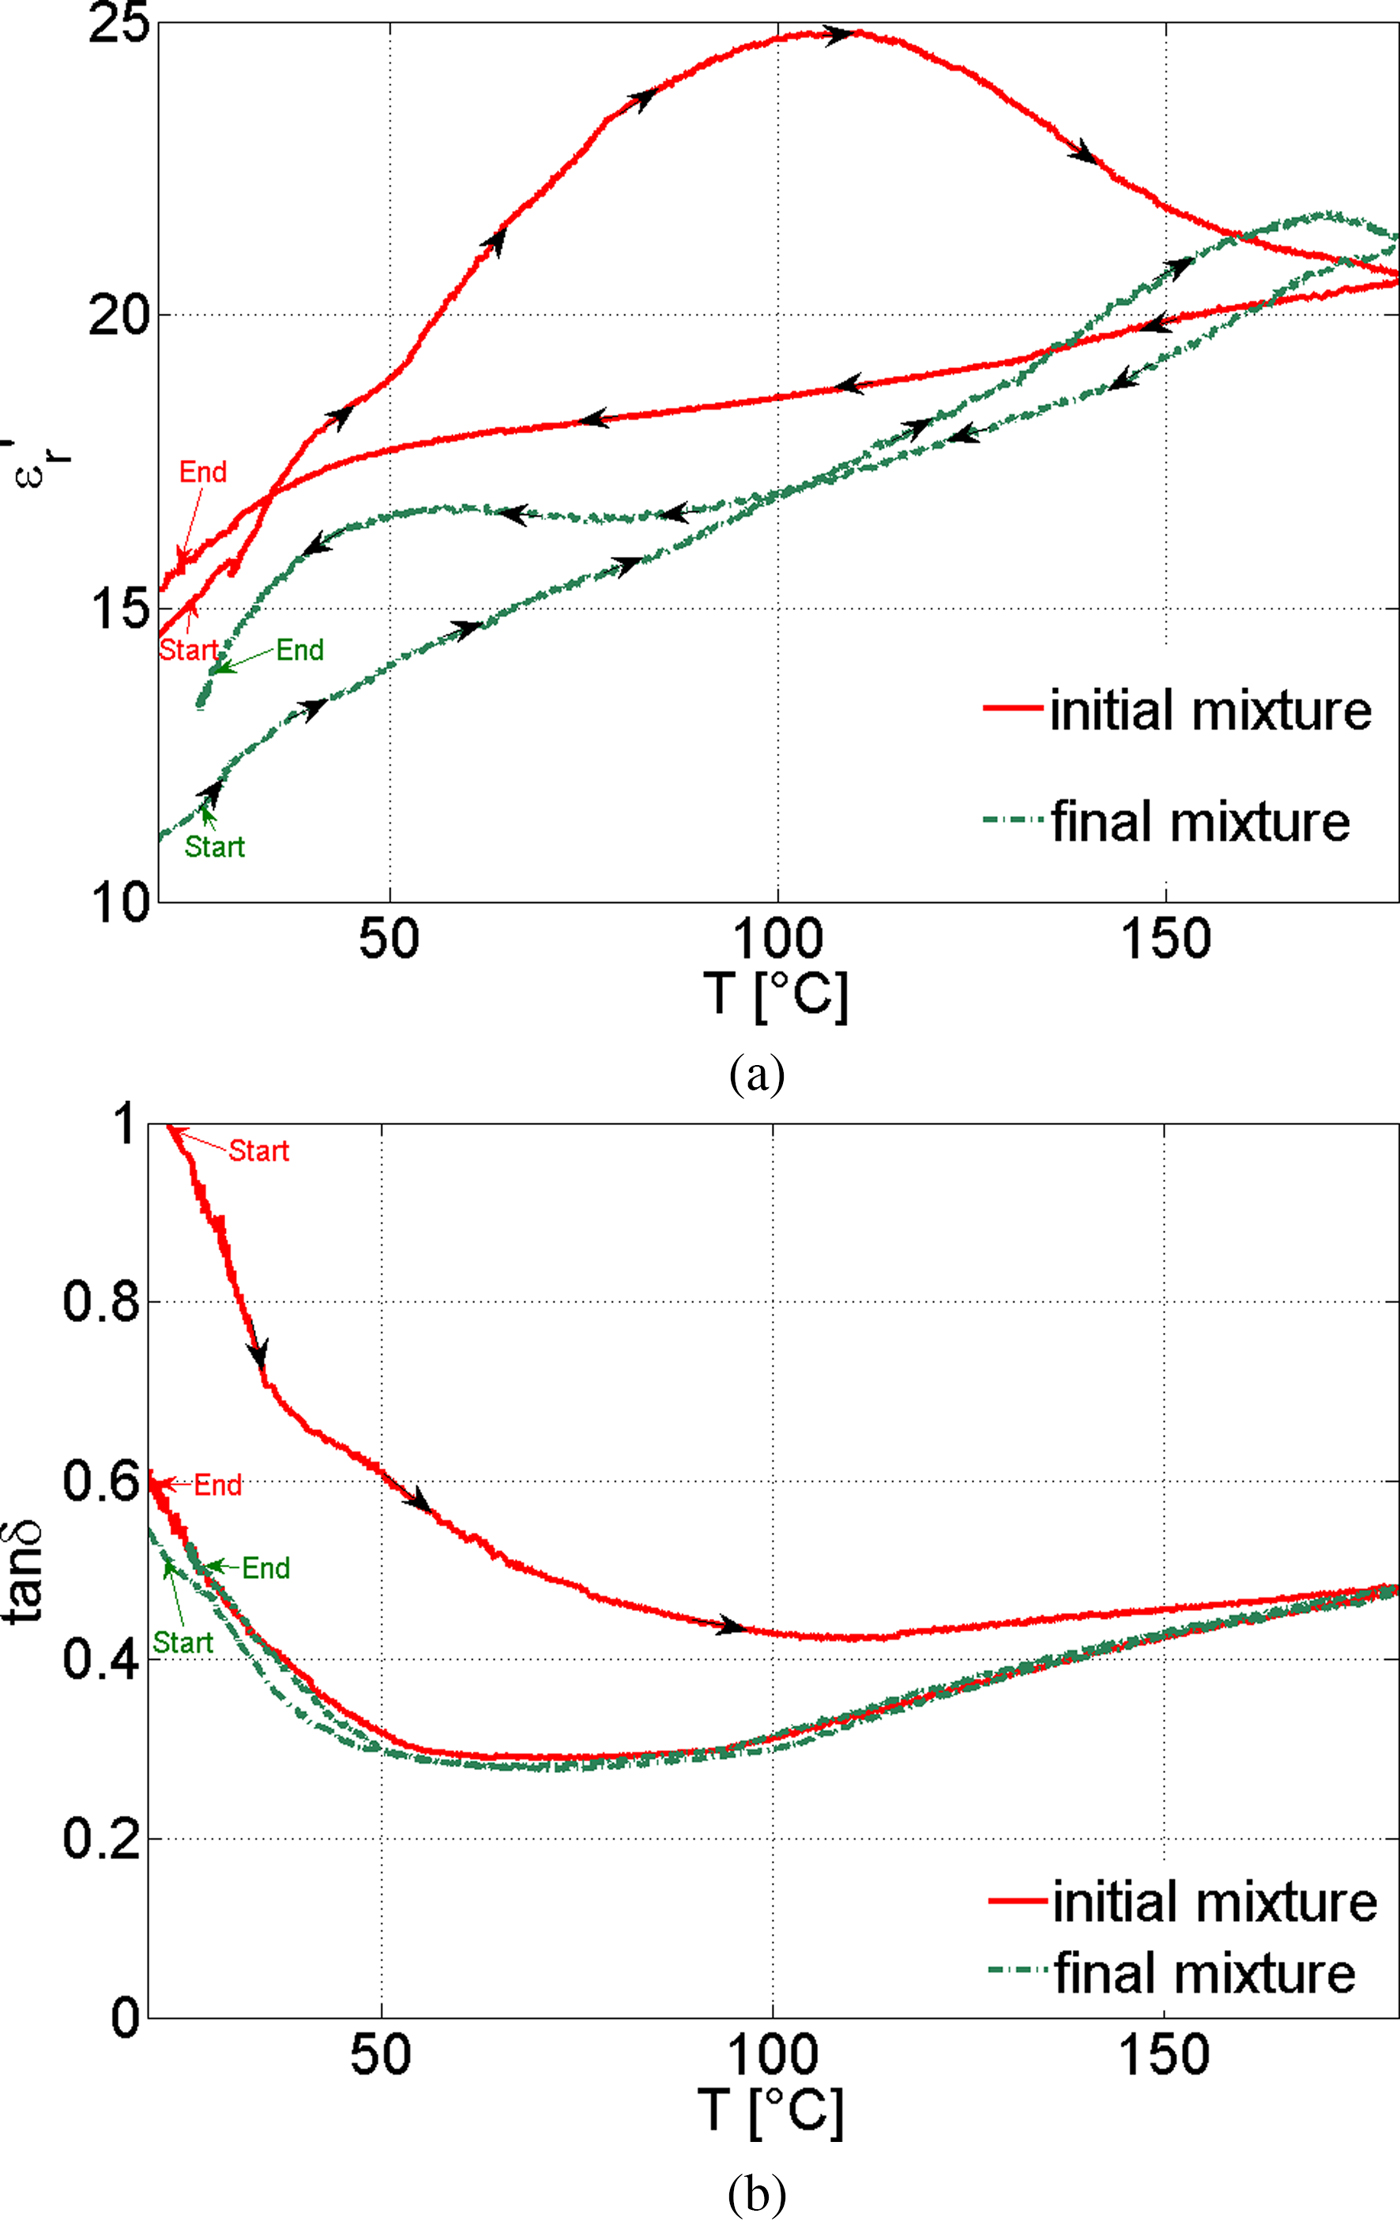
Fig. 2. (a): Temperature depending dielectric constant for the initial mixture and final mixture. (b): Temperature depending dielectric loss tangent for the initial mixture and final mixture.
For a more complete characterization, the permittivity of both mixtures was measured during the heating/cooling cycle. For the “initial mixture” (shown in the red curve), the difference in the dielectric constant and the dielectric loss factor during the heating phase and cooling phase provides direct information on the chemical process. The sample “final mixture” (shown in green curve), which represents the properties of the suspension when the chemical de-polymerization process is finished, follows quite well the cooling curve of the sample “initial mixture”, indicating that the chemical process is finished as soon as the target temperature 180°C is reached. That is probably caused by the slow heating rate of 3 °C/min as well as by the fact that the PET used was a rather fine powder. In case of a faster heating rate and the use of larger PET particles or flakes, some isothermal dwell at the targeted reaction temperature might still be needed.
Thus, for the system design, the permittivities measured for the sample “initial mixture” are important while they are representing the variation of its dielectric properties along the full process of de-polymerization. In order to get a robust applicator design, the future applicator must be able to work efficiently over the full range of the dielectric constant which is 15 < ε′r < 25. The difference between the heating and cooling process for the final mixture (green curve) may be explained by an energy demand for binding of NaOH and PTA to Na2PTA.
Cavity design
The microwave applicator has to meet the following specifications.
• It must enable a continuous operation with the use of a metallic Archimedean screw within a glass tube, transparent to microwaves.
• It has to provide a homogeneous field distribution in axial and azimuth direction of the reactor.
• It should provide a production rate for the de-polymerization of PET of at least 12.5 kg/h and accordingly an overall flow rate of at least 100 kg/h in total (PET, MEG, NaOH, and H2O together)
Archimedean screw geometry
For the microwave assisted de-polymerization process, PET and appropriate catalysts have to be transported through the microwave field pattern. This is achieved by the use of a metallic Archimedean screw placed in a microwave transparent glass tube. To make sure that the metallic structure of the Archimedean screw allows an efficient penetration of the electromagnetic field into the liquid sample, the influence of the Archimedean screw design on the microwave power absorption has been investigated. The parameters that have been varied were the screw pitch d as well as the thread depth h (Fig. 3). To simplify the discretization in the numerical model and to reduce the simulation efforts the screw with pitch d has been modeled by parallel discs with distance d (see Fig. 3).

Fig. 3. Part of the Archimedean screw (left) and simplified model (right).
The influence of the screw parameters was investigated independently from the applicator design. For the following investigation a standard rectangular cavity, similar to the one from the household microwave oven, that measures 310 mm × 375 mm × 200 mm, was used. It is expected that a variation of the screw diameter (D) will not have a significant impact and, therefore, it is chosen equal to 100 mm for the following investigation. The dielectric constant for the medium ε′r was set to 30. The corresponding wavelength λ within the medium at the typical operating frequency of the magnetron (2.46 GHz) is equal to 22.3 mm. The depth of the thread h, as well as the screw pitch d have been varied between λ/4 and λ in order to study the effects of the resonant and non-resonant behavior.
The estimated absorbed power in the liquid sample (given in percentage of excited microwave power) for ε′r = 30 and tanδ = 0.01…1 are shown in Table 2 with a variation of d and h, which were scaled with the wavelength λ = 22.3 mm. It should be noted, that the listed absorbed power is integrated over the whole material volume.
Table 2. Simulated relative power absorption for different screw parameters, scaled to the wavelength
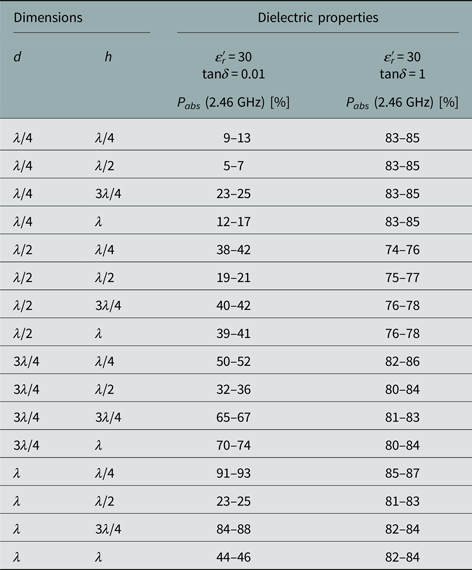
Table 2 reveals a significant influence of the screw geometry on the efficiency of the applicator, in particular for a material with a low dielectric loss tangent (tanδ = 0.01) which has a higher penetration depth. The dielectric loss tangents of the investigated PET suspension is in the range 0.4 < tanδ < 1 (see Fig. 2(b)), therefore the simulation results for tanδ > 0.4 are indeed relevant to experiment. At the same time, the differences between resonant (grey lines in Table 1) and non-resonant screw parameters are no longer obvious and may almost disappear for tanδ = 1 when the penetration depth D p is in the range of about 3 mm. Thus the optimal resonant screw pitch and depth of the thread are chosen as follows:
 $$d = 2n\displaystyle{\lambda \over 4};\,n \in N$$
 $$h = (2n + 1)\displaystyle{\lambda \over 4};\,n = 0,1,2{\rm \;} $$
Because of the tangential electric field, which is zero at a perfect conductive surface and has a maximum in a distance h the screw depth acts like a quarter-wave wavelength transmission line equivalent to a short to open transformation. This enables a maximum coupling of the microwave power into the material in-between two neighboring threads. Figure 4 demonstrates the relative absorbed power for different tanδ for a favorable and an unfavorable screw geometry. From that figure, it can be seen that the screw geometry significantly influences the efficiency of the applicator in particular for materials with tanδ < 0.5.
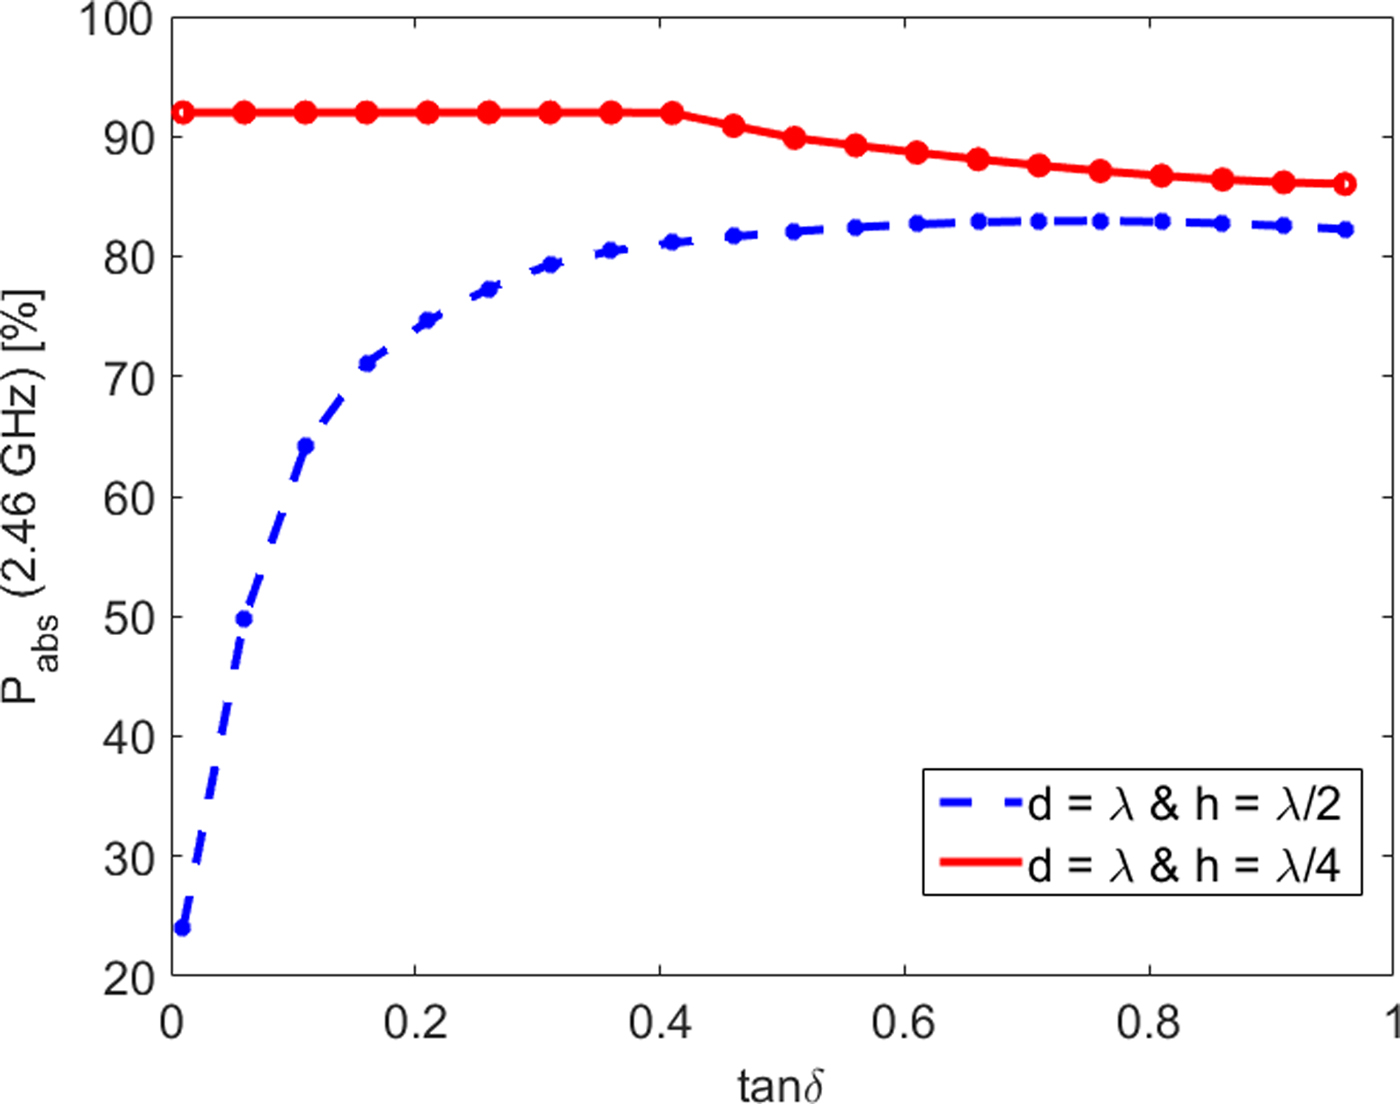
Fig. 4. Simulated relative power absorption as a function of tanδ (@ 2.46 GHz and ε′r = 30).
Applicator geometry
The outer diameter of the glass tube is chosen of 250 mm and the wall thickness of 10 mm. The modular concept implies the applicator is subdivided into N segments. The use of this new and innovative modular concept enables any specific temperature profile along the reactor within the suspension flowing through the applicator. The appropriate microwave power levels in each segment are chosen individually, resulting in the corresponding temperature gradients which are also depending on the flow velocity (see Fig. 5).
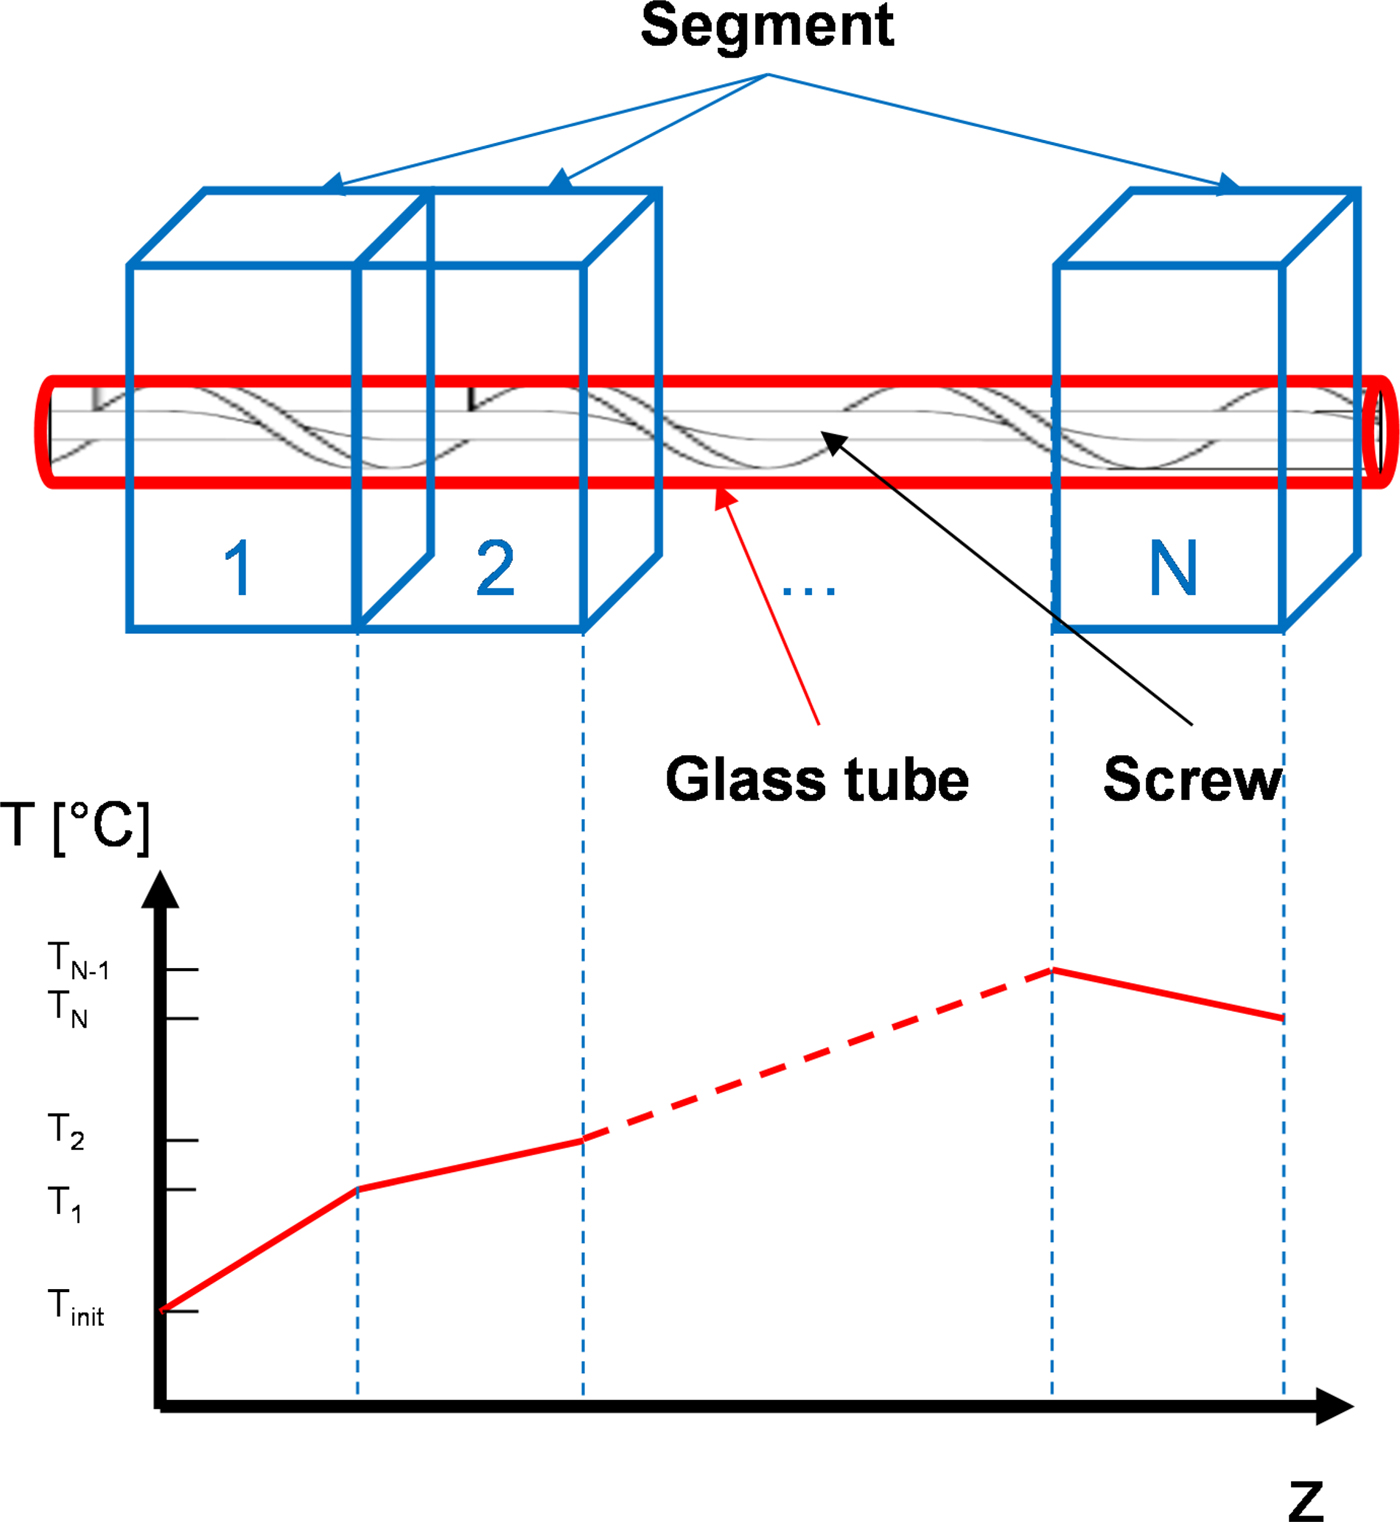
Fig. 5. Principal design of the microwave reactor (top), temperature profile (bottom).
The reaction temperature of the de-polymerization as reported in [Reference Siddiqui5] is in the range from 150 to 220°C. The investigated reaction mixture has a specific heat capacity of 2.3 kJ/(kg K) and density of 1.20 g/cm3. In order to heat the sample with a total mass of 100 kg from room temperature to the reaction temperature for 1 h, it is required at least a heating power between 8.3 kW and 12.8 kW depending on the final reaction temperature.
The process temperature exceeds the boiling point of the aqueous phase of the reactive mixture, which is about 130°C. Since it is not feasible to find a cost-effective glass tube with a diameter of 250 mm specified for higher pressure (>5 bar), a pressurized microwave cavity is required. It will significantly reduce the failure probability of the glass tube. The preferable geometry of the microwave cavity is cylindrical. At the same time, considering the investment and installation efforts, the number of coupling ports with pressure tight microwave windows and accordingly the number of microwave generators should be reduced to the absolute minimum. Therefore, in the following design studies, only one magnetron and hence one quartz window per segment was considered in the design. For the coupling of the microwaves, a standard WR340 waveguide was used.
Figure 6 shows the simulated electric field density in a cylindrical cavity with 336 mm in diameter and a length of 250 mm with a single microwave port on the left side. The hollow space in the cavity center is occupied by the core of the Archimedean screw. The sample has a form of a hollow cylinder and occupies the volume between the inner side of the glass tube (diameter of 250 mm) and the outer side of the Archimedean screw. Thus the sample material has a thickness of 10 mm only. From Fig. 6 it can be seen, that the electric field is concentrated near the port position and shows strong inhomogeneity in the z-direction as well as in the azimuthal direction. The inhomogeneity in the z-direction can be avoided by limiting the cavity length in z-direction to 50 mm < λ/2. It results in the wave pattern with a strong orientation of electric field in z- direction. The dominant mode for such a setting is TE 10n, where the first index refers to the radial direction, the second index refers to the axial direction and the third index refers to azimuthal direction. It should be noted, that in the “short” cavity the azimuthal inhomogeneity of the electric field still remains. A further improvement of the field distribution in the applicator may be achieved by means of a distributed multi-coupling approach. Such a concept enables a well-defined power distribution over the azimuthal direction of the resonator. The optimized distribution network is shown in Fig. 7. This design consists of a single microwave port, which connects the magnetron to the distribution network. The microwave power is guided over five levels and each level is connected via a coupling aperture. In every level, the power is able to enter in the azimuthal direction from the outer resonator ring through four coupling apertures into the inner ring which is used for sample heating. The inner and the outer rings work similar to two narrow-wall coupled waveguides.
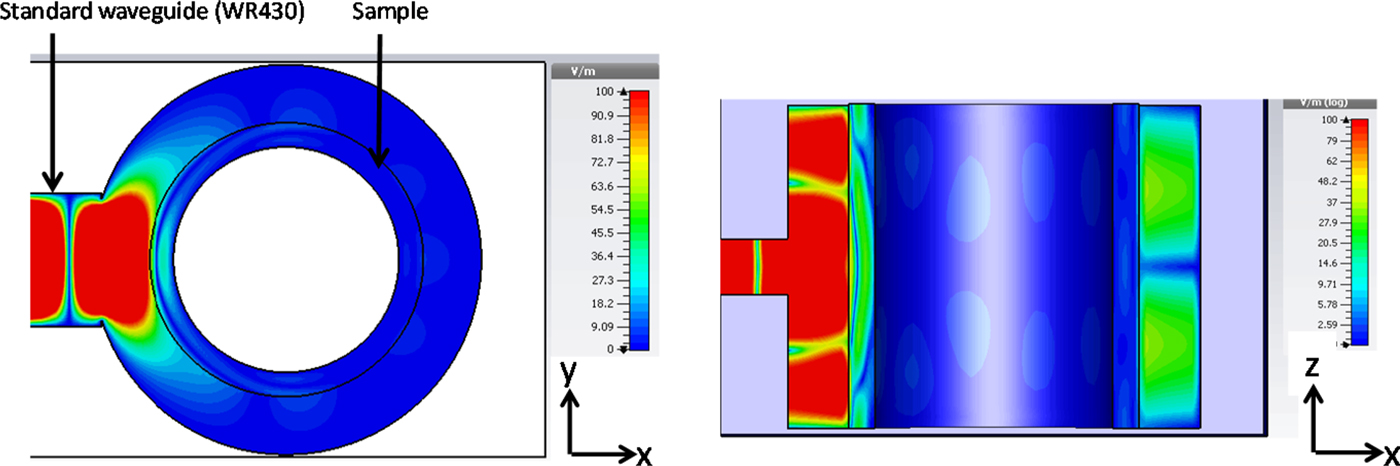
Fig. 6. Simulated electric field in the cylindrical microwave cavity.
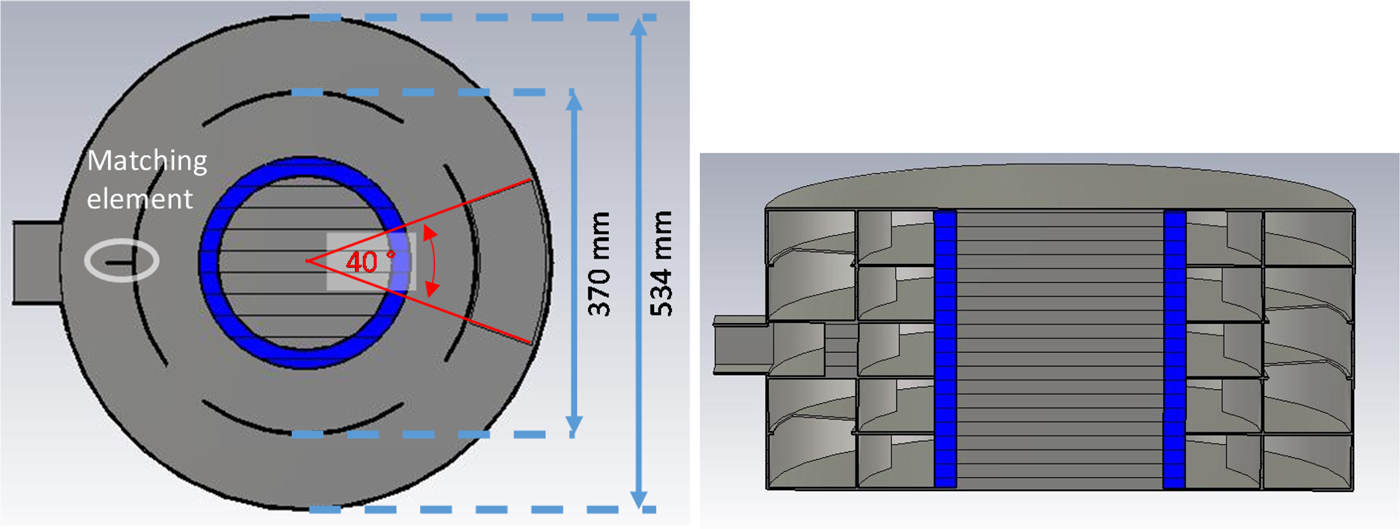
Fig. 7. Simulated geometry of center zone (left), side view (right).
The total applicator length of 250 mm is divided equally into five levels. The number of levels can be varied depending on the required sample length and/or required power density. The coupling aperture between the neighboring levels should have a length of about λ and depends on the width of the outer resonator only. In the middle level, where the microwave power from the magnetron is coupled through a standard WR340 rectangular waveguide port, the coupling aperture to the neighboring levels is positioned opposite to this port (see Fig. 7 right). The top and bottom levels next to those are connected via coupling ports positioned axially symmetrical (rotated by 180°) to the one described before.
For a 534 mm-diameter of the outer resonator, the width and length of the coupling aperture into the inner ring is equal to 72 and 157 mm, respectively (which were found empirically in the process of applicator optimization) (Fig. 7).
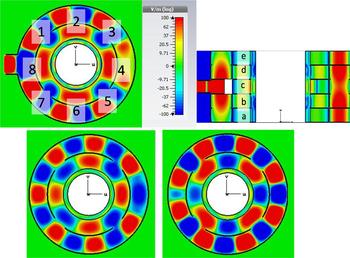
Table 3 lists the microwave power distribution in the microwave cavity load for the five individual layers with eight segments in each layer, equal in size. The labeling of the different sample parts is shown in Fig. 8. The listed power levels are given in percent of the total power absorbed in the applicator.
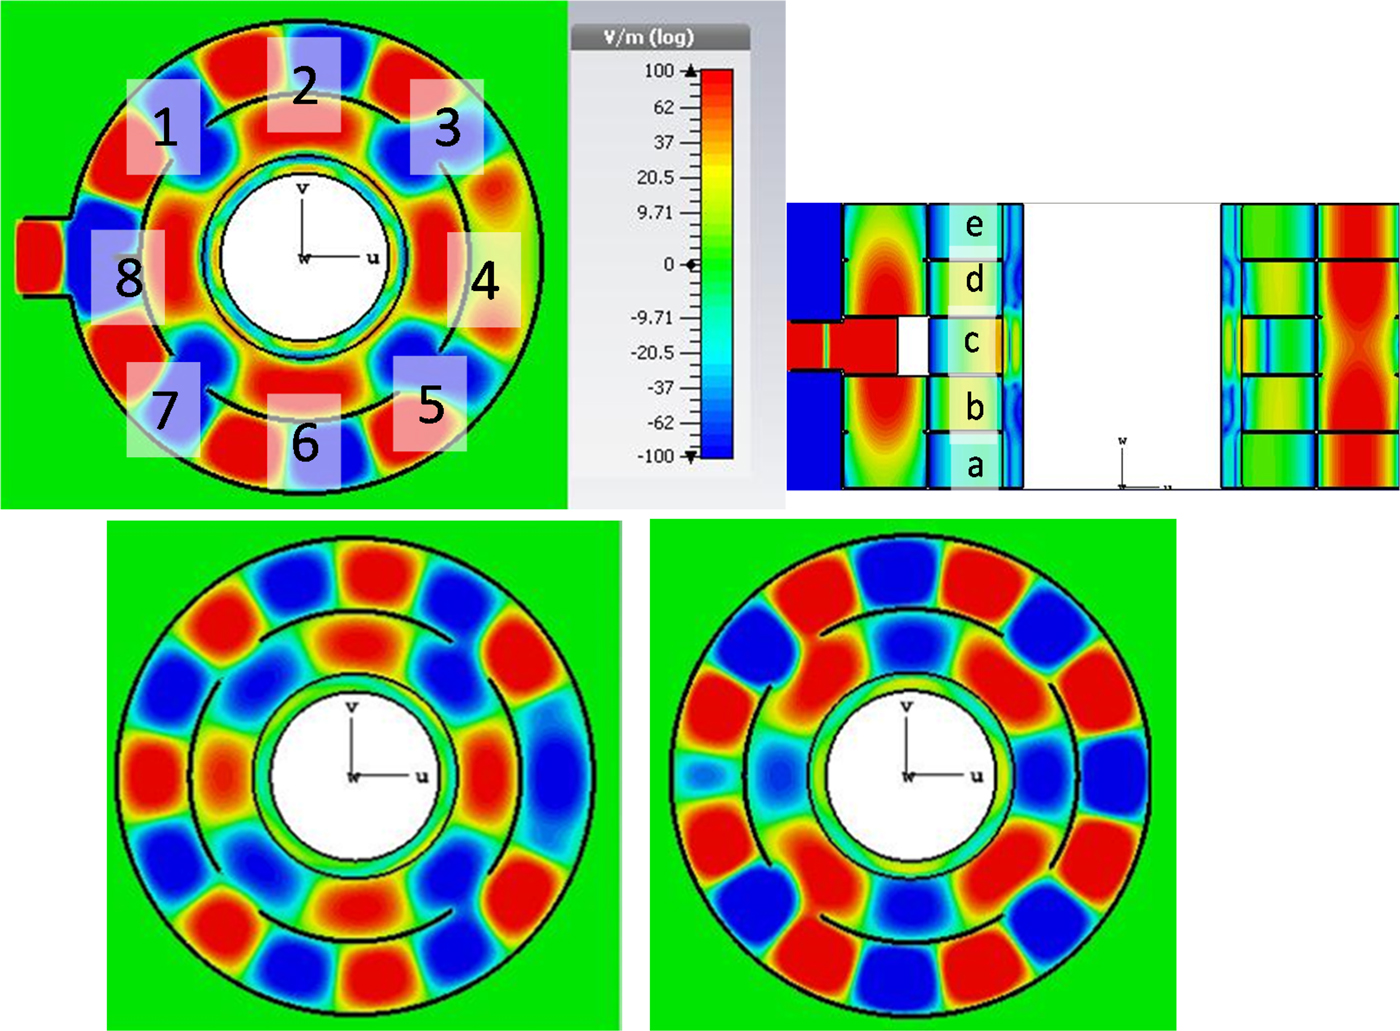
Fig. 8. Electric field distribution of the power distribution network design in azimuthal direction of zone c (upper left); of levels b and d (lower left); of levels a and e (lower right) and in the axial direction (upper right).
Table 3. Power distribution in the cavity load [% of the absorbed power]

With this power distribution network, a much more homogeneous microwave field distribution inside the material sample can be achieved. To further increase the system efficiency, a matching element at the feeding port is needed. Such an element is shown in Fig. 7. It is positioned inside the outer resonator ring in front of the input waveguide port (only in the center level) and it is oriented parallel to the electric field in the coupling waveguide. Already a small misalignment (<3°) of this element leads to a significant change of the power distribution in the center level “c”. The power distribution in adjacent levels is not affected. For example, a clockwise rotation of the matching element from 1° to 3° leads to an absorbed power for the sample part 1 and 7 from 1.5 and 3% of the total absorbed power, respectively, and the total absorbed power in the applicator is reduced by 2%. The matching element reduces the reflected power by more than 10%. The overall power efficiency with and without matching element as a function of frequency is presented in Fig. 9.
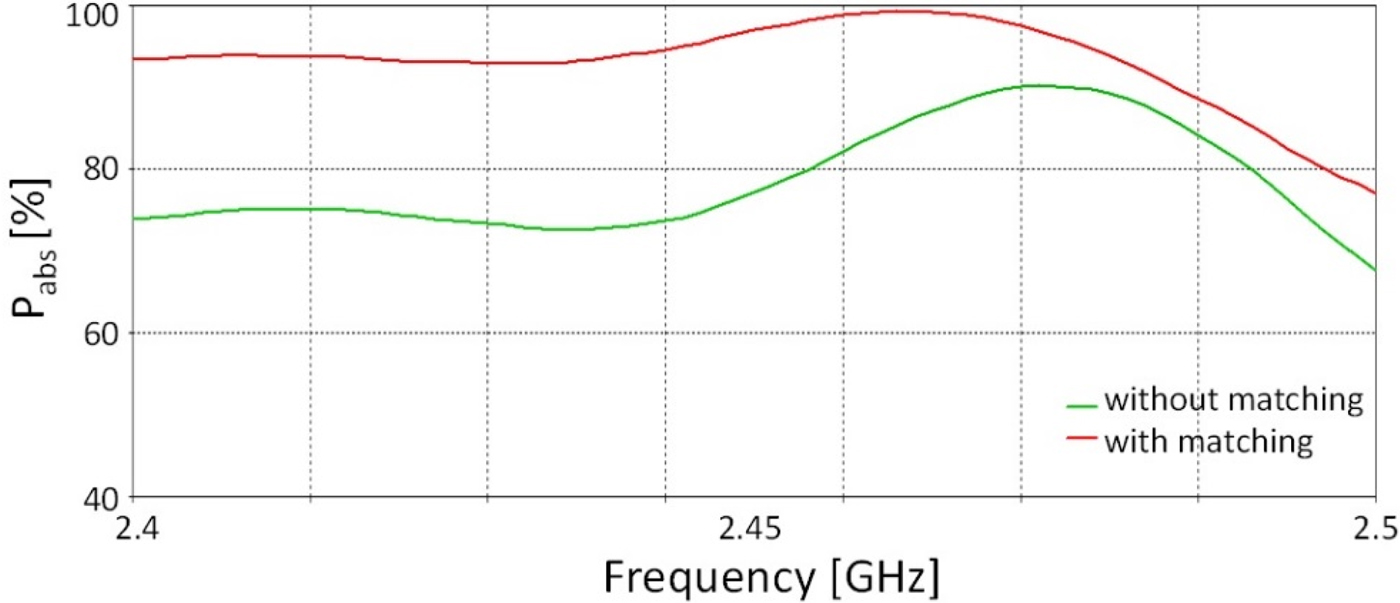
Fig. 9. P abs(f) at the single microwave port.
The designed applicator based on the power distribution network had been tested also for the case of the inhomogeneous material sample. This investigation had been realized with the aid of full-wave 3D numerical simulation. Based on the measured dielectric properties in the section “Dielectric characterization of the reaction mixture”, the dielectric constant in the five different levels a, b, c, d, and e (see Fig. 8 upper left) have been chosen as follows: the dielectric constant of the sample equals 15, 20, 25, 20, and 10 in the level a, b, c, d, and e, respectively; and the loss tangent is set equal 0.7, 0.6, 0.5, 0.4, and 0.3 accordingly. Such inhomogeneity in permittivity leads to the inhomogeneity in the axial power distribution between the different layers by a factor of  $ \pm 20{\rm \%} $, in comparison with $ \pm 3.5{\rm \%} $ in case of a homogeneous material.
The specific heat capacity of the mixture is assumed to be 2.3 kJ/(kg K) (see the section “Materials”), which is mainly determined by H2O and MEG. The installed microwave power is set to 2 kW. The axial flow velocity of the suspension through the applicator is equal to 1.67 mm/s. Under these assumptions, a maximum temperature deviation of about 4°C from the expected linear temperature rise, resulting from a fully homogeneous power distribution in the applicator, can be estimated. Such an inhomogeneity will not have significant influence on the overall quality of reaction. Furthermore, taking into account the convection forced by the Archimedean screw such inhomogeneity is expected to be even lower.
Depending on the power demand, the presented design may be easily modified into a shorter applicator using only three separate layers with one single microwave port. In that case, the overall geometry does not need to be varied. Only the width of coupling apertures in the different levels must be modified accordingly. Additionally, this design may be scaled up for larger cylindrical samples. In that case, the phase dependencies on the coupling positions have to be accounted. Additionally, the resonance frequency of the presented design is mainly defined by the external resonator and it is not significantly influenced by the actual heating cavity, which consists of the inner resonator rings. This makes the particular design very robust against the variation of material permittivity.
Experimental setup and results
At fabrication, the designed microwave cavity had been slightly modified in the wall thicknesses and radius of edges to enable a cost-efficient manufacturing. For testing purposes, a hollow cylindrical sample with 183 mm outer diameter and 171 mm inner diameter, and dielectric parameters of ò′ = 15, tanδ = 0.3 is chosen. Intentionally, the thermal conductivity of the chosen Material Under Test (MUT) is low. Doing that the field homogeneity can be proven. The MUT consists of several stacked cylinders (layers) with tiny vertical cuts. It forms a sandwich structure. Using a vacuum bag and evacuating the air from this bag, helps to fix the MUT on the metal core (sample holder) and to remove the air between the different layers (see photo in Fig. 10). To check the homogeneity of the absorbed microwave power in the load, the surface temperature of the sample is recorded by using a thermal (infrared) camera. In a first step, the sample is exposed to microwaves by using the applicator. In the following step, it is removed from the applicator and a picture of the temperature profile is recorded. For the experimental verification, a magnetron with an output power of 800 W and an infrared camera FLIR type AX5 is used. Sample photos of the manufactured microwave cavity are shown in Fig. 10.
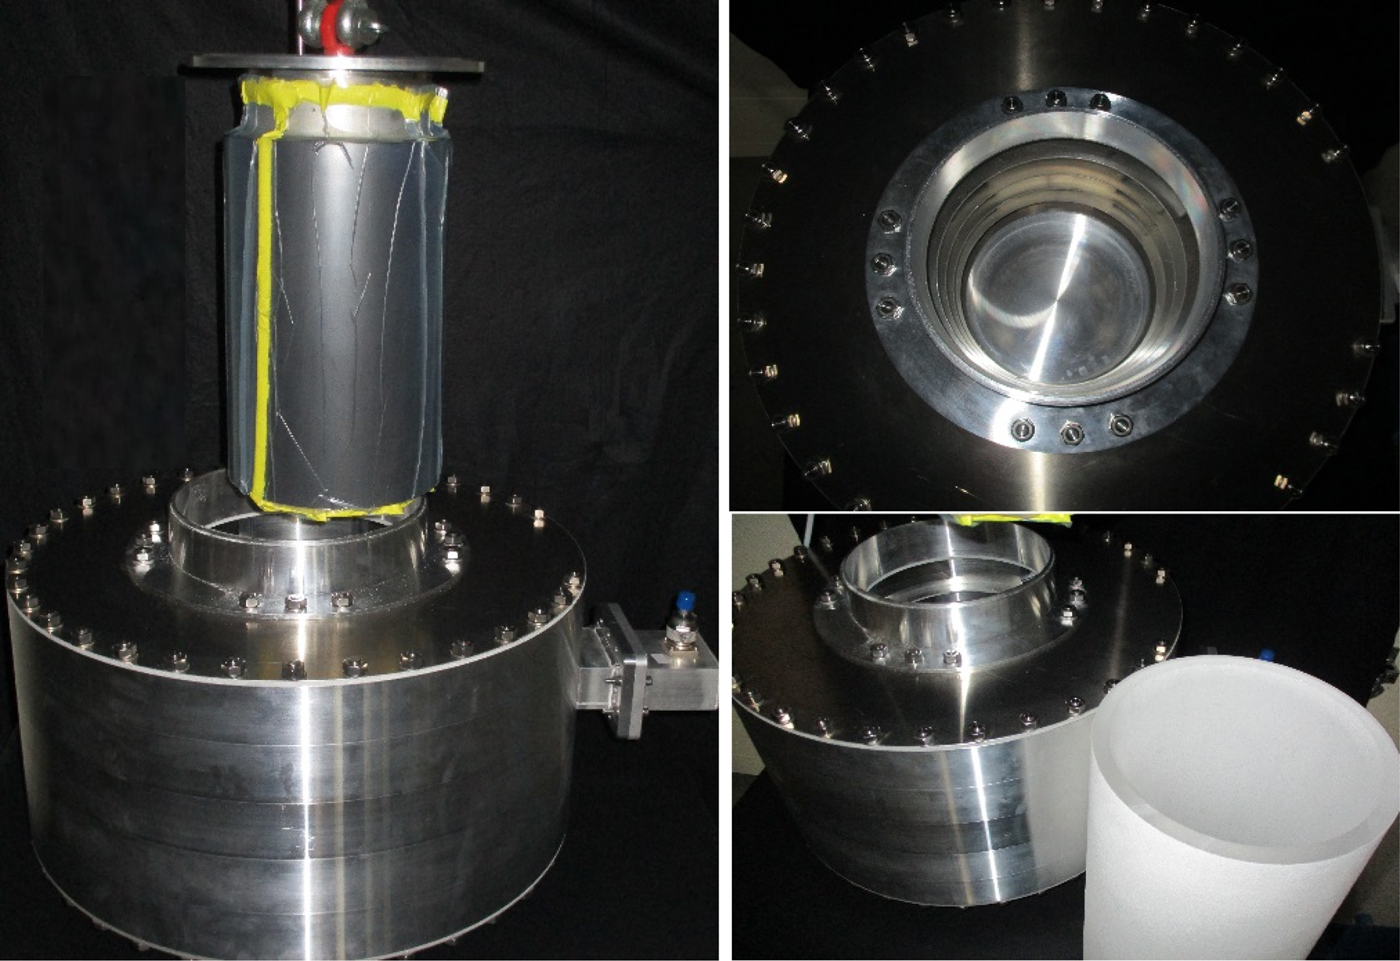
Fig. 10. Experimental setup.
Figure 11 (right picture) shows the measured temperature distribution. For comparison, the absorbed power distribution within the sample is simulated with CST Microwave Studio. It is shown in the left picture of Fig. 11. The measured temperature inhomogeneity is found to be ±8°C at a mean temperature level of 90°C. A proper agreement between simulation and experiment exists. It shall be noted, that in the experiment the sample does not completely fill the glass tube inside the applicator. It enables a fast subsequent temperature measurement but it prevents a better matching of the simulated temperature profile with the measured one.
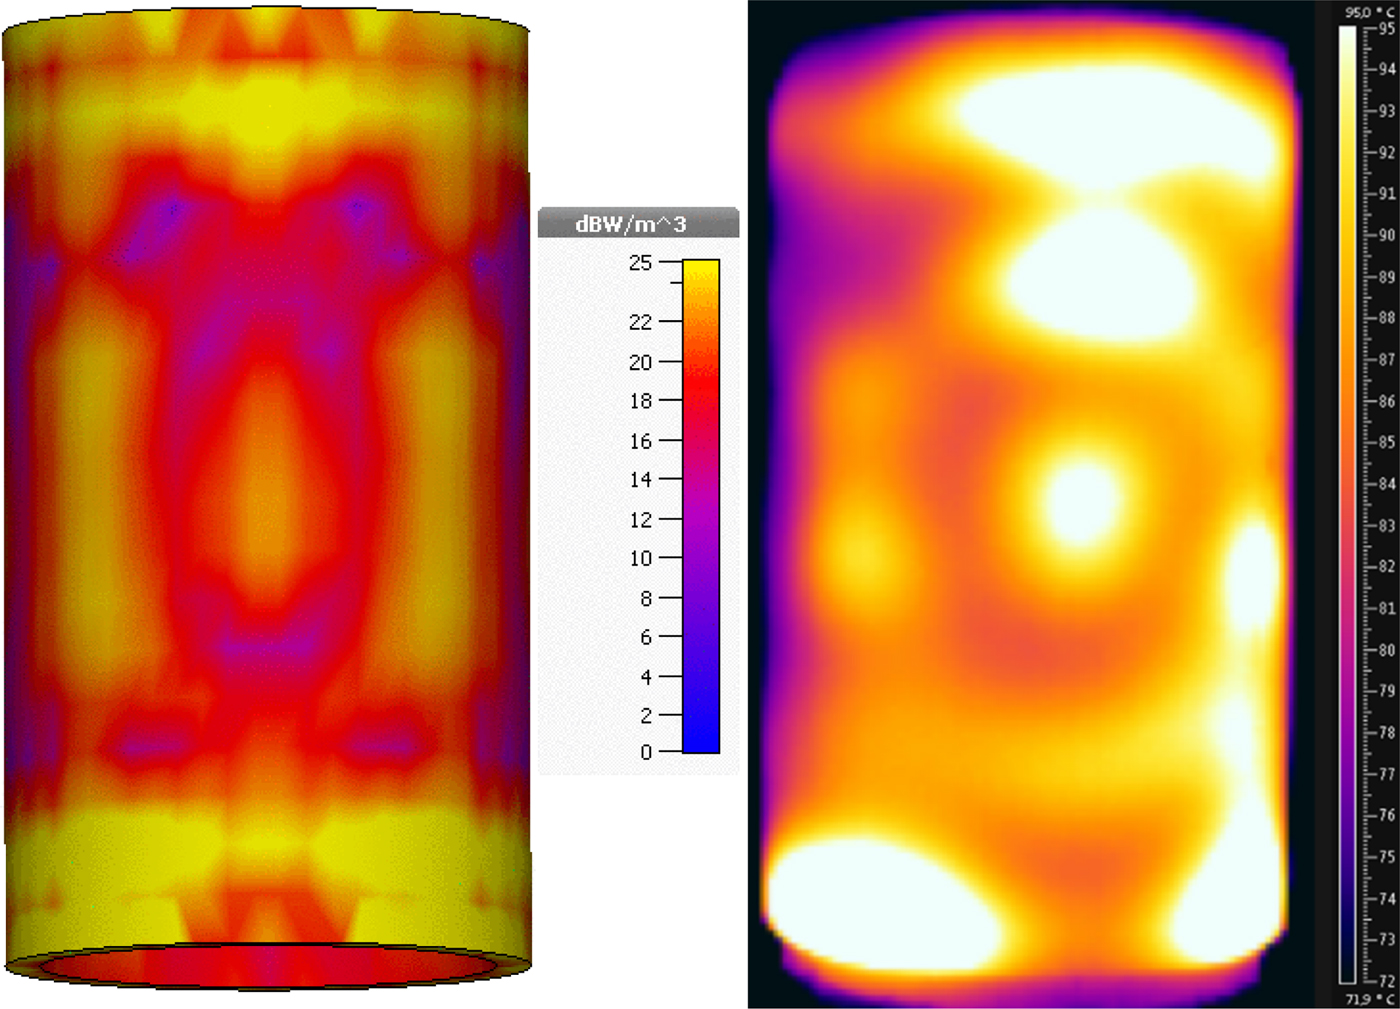
Fig. 11. Simulated power distribution (left), measured temperature distribution (right).
Conclusion
A highly modular industrial-scale microwave applicator operating at a frequency of 2.45 GHz has been designed for chemical recycling of PET. The efficiency of microwave coupling into the resonator loaded with the reaction mixture is more than 95% and the maximum temperature deviation is estimated below 4°C for a sample volume of 171. The cavity design is based on an optimized power distribution network.
The continuous operation of the applicator is realized with an Archimedean screw, which transports the suspension through the microwave pattern. The screw geometry had been investigated and optimized independently from the final applicator design. It is shown that the screw geometry becomes important in particular for materials with tanδ < 0.3.
Owing to its modular design the applicator may be easily adapted to meet requirements of different reaction conditions and different reactants.
The first experiment shows a very promising homogeneity of the absorbed RF power (±8°C). The temperature distribution matches well to the expectations from the simulation for the used MUT geometry.
Acknowledgement
This project has received funding from the European Union's Horizon 2020-SPIRE-2015 research and innovation program under grant agreement No 680426, SYMBIOPTIMA. This paper reflects only the author's view. The Commission is not responsible for any use that may be made of the information it contains.
 Vasileos Ramopoulos received the M.Sc. degree in electrical engineering from Karlsruhe Institute of Technology (KIT), Karlsruhe, Germany, in 2014. At KIT, he is involved in the research and development of in-situ dielectric measurements systems and microwave applicators for industrial microwave processing.
 Guido Link received the Dipl.-Phys. and Dr. rer. nat. degree in physics from the Technical University Karlsruhe, Germany in 1990 and 1993, respectively. His diploma thesis and graduate research were devoted to the frequency and temperature dependent characterization of low loss dielectric ceramics and ionic single crystals. Since 1993 he has been working at the Karlsruhe Institute of Technology, Germany (former Forschungszentrum Karlsruhe) in the field of high power microwave and millimeter-wave processing of materials as a team leader at the Institute for Pulsed Power and Microwave Technology.
 Sergey Soldatov received the Dipl.-Ing. degree in experimental nuclear physics and plasma physics from Moscow Engineering Physics Institute (State University) in 1994 and the Ph.D. degree from Russian Research Center “Kurchatov Institute”, Nuclear Fusion Institute, Moscow, in 2005. From 1994 to 2005 he investigated plasma instabilities with means of multi-antenna correlation reflectometry at fusion plasma machine TOKAMAK-10 and later (2005–2011) at TEXTOR (Forschungszentrum Jülich, Germany). Since 2011, Sergey Soldatov is a leading researcher in the Institute for Pulsed Power and Microwave Technology (IHM) at Karlsruhe Institute of Technology (KIT), Germany. He specializes in design and development of microwave applicators for thermal material treatment as well as microwave sustained plasma systems. His research interest covers also plasma diagnostics, antenna systems, and multi-physics simulations.
 John Jelonnek received the Dipl.-Ing. and the Dr.-Ing. degrees in electrical engineering from Hamburg University of Technology (TUHH), Germany, in 1991 and 2000, respectively. At TUHH he developed rigorous self-consistent analyses for gyrotron oscillators, in the frequency and in the time domain (slow- and fast-time scales), with a particular focus on the rigorous time-domain simulation of gyrotron operation at mismatched conditions and injection locking. From 1997 to 2011, John Jelonnek was working in several different leading positions at the industry. Since 2011, John Jelonnek is the Director of the Institute for Pulsed Power and Microwave Technology (IHM) at Karlsruhe Institute of Technology (KIT), Germany. Both, research and development of high power microwave sources, with a particular focus on fusion gyrotrons, and application of microwaves to energy efficient industrial processes using dielectric heating and microwave plasma are in the focus. Research and development in pulsed power technologies range from the development of high power sources to applications in the fields of materials processing and bioelectrics. John Jelonnek is a Professor of high-power microwave technologies at KIT.


 Open access