


Introduction
The pituitary gland, under the rigorous coordination of the hypothalamus, plays a key role in the development and adequate functioning of cells in all organs. The pituitary, with its two distinct parts, anterior pituitary (endocrine) and posterior pituitary (neural tissue), is connected to the hypothalamus via the hypothalamus–pituitary axis, consisting of nerve tracks and a portal system (Popa & Fielding, Reference Popa and Fielding1930; for a review, see Rohrbasser et al., Reference Rohrbasser, Alsaffar, Blair, LeRoith and Belfiore2016).
The anterior pituitary (AP)—also known as the adenohypophysis—comprises five types of secretory cells, as well as several types of supporting cells (Farquhar et al., Reference Farquhar, Skutelsky, Hopkins, Tixier-Vidal and Farquhar1975; Ben-Sholmo & Melmed, Reference Ben-Shlomo, Melmed and Melmed2017), all supplied with blood by a network of sinusoid capillaries (Farquhar, Reference Farquhar1961). The endocrine function of the AP is achieved by the synthesis and secretion of growth hormone [GH, produced by somatotroph cells (STCs)]; adrenocorticotropic hormone (ACTH), melanocortin hormones (MSH), lipotropic hormones (LPH), and endorphins [all produced by corticotroph cells (CTCs)]; luteinizing hormone (LH) and follicle-stimulating hormone (FSH) (produced by gonadotroph cells); thyroid-stimulating hormone (TSH, produced by thyrotrophs), and prolactin (PRL, produced by lactotrophs) [reviewed by Melmed & Jameson (Reference Melmed, Jameson, Kasper, Fauci, Hauser, Longo, Jameson and Loscalzo2015)]. However, there is evidence that the same cell can produce and store different hormones in separate granules (Fumagalli & Zanini, Reference Fumagalli and Zanini1985; Childs, Reference Childs1991).
Biochemically, AP hormones are either peptides (MSH, LPH, and endorphins) and polypeptides (GH, PRL, and ACTH), or glycoproteins (LH, FSH, and TSH). They are all synthesized by the polysomes attached to the rough endoplasmic reticulum according to the mechanism described by Palade (Reference Palade1955, Reference Palade1975). As secretion molecules, the AP hormones are processed and packed in the Golgi apparatus, forming secretory granules, to be sent to the plasma membrane (Farquhar & Wellings, Reference Farquhar and Wellings1957; Caro & Palade, Reference Caro and Palade1964; Jamieson & Palade, Reference Jamieson and Palade1966, Reference Jamieson and Palade1967a, Reference Jamieson and Palade1967b).
Even though cell secretion has been intensely studied for more than 60 years by many prominent scientists, among whom Palade, with his famous “pulse-chase technique”, occupied a leading position, this topic still represents a hot research area. In order to recognize their outstanding work of critical importance in understanding the molecular mechanisms of cell secretion, the 2013 Nobel Prize in Physiology or Medicine was awarded to James E. Rothman, Randy W. Schekman, and Thomas C. Südhof “for their discoveries of machinery regulating vesicle traffic, a major transport system in our cells” (Press release, 2019).
In order to analyze the mechanisms of cell secretion, the pancreas was preferred by the researchers working in this field for two reasons. First, it is a large gland in rodents, and second, contains a large number of secretory vesicles in both the exocrine and endocrine cells. Comparatively, a lesser number of researchers were interested in the mechanisms of cell secretion in the AP, due to its much reduced size, and to its more heterogeneous structure (many different types of cells) and functions (many different hormones).
Apart from revealing the AP ultrastructure and the specific functions of its secretory cells (as mentioned above), some particular aspects were reported concerning the secretion of AP hormones in abnormal conditions. Thus, Ishikawa et al. (Reference Ishikawa, Nogami, Kamio and Suzuki1983) found two hormones (GH and PRL) packed in the same secretory granules in pituitary adenoma cells. On the other hand, experimentally induced hypersecretion of AP cells, with enlargement of the secretory granules was reported in rats following castration (Farquhar & Rinehart, Reference Farquhar and Rinehart1954a; Inoue & Kurosumi, Reference Inoue and Kurosumi1981), and thyroidectomy (Farquhar & Rinehart, Reference Farquhar and Rinehart1954b). Farquhar (Reference Farquhar1978) also reported variations in the membrane traffic in the AP cells in vitro after stimulation with anionic and cationic ferritin.
We have a long-standing interest and experience in elucidating the effects (particularly structural and ultrastructural) of bee venom (BV) on the organs of the mammalian body. Since BV contains several molecules able to modify the neuronal activity (Habermann, Reference Habermann1972; Reference Habermann1984; Deschaux et al., Reference Deschaux, Bizot and Goyffon1997; Banks & Shipolini, Reference Banks, Shipolini and Piek1986; Steketee & Kalivas, Reference Steketee and Kalivas1990; Oh et al., Reference Oh, Power, Thompson and Disterhoft2000; Lovejoy et al., Reference Lovejoy, Shepard and Canavier2001), it could also be an excellent working tool for studying cell secretion in the AP. In two of our papers on this topic, we have reported important electrophysiological and ultrastructural changes in the brain of rats exposed to BV under different experimental conditions (Florea et al., Reference Florea, Puică, Vinţan, Benga and Crăciun2011), as well as observations on intensified metabolic activity and increased neurosecretory activity in hypothalamic nuclei after acute administration of BV (Florea et al., Reference Florea, Puică and Crăciun2009).
Starting from our previous findings, the objective of the present study was to assess whether the BV subchronic subcutaneous administration interferes with the secretory activity in the rat AP. In order to achieve this goal, we studied the ultrastructural changes induced by the BV and characterized the secretory granules in two types of cells from the AP: STCs and CTCs, after BV subchronic and acute experimental treatments. We selected only the STCs and CTCs since these cells are present in higher numbers in the rat AP, and are characterized by specific ultrastructural aspects, as well as by specific aspects and distribution of their secretory granules (Kurosumi & Kobayashi, Reference Kurosumi and Kobayashi1966; Kurosumi, Reference Kurosumi1968; Yoshimura & Nogami, Reference Yoshimura and Nogami1981; Kurosumi et al., Reference Kurosumi, Inoue and Taniguchi1983; Inoue & Hagino, Reference Inoue and Hagino1984). All these features make these cells easier to be identified and also more suitable for a proper statistical analysis. For elucidating the effects of BV treatments, the first parameter evaluated was the average diameter of the secretory granules. Another, more important parameter taken into account was the amount of cargo of each secretory granule. This parameter was determined by the optical density of secretory granules, and for this, the average gray intensity profile of granules was analyzed. The blood levels of GH and ACTH were also measured to better connect the effects of BV exposure on hormone secretion and different ultrastructural features of secretory granules.
Materials and Methods
Bee Venom and Venom Solution
BV was previously collected by A.F. from a local race of European honeybees (Apis mellifera carpatica) as previously described (Florea et al., Reference Florea, Puică, Vinţan, Benga and Crăciun2011), and stored at 0–4°C and away from light until use. In order to obtain injectable solutions, the crystallized BV was reconstituted into an isotonic saline buffer that consisted of 150 mM NaCl (Chimopar Trading SRL, Bucharest, Romania), 5.5 mM glucose (Fluka GmbH, Buchs, Switzerland), and 5 mM HEPES [4-(2-hydroxyethyl)-1-piperazine-ethanesulfonic acid] (Calbiochem, Behring Diagnostics, La Jolla, CA, USA), at pH = 7.4.
Animals
In this study, 18 male Wistar rats (Ratus norvegicus) were reared in the animal house of “Iuliu Haţieganu” University of Medicine and Pharmacy. The rats, weighing 135.71 ± 5.55 g, were separated into three groups (n = 6 for each group) and housed in cages of 40/25/20 cm, with no restrictions to food (standard pellets for rodents, Cantacuzino Institute, Bucharest, Romania), water, and movement. The study design was performed taking into account internal (institutional) and internationally specific ethical rules. The number of animals used was restricted for ethical reasons, and animal suffering was reduced to a minimum. This study was conducted under a protocol approved by the Ethic Commission of “Iuliu Haţieganu” University of Medicine and Pharmacy, Cluj-Napoca and by the National University Research Council (Grant A62/2004), in agreement with the European Communities Council Directive 86/609/EEC.
Experimental Treatments and Tissue Sampling
The animals in the first group, used as control, were daily injected for 30 days with 100 µL of buffer used to reconstitute the BV (C group). Rats in the second group were injected for 30 days with a daily dose of 700 µg BV/kg b.w. in 100 µL of buffer (equivalent to one bee sting)—subchronic treatment (30 group). Rats in the third group were injected with a single very large dose of BV 62 mg/kg b.w. in 100 µL of buffer (equivalent to 100 bee stings)—lethal treatment (L group). Rats in C and 30 group were weighed every third day following BV injections, and rats in L group were weighed in the day of treatment. The BV solutions were subcutaneously injected dorso-lateral in the lumbar region. Two hours after the injection of the BV high dose (when one of the animals became lethargic) and 4 h after the last daily treatment, the rats were generally anesthetized in an atmosphere of chloroform (Reactivul, Bucharest, Romania) and euthanized by decapitation.
Transmission Electron Microscopy (TEM)
The pituitary glands were collected within 1 min of decapitation of the rats and immediately processed for TEM (Hayat, Reference Hayat2000; Hagler, Reference Hagler and Kuo2007). The samples were prefixed for 1.5 h with 2.7% glutharaldehyde (Electron Microscopy Sciences, Hatfield, PA, USA) in 0.1 M phosphate buffer, pH 7.4, washed four times in the same buffer, and postfixed for 1.5 h with 1.5% OsO4 (99.9%, Fluka GmbH, Buchs, Switzerland) in 0.15 M phosphate buffer, all at 4°C. They were then dehydrated with acetone (Nordic Invest S.R.L., Romania) and embedded in Epon 812 (Fluka GmbH, Buchs, Switzerland), with polymerization at 60°C, for 72 h. Ultra-thin sections of 60–80 nm, cut with glass knives, on an LKB Bromma 8800 ULTRATOME III ultramicrotome (LKB, Stockholm, Sweden) were collected on Ø3.05 mm and 300 mesh Cu grids (Agar Scientific Ltd., Stansted, UK). We previously covered the grids with a parlodion (Merck, Darmstadt, Germany) film of about 10 nm thickness and a very thin layer of carbon atoms evaporated in an Agar Auto Sputter Coater 108 (Agar Scientific Ltd., Stansted, UK). Finally, the sections were contrasted with a saturated (13%) solution of uranyl acetate (Merck, Darmstadt, Germany) for 15 min, and a 2.8% solution of lead citrate (Fluka GmbH, Buchs, Switzerland) for 7 min. Examination of the sections was performed on a JEOL JEM 1010 Transmission Electron Microscope (JEOL Ltd., Tokyo, Japan) operating at 80 kV, equipped with an Olympus Mega VIEW III system (Olympus, Soft Imaging System, Germany). The following groups of cells were established. For STCs: STCs-C (control), STCs-30 (from the rats treated with BV for 30 days), and STCs-L (from the rats treated with the single, lethal BV dose). For CTCs: CTCs-C (control), CTCs-30 (from the rats treated with BV for 30 days), and CTCs-L (from the rats treated with the single, lethal BV dose).
Morphometric Analyses
The electron micrographs, captured at the same magnification and stored into a database with Soft Imaging System software (Soft Imaging System GMBH, Münster, Germany), were converted to TIFF images, in the gray scale mode, 8 bits/channel, with square pixel aspect ratio, and grouped with Adobe Photoshop 7.0 (Adobe Systems Inc., San Jose, CA, USA). Morphometric analyses were performed on the TEM images of STCs and CTCs, from the three groups of rats, using CellD Olympus software (Olympus Soft Imaging Solutions GMBH, Münster, Germany). A large number of secretory granules were manually sized in STCs (n = 1501 in STCs-C group, 558 in STCs-30 group, and 1262 in STCs-L group) and in CTCs (n = 817 in CTCs-C group, 957 in CTCs-30 group, and 1200 in CTCs-L group). The value of the secretory granules' diameter was expressed in nm.
The secretory granules were then manually analyzed for the gray intensity profile in both the types of cells: somatotroph (350 in STCs-C group, 450 in STCs-30 group, and 360 in STCs-L group) and corticotroph (400 secretory granules in each experimental group) cells (as can be seen in Fig. 1). For each secretory granule, the software was used to measure and calculate the gray profile in a number of points (separated by 10 nm) ranging between 6 and 24 (according to the diameter of the granule). This is why the final number of values for this analysis varied between 5342 and 6429 in the six groups of cells. According to the software, the gray intensity ranged between 0 (absolute black) and 255 (absolute white) and was expressed in units of gray value.
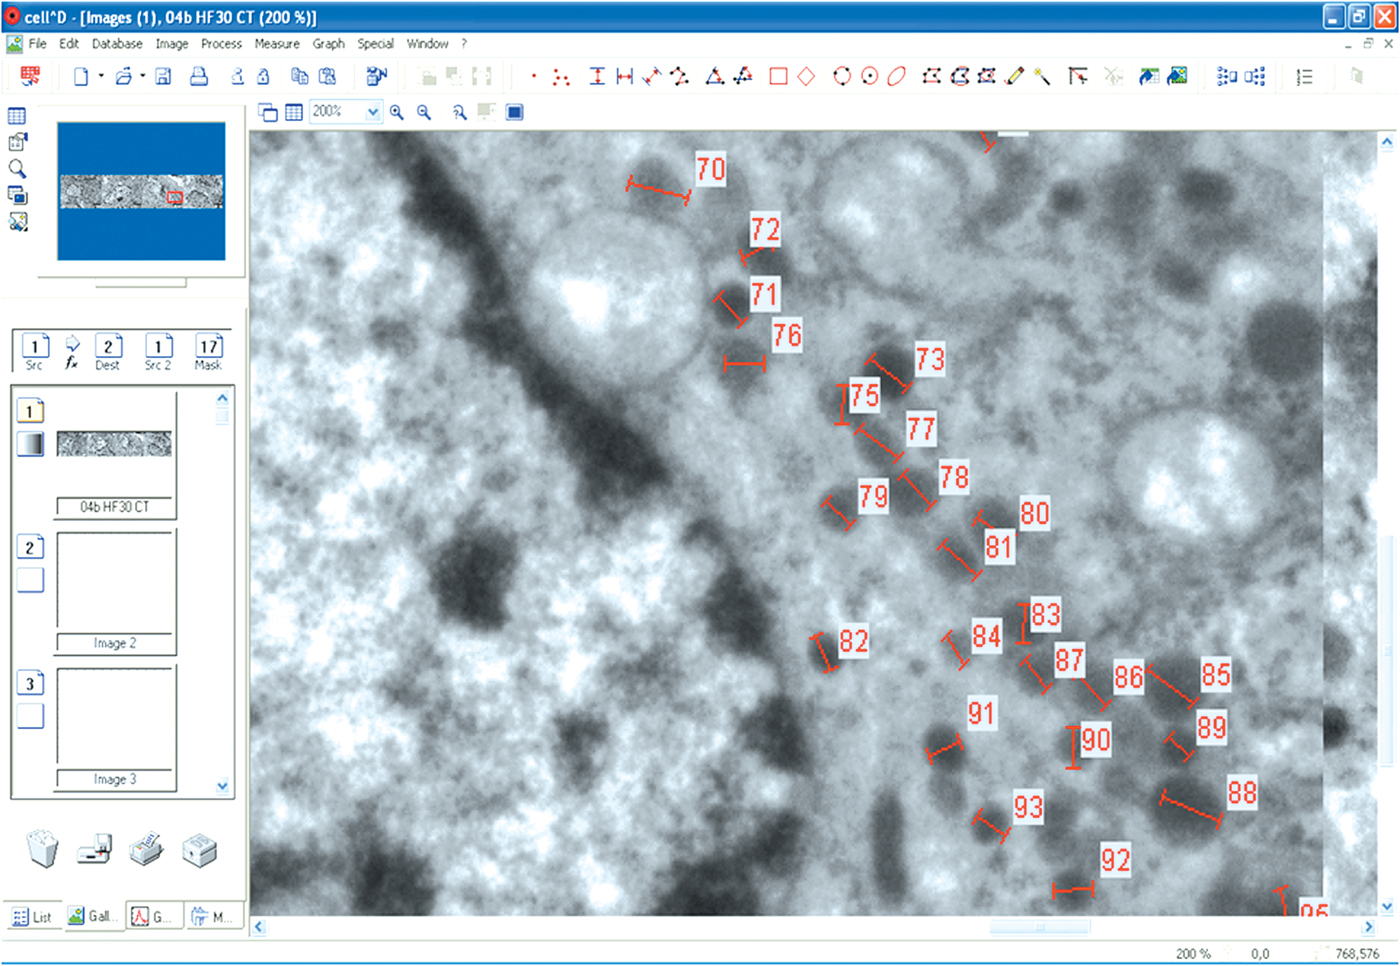
Fig. 1. A view of the CellD software operation. Secretory granules in the CTCs-30 group were analyzed for the intensity profile.
Biochemical Assessment of GH and ACTH
Blood was collected from the generally anesthetized rats by cardiac puncture as follows: in tubes with clot activator for GH and tubes with K2EDTA as an anticoagulant for ACTH. Serum GH assessment was performed with an Elabscience rat GH ELISA (enzyme-linked immunosorbent assay) kit (Catalog No: E-EL-R0029, Elabscience Biotechnology Inc., Houston, TX, USA) and a plate reader Stat Fax 3200 (Awareness Technology, Palm City, FL, USA). Plasma ACTH was quantified by the electrochemiluminescence immunoassay assay (ECLIA) in a Cobas 601 analyzer (Roche Diagnostics International AG, Rotkreuz ZG, Switzerland), in Synevo Laboratories (Cluj-Napoca, Romania).
Statistical Analysis
Results provided by the CellD Olympus software, as well as the biochemical results and the evolution of the body weight, were grouped into tables with Microsoft Excel (Microsoft Office, Microsoft Corporation, Redmond, WA, USA) and statistically analyzed with the GraphPad Prism program (GraphPad Software Inc., La Jolla, CA, USA). The morphometric results were expressed as mean ± standard deviation; medians, standard errors, and other parameters were also calculated in order to establish the normal distribution of values (see the Discussion section). The values for each parameter in the three groups of rats were analyzed using one-way analysis of variance (ANOVA), and the results were compared with Tukey's test. The differences between the mean values were considered statistically significant at p < 0.05.
Results
Analysis of the body weight during the 30-days experimental treatment revealed a constant decrease of the mean values measured in the 30 group as compared to the C group. However, the final difference of 10 g represented a decrease of only 5% and which was not statistically significant (not shown).
Electron microscopic examination of the AP in the three groups of rats revealed the high complexity of the gland architecture. Pars distalis of the AP consisted of cords of epithelial cells surrounded by sinusoid capillaries. Among the several categories of cells forming the AP, our study was focused on only two: STCs and CTCs. The STCs were easily identified: they were present at a high ratio in the lateral regions of the AP (around 50% of all cells; Becker, Reference Becker2001) and organized in large groups. The CTCs were present at a lower ratio in the rats AP (15–20% of all cells; Becker, Reference Becker2001). They were located especially in the central regions of the lateral lobes—forming clusters of 3–5—or were scattered among the other cells of the AP. STCs and CTCs had a particular ultrastructural aspect and contained secretory granules with specific aspect and location within their cytoplasm.
Ultrastructure of Secretory Granules in STCs
STCs-C Group
Secretory granules in STCs (Figs. 2a, 2b) appeared as dark, spherical vesicles, uniformly distributed and occupying almost the entire cytoplasm. They surrounded ovoidal, predominantly euchromatic nuclei, with an irregular contour in most of the cases, and prominent nucleoli. In some of the studied STCs, the secretory vesicles were also observed grouped toward one pole, conferring this way a certain degree of asymmetry to those cells (as can be seen in Fig. 2b). Regardless of their location, the granules displayed a characteristic feature: their relative heterogeneous size. In the cytoplasm, many cisternae of the endoplasmic reticulum were located around the nucleus in all studied cells and seen as round electron-lucent structures (Figs. 2a, 2b). Prominent Golgi apparatus could be observed at high magnifications in some cells (Fig. 2b), in general next to the nucleus, as overlapped sacks. Mitochondria, also present in high number, were either spherical or ovoid and with thin cristae (Fig. 2b), sometimes arranged in groups. The secretory granules' mean diameter (275.35 ± 69.89 nm) is represented in Figure 3a. The secretory granules in STCs were also very electron dense. Figure 4a shows the gray intensity values recorded at several points, in a single secretory granule. The results given by the software indicated the presence of a thin peripheral region with a reduced density, while the rest of the granule was completely black. However, almost perfect results were not obtained for all measured secretory granules. Their average gray intensity profile (29.37 ± 16.23 units) is represented in Figure 3b. The blood levels of GH varied among the rats of the control group ranging between 0.97 and 7.62 ng/mL, with a mean value of 3.98 ± 2.65 ng/mL (Fig. 5a).

Fig. 2. Comparative ultrastructure of STCs in the three experimental groups. (a) A general view of a STC in the control group, with uniform distribution of secretory granules with normal size and density. (b) A general and detailed view of a STC in the control group containing secretory granules with polarized distribution and with normal size and density. (c,d) General and detailed views of smaller secretory granules with a reduced density in STCs in the group or rats injected for 30 days with low BV daily doses. (e,f) General and detailed views of secretory granules in STCs in the group of rats injected with a single high BV dose. er, endoplasmic reticulum; G, Golgi apparatus; m, mitochondrion; n, nucleus; nu, nucleolus; rbc, red blood cell; STC, somatotroph cell; TTC, thyrotroph cell.

Fig. 3. Graphical comparison of data calculated for the two types of cells in the three experimental groups. (a) Average diameters of secretory granules of STCs. (b) Average gray intensity of secretory granules of STCs. (c) Average diameters of secretory granules of CTCs. (d) Average gray intensity of secretory granules of CTCs. Bar graphs represent mean values ± standard deviations. ***Highly significant statistical differences (p < 0.0001); *significant statistical differences (p < 0.05); STCs-C, somatotroph cells from the control group; STCs-30, somatotroph cells from a group or rats injected for 30 days with low BV daily doses. STC-L, somatotroph cells from a group of rats injected with a single lethal BV dose. CTCs-C, corticotroph cells from the control group; CTCs-30, corticotroph cells from a group or rats injected for 30 days with low BV daily doses. CTC-L, corticotroph cells from a group of rats injected with a single lethal BV dose.

Fig. 4. Graphical representation of gray intensity values measured in several points of a single secretory granule. (a) Results for a granule in the STCs-C group. (b) Results for a granule in the STCs-30 group. (c) Results for a granule in the STCs-L group. (d) Results for a granule in the CTCs-C group. (e) Results for a granule in the CTCs-30 group. (f) Results for a granule in the CTCs-L group.

Fig. 5. Comparative representation of results obtained for the measurement of serum levels of GH (a) and plasma levels of ACTH (b) in the three experimental groups. Bar graphs represent mean values ± standard deviations.
STCs-30 Group
The secretory granules were still numerous in STCs of rats treated for 30 days with BV (Figs. 2c, 2d), but their number was lower than in the STCs-C group. They were also much smaller—by 48.15% as compared to the STCs-C group (p < 0.0001); the mean diameter of the STCs secretory granules in this group is represented in Figure 3a. The secretory granules were difficult to immediately identify on the cytoplasm background, due to their reduced density—most of them appeared as gray granules instead of black. They also displayed more uniform sizes. On the other hand, vacuolation of the endoplasmic reticulum in many areas and the swollen mitochondria with a rarefied matrix (Fig. 2d) accentuated the difficulty to identify the secretory granules in these cells. When observed, the Golgi apparatus was prominent, with very dilated sacks (not shown). Figure 4b shows the gray intensity values recorded in several points in a single secretory granule in the STCs-30 group. The results given by the software indicated again a peripheral region with a more reduced density, while the rest of the granule was completely gray. This pattern with a low density was also the most frequently observed during the analysis of granules in this group, resulting in a difference of 237.04% (reduced hormone content) as compared to the STCs-C group (p < 0.0001), but a few more dense granules were also found in all studied STCs. The mean gray intensity profile for the secretory granules in the STCs-30 group is presented in Figure 3b. As in the control group, the blood levels of GH in the group treated for 30 days with BV was wide ranging between 2.36 and 9.39 ng/mL, with a mean value of 5.19 ± 3.05 ng/mL (Fig. 5a). The difference recorded was 30.4% as compared to control, but due to the large standard deviations in both the groups, this important difference was statistically not significant (p > 0.05).
STCs-L Group
Secretory granules were present in this group in a comparable number as in the control, but many were smaller (Figs. 2e, 2f), resulting in their heterogeneity and a reduced mean diameter by 7.14% (statistically not significant—p > 0.05). The mean diameter of the STCs secretory granules in this group is presented in Figure 3a. The smaller granules were also grayer than the large ones (Figs. 2e, 2f). However, also large gray granules were found. This is why the mean value for the gray intensity profile in this group was increased by 200% as compared to the STCs-C group (p < 0.05) (Fig. 3b), indicating again a significantly reduced content of the granules. Figure 4c shows the gray intensity values recorded in several points in a single secretory granule in the STCs-L group. In the STCs of this group, BV triggered also extensive unspecific—lesional changes. Thus, the perinuclear space was increased, and the endoplasmic reticulum was extremely dilated in large areas (Figs. 2e, 2f). In some cells, such important vacuolations surrounded still intact elongated mitochondria (Fig. 2f). However, other mitochondria contained a rarefied matrix or were ballooned (Fig. 2f) and was difficult to identify among the vacuolated endoplasmic reticulum (Fig. 2f). The blood levels of GH in the L group ranged between 1.56 and 11.8 ng/mL, with a mean value of 5.21 ± 3.68 ng/mL (Fig. 5a). This value was higher than that calculated for the C group, but the difference (of 30.9%) was again statistically not significant (p > 0.05).
Ultrastructure of Secretory Granules in CTCs
CTCs-C Group
Only cells belonging to the first category of CTCs [among the existing four types—according to the classification of Yoshimura & Nogami (Reference Yoshimura and Nogami1981)] were taken into consideration in this study. In these cells, the secretory granules appeared as dark, spherical vesicles (Figs. 6a, 6b), and in lower number as compared with those in STCs. They also had a particular distribution within the cytoplasm: they were arranged into a uniform, continuous row around the elongated, euchromatic nuclei, in most of the cells being observed in the proximity of the plasma membrane (Figs. 6a, 6b). The low number of secretory granules, their specific distribution, and the particular shape of these cells represented the important criteria for identifying CTCs. The secretory granules were about the same size but visibly smaller than the STCs granules. Their mean diameter (180.83 ± 61.62 nm) is presented in Figure 3c. Most of the granules were electron dense, but gray granules were also noted (Fig. 6b). Figure 4d shows the gray intensity values recorded in several points in a single secretory granule (representative) of a CTC in this group. The results given by the software indicated, like for secretory granules from the STCs-C group, a thin peripheral region with a reduced density, while the rest of the granule was completely black. But again, such perfect results were not obtained for all measured secretory granules, and almost entirely gray granules were found in low number as well. The mean value of the gray intensity profile of secretory granules from the CTCs-C group (28.04 ± 26.11 units) is represented in Figure 3d. The CTCs cytoplasm also contained a few round or oval-shaped mitochondria, and a low amount of the endoplasmic reticulum (Fig. 6b). The blood levels of ACTH varied among the rats of the control group ranging between 331.2 and 1073 pg/mL, with a mean value of 650.78 ± 339.22 pg/mL (Fig. 5b).

Fig. 6. Comparative ultrastructure of CTCs in the three experimental groups. (a,b) General and detailed views of CTCs in the control group, with specific peripheral distribution of secretory granules with normal size and density. (c,d) General and detailed views of larger secretory granules with a reduced density in CTCs in the group or rats injected for 30 days with low BV daily doses. (e,f) General and detailed views of secretory granules in CTCs in the group of rats injected with a single high BV dose. CTC, corticotroph cell; er, endoplasmic reticulum; G, Golgi apparatus; m, mitochondrion; n, nucleus; nu, nucleolus; pm, plasma membrane; rbc, red blood cell.
CTCs-30 Group
The CTCs in this group contained a reduced number of secretory granules (Figs. 6c, 6d). Many of these granules were also smaller as compared with the granules in the control cells, but the mean diameter of the secretory vesicles in the CTCs in this group was higher (Fig. 3c). The calculated difference was—in this case 5.09%—small but statistically significant. Concerning the intensity profile, most of the secretory granules were of low density, displaying a light-gray color (Fig. 6d). Figure 4e shows the gray intensity profile of a single, representative secretory granule of a CTC in this group. The mean value of the gray intensity profile for the secretory granules of the CTCs-30 group is represented in Figure 3d. The calculated difference between this group and the C group (212.38%) was statistically significant (p < 0.0001). The other cellular structures suffered various degrees of alteration. Nuclei of many cells displayed enlarged perinuclear space, profiles of the endoplasmic reticulum were dilated, and some mitochondria ballooned, with a rarefied matrix (Fig. 6d). Some of the large electron-lucent vacuoles surrounding the nuclei could be mitochondria in advanced stages of degeneration. The Golgi apparatus also consisted of dilated sacks (not shown). The blood levels of ACTH ranged in this group between 435.6 and 1509 pg/mL. Even though this value was higher (Fig. 5b), at 42.73% than in controls, the difference was not statistically significant.
CTCs-L Group
The secretory granules in cells of this group preserved unchanged their specific cellular distribution and their relatively low number (Figs. 6e, 6f). Their measured diameter (Fig. 3c) was 4.67% lower than the mean diameter of granules in the CTCs-C group but statistically significant (p < 0.0001). It was also significantly lower than that of granules in the CTCs-30 group (p < 0.0001). Many secretory granules in the CTS-L group were gray, others being entirely black (Fig. 6d). Figure 4f shows the gray intensity profile of a single, representative secretory granule of a CTC in this group. The mean value of these secretory granules gray intensity profile is represented in Figure 3d. The calculated difference between this group and the C group (51.71%) was statistically significant (p < 0.05). Nuclei of CTCs had irregular contour, the perinuclear space and endoplasmic reticulum were enlarged, and almost all mitochondria were swollen, with an electron-lucent matrix (Fig. 6f). The blood levels of ACTH ranged in this group between 462.9 and 833.3, and the mean value (Fig. 5b) was 42.73% higher than in controls, not a statistically significant difference.
Discussion
In this study, we used transmission electron microscopy, microanalysis, hormone assessment, and statistical analysis to characterize the ultrastructural features of secretory granules in two types of secretory cells from the rat AP, with the rats subjected to subchronic and acute experimental treatments with reconstituted crystallized BV. TEM allowed us to identify the STCs and CTCs among different types of cells forming the pituitary gland. This technique is one of the very few that could provide data required for secretory granules characterization. CellD computer software was also appropriate for our approach, providing a very sensitive microanalysis method that made possible accurate measurements of both the granules diameters and of their gray intensity values. We have 10 years of experience in measuring various parameters of tissues or organs, organ structures, cells, cell organelles, or different types of nanoparticles. On the other hand, the analysis of the gray intensity profile has been previously performed by other authors for different purposes. However, to the best of our knowledge, here this method (and this particular software) is used for the first time to measure the gray intensity profile of cell structures (secretory granules). Therefore, we can say that it is not a new method, but a method with a new application to microstructural analysis in biology science. GH and ACTH dosing were required for explaining the ultrastructural changes of granules. Finally, ANOVA was an appropriate method for analysis of the different categories of results. The ANOVA is the most used statistical method to compare more than two groups of data with only one independent variable, with normally distributed values, and with homogeneity of variance. The compared data also represented continuous levels of measurements (Turner & Thayer, Reference Turner and Thayer2001; Statistics Solutions, 2013). We calculated a normal distribution of values in all our sets of data. Among the 23 sets of data, the mean values were identical or almost identical with medians (perfect normal distribution) in 16 groups: body weight of rats in control group at day 30, in the group treated for 30 days at day 0 and at day 30, and in the group treated with the high BV dose at day 1; diameters of granules in the six STCs groups and CTCs groups; gray intensity in the three groups of STCs and CTCs-30 group; and ACTH levels in CTC-30 and CTCs-L groups. For the others seven sets, we calculated slightly positively skewed distributions: body weight of rats in the control group at day 0; gray intensity in CTCs-C and CTCs-L groups; GH levels in the three groups; and ACTH levels in the CTC-C group. We further used the Tukey post-hoc comparison test (which compares all the groups, two by two) in order to compare the mean differences between the groups. This test, like other post-hoc tests, is (in fact) a variant of the t-test (Statistics Solutions, 2013).
Regardless of the normal distribution of values, we were intrigued by the important differences between the lowest and the highest values obtained for the gray intensity profile of granules and for the blood levels of GH and ACTH. This is why we also performed a statistical analysis based on the Kruskal–Wallis test (a non-parametric test) and Dunn's multiple comparison test, which are recommended for comparing groups of values with non-normal distributions. Not surprisingly, the obtained statistical results were very similar to those obtained by ANOVA. Since the later statistical analysis was performed only as a control, we will not present it in detail in this paper.
Hormone secretion from the various AP cells is under a highly regulated control of the neurons from hypothalamic nuclei through the hypothalamo-pituitary portal system, supervised in turn by the cortical neurons. Therefore, the normal activity of all other endocrine glands, under the direct coordination of the AP, is balanced according to the information taken from the environment. Thus, cell secretion in the AP can be influenced by external stress agents, in our particular case by the molecules forming the BV. The BV transported from the site of injection by the blood arrived at the AP (the most vascularized tissue in mammals) via the pituitary portal system and superior hypophyseal artery. At the level of the AP, the blood capillaries organize a secondary plexus that facilitates the release of hypothalamic hormones (Melmed & Jameson, Reference Melmed, Jameson, Kasper, Fauci, Hauser, Longo, Jameson and Loscalzo2015), and of the BV molecules as well, in the proximity of secretory cells.
The first parameter analyzed here by us was the diameter of the secretory granules. The statistical analysis showed significant statistical differences in both the types of secretory cells between the cells of treated rats and controls but as a result of different behavior.
The secretory granules had a much smaller mean diameter (almost half) in the STCs-30 group as compared to the STCs-C group. On the other hand, both the minimal and maximal values for the measured diameters were smaller in the treated group. The smaller granules were also more homogeneous in size (lower standard deviation). ANOVA showed highly significant differences between the mean diameters of granules in the STCs-30 group as compared to those in STC-C and STC-L, but no statistical difference was found between the sizes of granules in STC-L, when compared to controls. In CTCs, the secretory granules had, surprisingly, a slightly (yet significant) larger mean diameter in the CTCs-30 group as compared to the CTCs-C group, even though for most of the granules we recorded similar diameters (indicated by the close values of the 25 and 75% percentiles). This finding is consistent with literature data (Farquhar & Rinehart, Reference Farquhar and Rinehart1954a). For the smaller granules from the CTC-L group, we also calculated very close values of the 25 and 75% percentiles. However, the more homogenous sizes of granules in the CTCs groups contributed to the significant differences found. A possible explanation for this different behavior of the two types of secretory cells could be attributed only by their different rates of metabolic activity, including here the much higher number of secretory granules produced by STCs (cells also present in higher number in the AP) than those produced by CTCs. Thus, trying to ensure a sustained production and release of hormones in high amounts, the secretion machinery resulted in time in smaller vesicles, suggesting an important shift from basal to stimulated secretion of hormones.
The second parameter analyzed here by us was the cargo amount contained by the secretory granules. The higher the protein content of the granules, the higher their electron density. In rats from the C group, the secretion of hormones from the AP was a basal one, with the release in the blood of relatively small amounts of hormones. Accordingly, in both the STCs and CTCs of this group, the mature, large and dark granules prevailed, loaded with high amounts of hormones.
The AP in the normal rats contains two subpopulations of STCs with similar but not identical content of GH, with heterogeneity proven to be also functional (Dobado-Berrios et al., Reference Dobado-Berrios, Ruiz-Navarro, Lopez-Pedrera, Gonzalez de Aguilar, Torronteras, Hidalgo-Diaz and Gracia-Navarro1996). But, unlike in the STCs-C group, where the STCs were easily recognized, mainly due to the aspect and distribution of the secretory granules, in the STCs-30 group, all the AP cells reacted similarly to the BV treatment, containing smaller and less-dense granules, thus complicating differentiation of STCs especially from the gonadotrophs and thyreotrophs. However, our results demonstrated the reduced content in GH of all the secretory granules within the identified STCs to less than a half, after 30 days of daily BV injection. In the STCs-L group, we found a similar reaction of granules but of lower amplitude. These reduced values resulted from the average gray intensities that were more than double in the STCs-30 and STCs-L groups, a finding sustained by the 75% percentile values. The higher standard deviation in this group also showed a more heterogeneous distribution of the less dense granules as compared to the C group. ANOVA showed a highly significant statistical difference when comparing the two experimental groups with the control. Moreover, the gray values recorded for individual granules in the cells of STCs-30 and STCs-L groups indicated the presence of a wider gray ring surrounding the central denser core in the case of the remaining darker granules.
The rat AP also contains two types of CTCs (Kurosumi et al., Reference Kurosumi, Inoue and Taniguchi1983), into which we found the same reaction to BV. An almost identical distribution of data—as for STCs—was observed when analyzed the gray intensity profile in CTCs-30 and CTCs-L groups, and ANOVA showed again a highly significant statistical difference between the test and control groups. Interestingly, the reduced number and density of the secretory granules in these cells are features described soon after the CTCs were firstly characterized, and reported consecutive to experimental bilateral adrenalectomy (Kurosumi & Kobayashi, Reference Kurosumi and Kobayashi1966).
The different average size of the granules, as well as their lower hormone content in both the STCs and CTCs in the VST group, was obviously related to the presence of the BV molecules in the blood of the animals in this group. The BV daily doses received by the rats during the 30 days treatment was transported by the blood and affected the central nervous system (Habermann, Reference Habermann1972, Reference Habermann1984; Deschaux et al., Reference Deschaux, Bizot and Goyffon1997; Banks & Shipolini, Reference Banks, Shipolini and Piek1986; Steketee & Kalivas, Reference Steketee and Kalivas1990; Oh et al., Reference Oh, Power, Thompson and Disterhoft2000; Lovejoy et al., Reference Lovejoy, Shepard and Canavier2001, Florea et al., Reference Florea, Puică and Crăciun2009, Reference Florea, Puică, Vinţan, Benga and Crăciun2011). Among the BV neuromodulators, a significant fraction of the dry BV is represented by apamin. Apamin is recognized to be the only peptide able to cross the blood–brain barrier (Habermann, Reference Habermann1984) and to specifically interact with plasma membranes of neurons. It recognizes the small conductance K+ channels activated by the Ca2+-calmodulin complex and blocks them even at very low concentrations (Blatz & Magleby, Reference Blatz and Magleby1986; Köhler et al., Reference Köhler, Hirschberg, Bond, Kinzie, Marrion, Maylie and Adelman1996; Kazic & Gojovic-Bukarica, Reference Kazic and Gojovic-Bukarica1999). By inhibiting these channels, apamin dramatically changes the firing pattern of neurons (Steketee & Kalivas, Reference Steketee and Kalivas1990; Oh et al., Reference Oh, Power, Thompson and Disterhoft2000; Lovejoy et al., Reference Lovejoy, Shepard and Canavier2001) and also modifies the K+ concentration in the neuronal microenvironment. Chang & Lowenstein (Reference Chang and Lowenstein2003) showed that such changes in K+ concentrations resulted in a lower threshold for neuronal firing, also followed by an accelerated release of chemical mediators. This modification could affect in different ways many physiological processes, being responsible, among others, for improvements in learning tasks (Deschaux et al., Reference Deschaux, Bizot and Goyffon1997).
We previously found a reduced number of neurons in the rat frontal cortex, but with intensified metabolic activity, in the same experimental conditions as in the current study (Florea et al., Reference Florea, Puică, Vinţan, Benga and Crăciun2011). A lower frequency and increased amplitude of cortical electric activity were also recorded, suggesting neuronal loss (Florea et al., Reference Florea, Puică, Vinţan, Benga and Crăciun2011). In addition, we reported increased activity of cell secretion in hypothalamic nuclei consecutive with the BV experimental subchronic treatment (Florea et al., Reference Florea, Gherghel, Puică, Crăciun and Oprea2003b). Finally, we mentioned, in a preliminary set of data, a lower density of secretory granules in different types of cells from AP after the subchronic treatment with BV (but not after an acute one), as one of our most exciting results (Florea et al., Reference Florea, Oprea, Crăciun and Puică2005). Unfortunately, at that time, we did not have the possibility to perform accurate measurements neither of the secretory granules sizes nor of their gray intensity profiles.
The reduced amount of hormones in secretory cells of the AP indicated an accelerated process of cell secretion in the gland—stimulated secretion, sustained by the higher amounts of blood GH and ACTH recorded by us. This process could be explained only starting with the molecular mechanism involved in the release of secretion products. Thus, as compared with the C group, a greater number of secretory vesicles were continuously involved in the secretion. After a first docking to fusion pores (Cho et al., Reference Cho, Jeftinija, Glavaski, Jeftinija, Jena and Anderson2002), like in the case of the exocrine pancreas (Jeremic et al., Reference Jeremic, Kelly, Cho, Stromer and Jena2003; Crăciun, Reference Crăciun2004; Jena, Reference Jena2009), or other tissues (Jeremic et al., Reference Jeremic, Jena and Cho2005), followed by a first step of hormone release, the vesicles went back into the cytoplasm to accumulate water (Kelly et al., Reference Kelly, Cho, Jeremic, Abu-Hamdah and Jena2004; Jeremic et al., Reference Jeremic, Jena and Cho2005), in order to further fuse with the membrane until the release of most of their content (Jena, Reference Jena2009). As a consequence, in order to satisfy the requirements of the animal organism in the given experimental conditions, higher and higher amounts of hormones were released from the AP, but the secretion rate seemed to be not satisfactory, since newly produced vesicles (electron dense) were not able to last enough and to accumulate in a representative number in the cytoplasm. Therefore, in the context of our study, we can say that the daily doses of BV induced important changes in the central nervous system, stimulating the activity of the hypothalamus, and affecting, in turn, the ultrastructure and function of secretory cells from AP. Hypothalamic neuron excitation and the long-term stimulation of neurosecretion resulted in high levels of somatoliberin (GH-releasing hormone) and corticoliberin (ACTH-releasing hormone) in the blood. This way was maintained a long-term stimulation of STCs and CTCs that produced and released, in turn, higher amounts of GH and ACTH. These findings are consistent with data reported by Gracia-Navarro et al. (Reference Gracia-Navarro, Malagón, Castaño, García-Navarro, Sánchez-Hormigo, Luque, Peinado and Delgado2002) who described the dynamics of STCs as well as their ability to adapt to “the changing physiologic requirements”, resulting in different subpopulations of cells with a distinct morphology.
We also quantified the plasma levels of GH and ACTH, and our results are in agreement with those of Knepel & Gerhards (Reference Knepel and Gerhards1987), who measured higher levels of ACTH by the stimulation of rat AP with melittin (the main constituent of the BV). In our study, the wide range of values recorded in the different animals of each experimental group, and possibly the relatively low number of animals used, prevented us to obtain statistically significant results, in spite of the important differences calculated. However, this aspect is not unusual and we found similar results presented as representative data range by a manufacturer of the GH rat ELISA kit for groups of samples ranging between 1 and 11, and actual values between 1.69 and 93.3 ng/mL (ThermoFisher Scientific).
Moreover, other researchers reported significant increases of plasma corticosterone (Couch & Benton, Reference Couch and Benton1972; Zurier et al., Reference Zurier, Mitnick, Bloomgarden and Weissmann1973), or cortisol (Vick et al., Reference Vick, Mehlman and Shipman1971), consecutive to repeated subcutaneous injection of the pure BV, and as a consequence of AP stimulation. Zurier et al. (Reference Zurier, Mitnick, Bloomgarden and Weissmann1973) also discussed an ACTH-like effect of the BV, while Vick et al. (Reference Vick, Mehlman and Shipman1971) and Vick & Shipman (Reference Vick and Shipman1972) observed that BV adrenal stimulation was prevented in hypophysectomysed animals.
It is noteworthy that the cell organelles involved directly or indirectly in the process of cell secretion (endoplasmic reticulum, Golgi apparatus, and mitochondria) suffered ultrastructural changes of certain degrees. Therefore, the venom molecules were responsible, besides the specific stimulation of protein synthesis and secretion under the influence of neuromodulators, for an unspecific, lesional effect. The injuries were produced directly at the AP level by other molecules from the BV brought here by the blood flow, mainly by melittin and phospholipase A2, the most important components of the BV (50 and 14%, respectively, from the dry weight of the venom; Habermann, Reference Habermann1972). But we found extensive cellular damages that also occurred in other organs and tissues of the rats injected with BV or BV derivatives: kidney (Florea et al., Reference Florea, Puică, Crăciun, Gherghel and Oprea2002), hypothalamus (Florea et al., Reference Florea, Gherghel, Puică, Crăciun and Oprea2003b), liver (Florea et al., Reference Florea, Crăciun, Puică, Gherghel and Oprea2003a), frontal cortex (Florea et al., Reference Florea, Puică, Vinţan, Benga and Crăciun2011), aorta and skeletal muscle (Florea & Crăciun, Reference Florea and Crăciun2012), blood and bone marrow (Florea & Crăciun, Reference Florea and Crăciun2013), and testes (Florea et al., Reference Florea, Puică, Hamed, Tilinca and Matei2017; Tilinca & Florea, Reference Tilinca and Florea2018). A negative feedback process could be taken into consideration that in turn contributed to overstimulation of STCs to produce GH required for the regeneration processes in the whole organism. This could be a reasonable explanation for the small difference in the body weight of the animals treated for 30 days as compared to controls, despite the important increase of GH levels measured by us. On the other hand, the subchronic stress resulted in a higher and sustained secretion of corticosteroid hormones under the direct influence of ACTH secreted by the stimulated CTCs. It has been shown that an excess of corticoid hormones could be responsible for the growth delay in children in pathological conditions (Allen, Reference Allen2006). Moreover, the MSH produced by the stimulated CTCs could play an important role in the metabolic impairment, via reduced food intake, and energetic imbalance (Yaswen et al., Reference Yaswen, Diehl, Brennan and Hochgeschwender1999; Abbott et al., Reference Abbott, Rossi, Kim, Alahmed, Taylor and Ghatei2000; Butler, Reference Butler2006). A more important growth delay was also observed by us in the treatment group during the experimental subchronic administration of BV in rats, with highly statistically significant differences starting from day 25 (Florea et al., Reference Florea, Gherghel, Puică, Crăciun and Oprea2003b).
Conclusion
A relation between the experimental treatments with BV and the ultrastructure of the secretory granules was observed in this study. BV was able to reduce the hormone content of granules in both STCs and CTCs by stimulating cell secretion. The results obtained for the two types of cells correlated, indicating a similar reaction of these secretory cells to the prolonged and acute presence of BV in the rat organism. Further, more accurate, molecular studies are required to elucidate the mechanisms that contributed to this stimulation.
Acknowledgments
Thanks are due to Mr. Savian Cruceru who kindly let us collect the BV in his apiary. The work was funded by the National University Research Council of Romania (Grant A62/2004).


