


Introduction
Hybridization between apparently well-differentiated species is a commonly observed phenomenon and is widely studied in the context of speciation and reproductive isolation among species (Arnold, Reference Arnold1997; Pennisi, Reference Pennisi2016). Hybridization has a variety of evolutionary consequences, depending on the fitness of the hybrids, which may range from sterility and reduced fertility, to hybrid vigour or heterosis, whereby hybrid individuals perform better and out-compete parental species (Burke & Arnold, Reference Burke and Arnold2001; Pennisi, Reference Pennisi2016). As a consequence, if species are rare and locally confined (Rhymer & Simberloff, Reference Rhymer and Simberloff1996), genetic mixing can lead to the extinction of one or both parental species (Todesco et al., Reference Todesco, Pascual, Owens, Ostevik, Moyers and Hübner2016). Eventually, hybridization can lead to speciation, with two parental species giving rise to a new species (Dowling & Secor, Reference Dowling and Secor1997; Soltis & Soltis, Reference Soltis and Soltis2009), highlighting the relevance of studying hybridization from the perspective of conservation biology. Allendorf et al. (Reference Allendorf, Leary, Spruell and Wenburg2001) noted that taxa that have arisen through natural hybridization warrant protection. However, they also noted that increased anthropogenically related hybridization is causing extinction of many taxa (species, subspecies and locally adapted populations) by both replacement and genetic mixing, and they argued that hybrid taxa resulting from anthropogenic causes should therefore be protected only in exceptional circumstances. We do not yet know if hybrids of the brolga Antigone rubicunda and the Australian sarus crane Antigone antigone gillae have arisen as a result of anthropogenic habitat change, nor if agricultural and conservation policy has the potential to curtail this, but it is a matter for careful consideration. The starting point for this is gaining an appreciation of the scale of hybridization. Depending on the interaction of parental alleles, and their dominance patterns as well as epistatic effects, hybrid individuals need not be phenotypically intermediate between their parents (Rieseberg et al., Reference Rieseberg, Archer and Wayne1999). Also, introgression of alleles from one species into the other need not be symmetrical, as demonstrated in many cases of mitochondrial introgression (Toews & Brelsford, Reference Toews and Brelsford2012). On the nuclear level, genomic data indicate that hybridization and introgression interacting with recombination and selection result in much more complex scenarios of genetic diversity (Payseur & Rieseberg, Reference Payseur and Rieseberg2016).
Secondary contact of taxa that are well differentiated in allopatry may result in hybridization (Grant & Grant, Reference Grant and Grant2016; Vijay et al., Reference Vijay, Bossu, Poelstra, Weissensteiner, Suh, Kryukov and Wolf2016), even among non-sister species (Koch et al., Reference Koch, Neiber, Walther and Hausdorf2017). Such is the situation for the two Australian cranes, the brolga (Plate 1) and the Australian subspecies of the sarus crane (Plate 2). The brolga, which is endemic to Australasia (Australia and New Guinea), probably split from a common ancestor with the sarus crane 3.3–4.9 million years ago (Krajewski et al., Reference Krajewski, Sipiorski and Anderson2010). Sarus cranes, whose range includes South and South-east Asia (Fig. 1), were first recorded in Australia in the 1960s (Gill, Reference Gill1967) but may have been isolated from Asian populations for up to 37,500 years (Wood & Krajewski, Reference Wood and Krajewski1996).
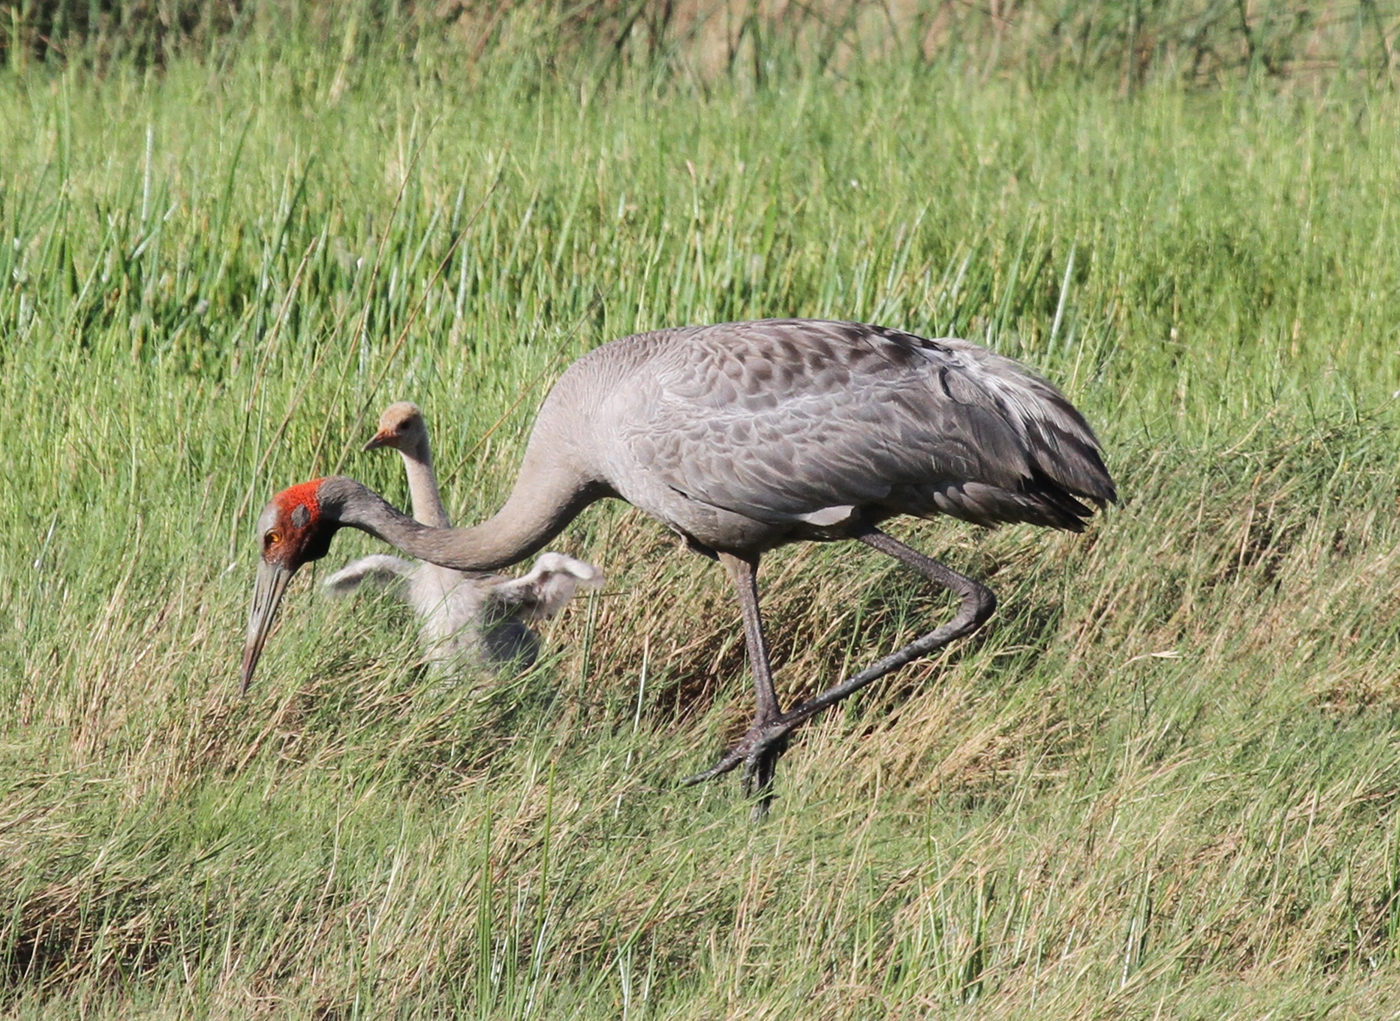
Plate 1 Typical brolga Antigone rubicunda (small red skull-cap type comb, dark wattle and grey legs), with unfledged chick, in Gulf Plains, Australia (Fig. 1). (Photo: T. Nevard)
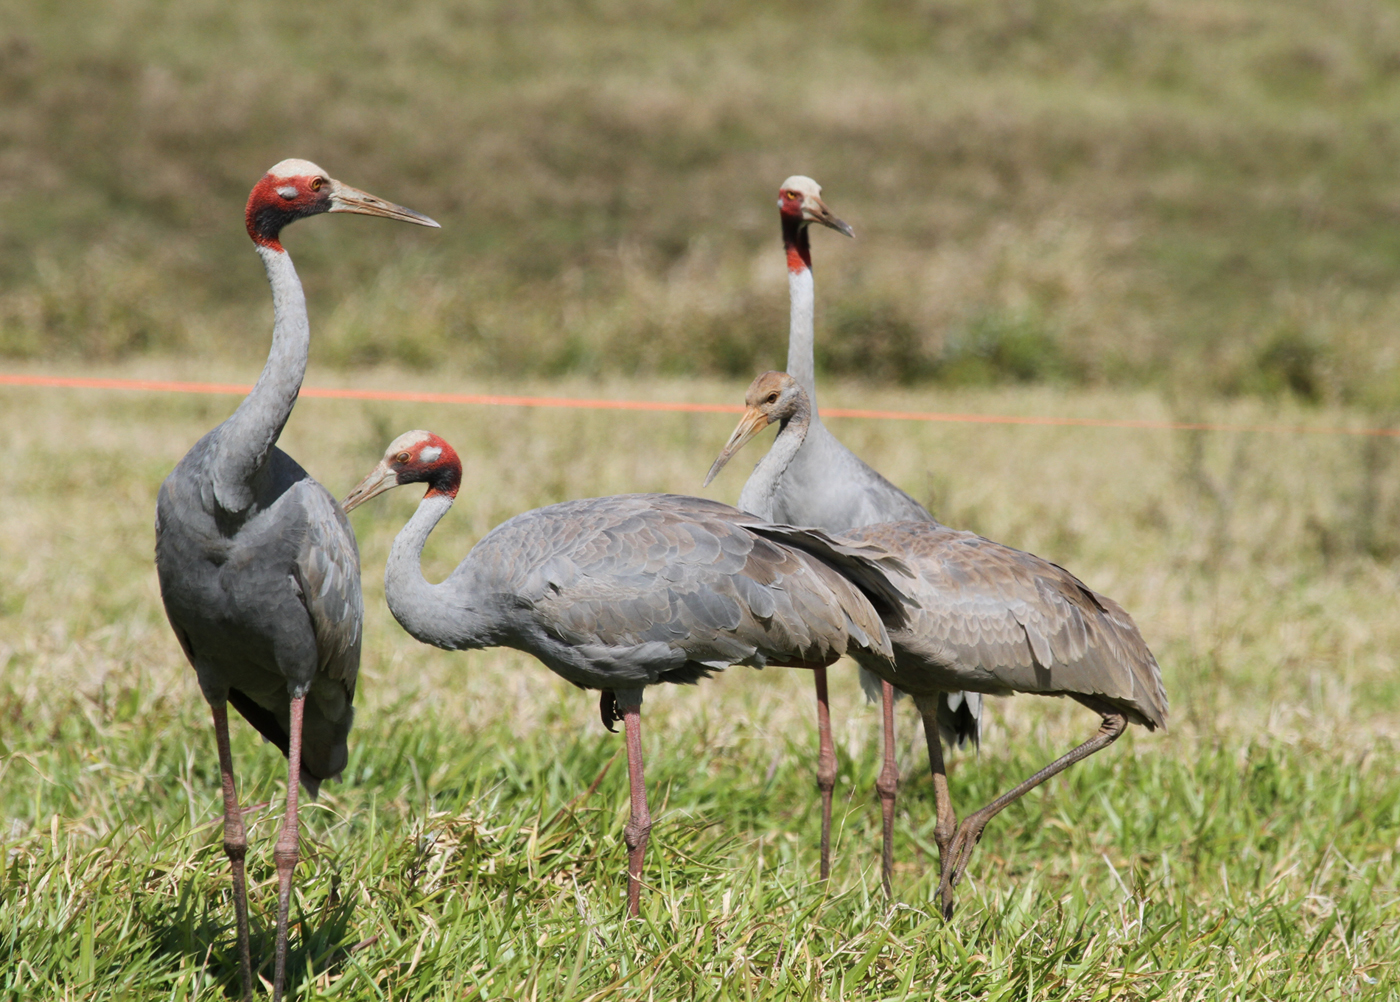
Plate 2 Typical Australian sarus cranes Antigone antigone gillae (pink legs, red comb extending down the neck, whitish crown and darker grey colour), with first-year juvenile, in Atherton Tablelands, Australia (Fig. 1). (Photo: T. Nevard)
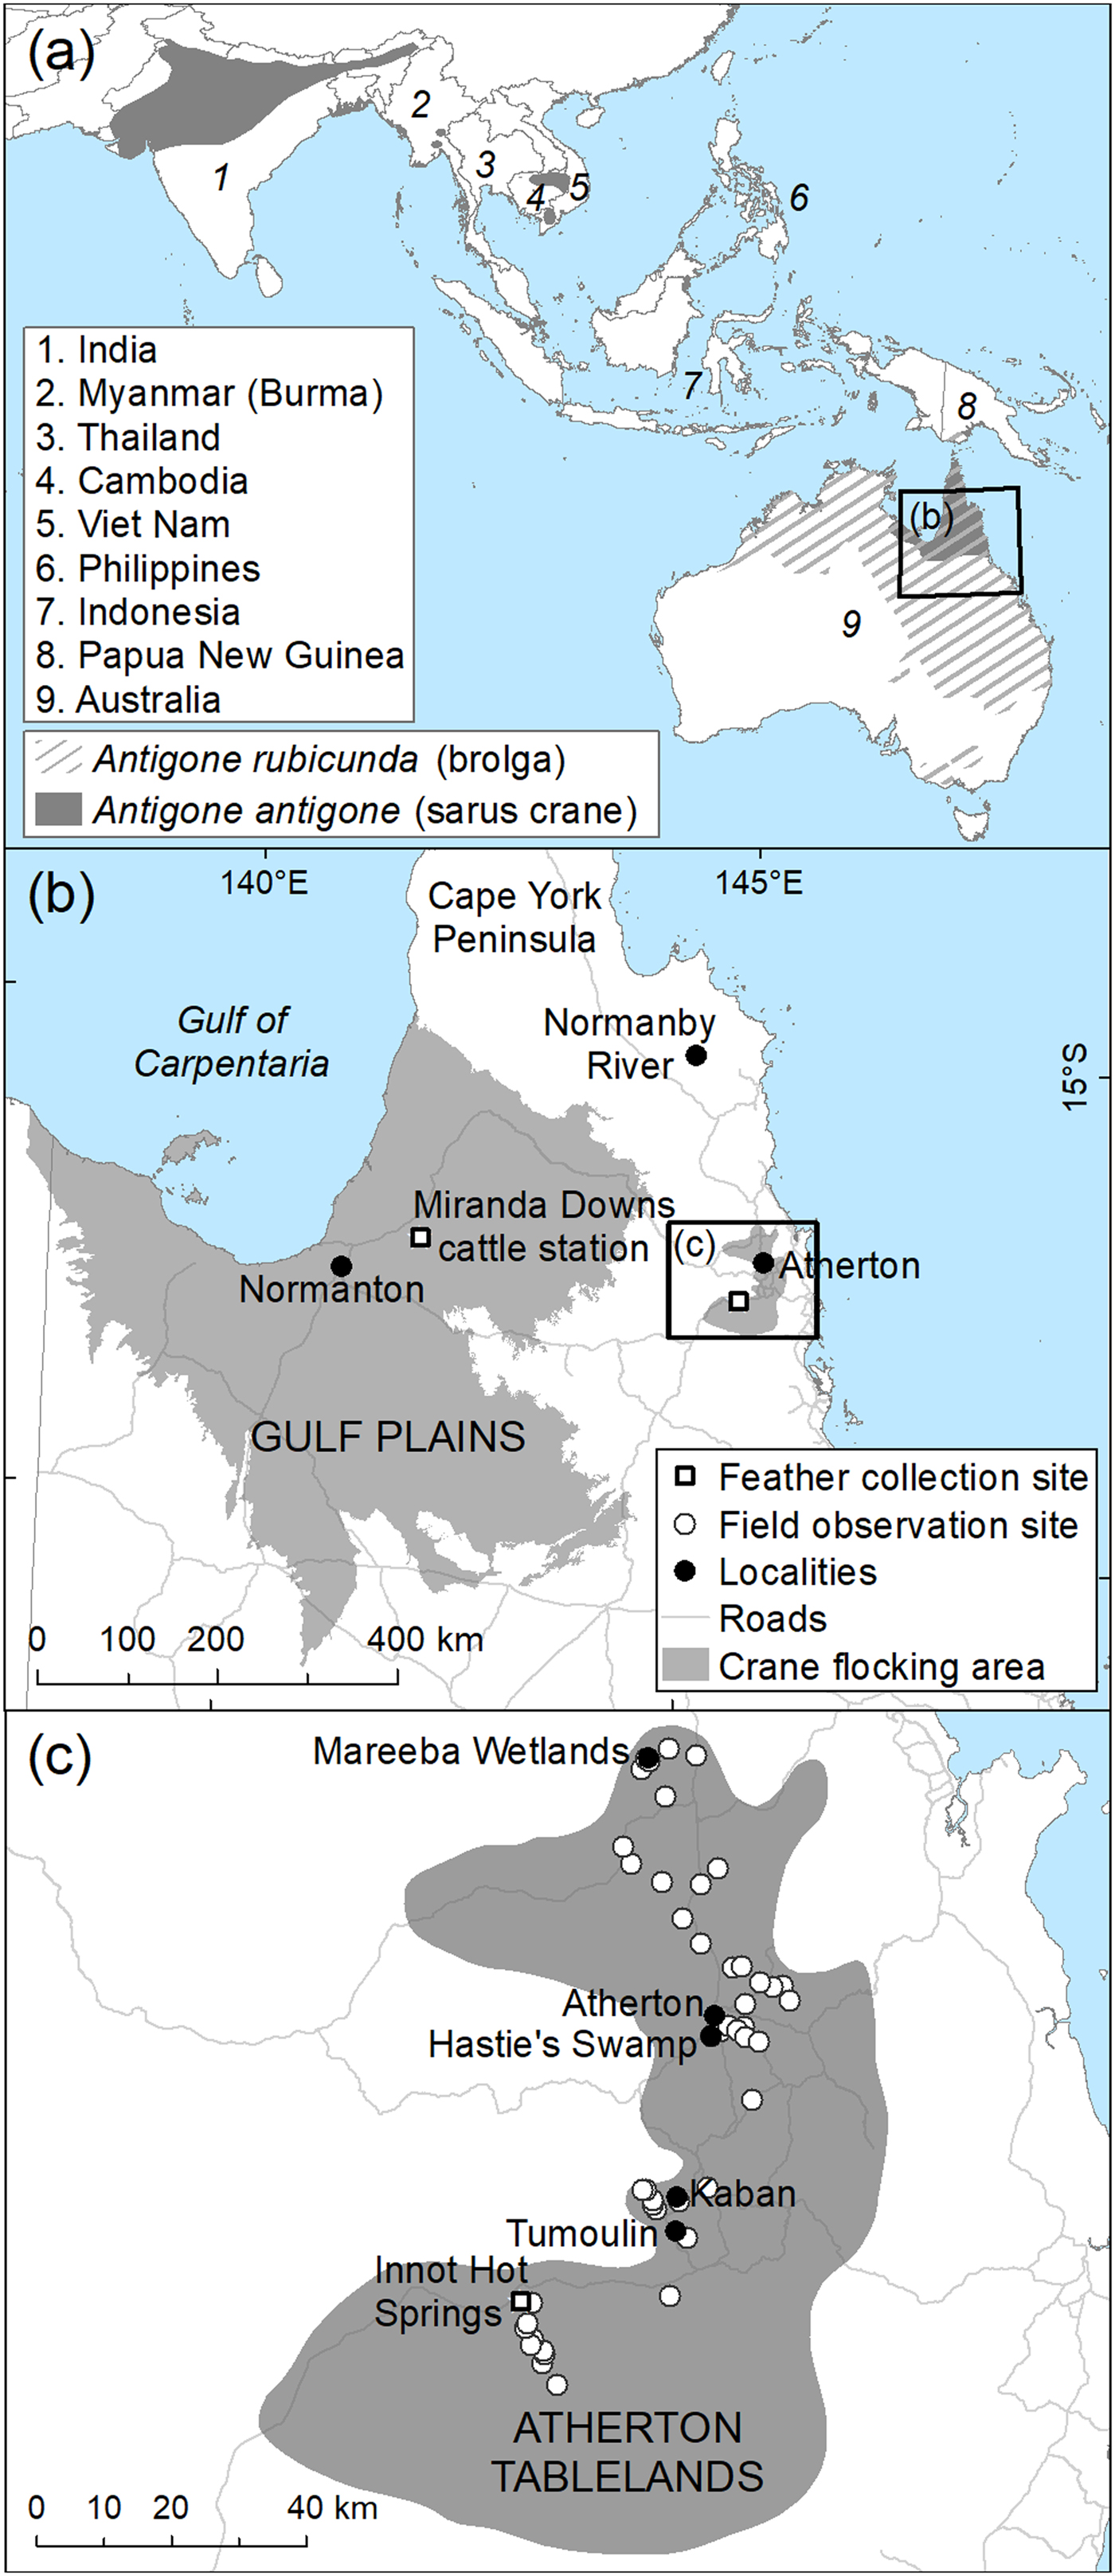
Fig. 1 (a) Global distribution of the brolga Antigone rubicunda and the sarus crane Antigone antigone, and data collection sites in (b) the Gulf Plains and (c) Atherton Tablelands, Australia. Distribution data derived from BirdLife International and NatureServe Bird Species Distribution Maps of the World (2014) and The Australian Bird Guide (Menkhorst et al., Reference Menkhorst, Rogers, Clarke, Davies, Marsack and Franklin2017). Gulf Plains Interim Biological Regionalization Area derived from Department of Environment & Energy (2012), and state roads from Department of Transport & Main Roads (2016).
Hybridization between the brolga and sarus crane was first noted in French aviculture in 1934 (Gray, Reference Gray1958), when fertile hybrids between the brolga and the South-east Asian subspecies of the sarus crane Antigone antigone sharpii were produced. In 1972, when observing the flocking behaviour of brolgas and sarus cranes on the Atherton Tablelands in Queensland, Australia, Archibald (Reference Archibald, Lewis and Masatomi1981) identified at least two and possibly six potential hybrids (for which he coined the name sarolga), and speculated that if hybridization were to increase, introgression could be significant in the conservation of cranes in Australia. Similar concerns led Jones et al. (Reference Jones, Barzen and Ashley2005) to recommend monitoring of the genetic integrity of Australian sarus cranes. The present research is the first to confirm and quantify the extent of natural hybridization between the brolga and the Australian sarus crane.
Brolga
In Australia the brolga occurs across the north of the country in Queensland, the Northern Territory and Western Australia, and as far south as Victoria, where it is threatened (Marchant & Higgins, Reference Marchant and Higgins1993; Fig. 1a). In Queensland the species has been recorded throughout the state (Marchant & Higgins, Reference Marchant and Higgins1993) but is now widespread and abundant only in the north. Although breeding occurs throughout its Queensland range (Marchant & Higgins, Reference Marchant and Higgins1993; Barrett et al., Reference Barrett, Silcocks, Barry and Poulter2003), it appears to be focused on the grasslands and open savannah woodland of the Gulf Plains, south-east of the Gulf of Carpentaria and in Cape York Peninsula. Scattered breeding occurs elsewhere, with flocking (non-breeding) regions including the Atherton Tablelands and south of Townsville on the north-east coast of Queensland (Lavery & Blackman, Reference Lavery and Blackman1969).
The brolga population in northern Australia is generally considered to be stable and was estimated to comprise 20,000–100,000 individuals (Meine & Archibald, Reference Meine and Archibald1996). A total of 51,969 brolgas were recorded by Kingsford et al. (Reference Kingsford, Porter and Halse2012), and all but 135 of these were in northern Australia. The only longitudinal counts are from north-east Queensland (Atherton Tablelands and Townsville regions), with an annual mean of c. 800 individuals recorded by community-based naturalists during 1997–2017, with a peak of c. 2,000 in 2005 (E. Scambler, pers. comm.).
The dispersal patterns and movements of brolgas across their range are poorly understood (Marchant & Higgins, Reference Marchant and Higgins1993). Brolgas undertake seasonal movements between breeding and non-breeding (flocking) habitats in response to rain and flooding (Marchant & Higgins, Reference Marchant and Higgins1993). Flocks are formed during the dry season and pairs disperse to breeding sites in the wet season. Although there is an increasing body of work on the species in the southern part of its range, especially in Victoria (Harding, Reference Harding2001; Herring, Reference Herring2005, Reference Herring2007), knowledge of the behaviour and ecology of tropical brolgas remains largely confined to earlier studies, such as those of Hughes & Blackman (Reference Hughes and Blackman1973). Brolgas can use brackish waters, having a unique salt-gland, and when observed with sarus cranes near Normanton, brolgas favoured deeper, generally coastal marshes (Walkinshaw, Reference Walkinshaw1973). However, they also occur in open forest and woodland, grassland and cultivated land (Lavery & Blackman, Reference Lavery and Blackman1969).
Australian sarus crane
Although the sarus crane is primarily a South Asian species, it is extinct in the Philippines and declining in much of its Asian range, particularly in Burma, Thailand and Indochina (Meine & Archibald, Reference Meine and Archibald1996; Archibald et al., Reference Archibald, Sundar and Barzen2003), and is categorized as Vulnerable on the IUCN Red List (BirdLife International, 2016). The Australian sarus crane population is therefore of international conservation significance and hybridization with the brolga could potentially be a threat to the genetic integrity of the Australian subspecies.
Sarus cranes in Australia are almost entirely confined to Queensland (Fig. 1a), with known breeding areas along the Gulf Plains and on the Normanby River floodplains in eastern Cape York Peninsula (Marchant & Higgins, Reference Marchant and Higgins1993; Barrett et al., Reference Barrett, Silcocks, Barry and Poulter2003; Franklin, Reference Franklin, Lukacs and Finlayson2008). Most breeding records are from the Gulf Plains and concentrated in the Gilbert and Norman River catchments, where cranes make use of both natural and man-made wetlands on cattle properties (Barrett et al., Reference Barrett, Silcocks, Barry and Poulter2003). The only known major dry-season flocking area for sarus cranes is the Atherton Tablelands and its immediate vicinity. Counts of dry-season flocks on the Atherton Tablelands provide the only current estimates of sarus crane recruitment rates (Marchant & Higgins, Reference Marchant and Higgins1993; Grant, Reference Grant2005). An unknown proportion of the sarus crane population remains on the Gulf Plains and the adjacent inland area in the dry season, and therefore utilizes different landscapes and food types during this period, as there are no significant cropped areas. Migration routes followed by sarus cranes to the Atherton Tablelands from their breeding areas, and their habitat usage along the way, are currently unknown. The importance of migration routes is becoming increasingly understood, as knowledge of breeding and non-breeding locations alone is insufficient to secure the protection of migratory species (Runge et al., Reference Runge, Martin, Possingham, Willis and Fuller2014).
Estimates of total numbers of Australian sarus cranes have varied from 5,000 to 10,000 individuals (E. Scambler, pers. comm.), but these have low reliability (Garnett & Crowley, Reference Garnett and Crowley2000). Annual (unpublished) counts undertaken by local members of BirdLife Australia on the Atherton Tablelands (E. Scambler, pers. comm.) indicate 800–1,500 individuals flocking in dry seasons during 1997–2017 but it is not known what proportion of the total Australian sarus crane population these birds represent. There are no current estimates of population trends in Australia (E. Scambler, pers. comm.), but it is thought that numbers of sarus cranes have increased from perhaps as few as 200 on the Atherton Tablelands in the late 1960s (G. Archibald, pers. obs.).
Aims
Although the presence of putative hybrid cranes on the Atherton Tablelands has been noted by experienced observers for many years, we hypothesized that it is possible that these were non-hybrid birds, exhibiting intrinsic phenotypic variability. We were therefore interested in testing the degree of introgression (if any) in the crane population, as well as providing a benchmark for its future measurement both visually and genetically. To do this we needed to understand whether birds with the visual characteristics that had led observers to believe that they were hybrids (sarolgas) were, in fact, hybrids.
We aimed to (1) establish the extent of hybridization between the Australian sarus crane and the brolga, using molecular methods; (2) seek evidence from these genetic data for the presumed connectivity of breeding and flocking areas in the Gulf Plains and Atherton Tablelands; (3) describe the distribution of individuals with hybrid characteristics on the Atherton Tablelands; and (4) discuss the results primarily with respect to their relevance to biological conservation of the two species in Australia.
Methods
Field observations and sample collection
We observed cranes during July 2013–June 2016 in 51 monthly circuits of 334.7 km that encompassed 46 foraging sites distributed across all known crane flocking areas of the Atherton Tablelands (Figs 1d & 2), which were visible from the road. At each site we counted adult and first-year juvenile brolgas and sarus cranes using 10 × 40 binoculars, and examined potential hybrids (see below and Plate 3) using a 50 × spotting scope. Individuals could not be distinguished and were probably counted on multiple occasions and at multiple sites. However, enough cranes were counted that there is no reason to suspect systematic bias in the estimate of the proportion of visually distinguishable hybrids amongst the wider crane population.
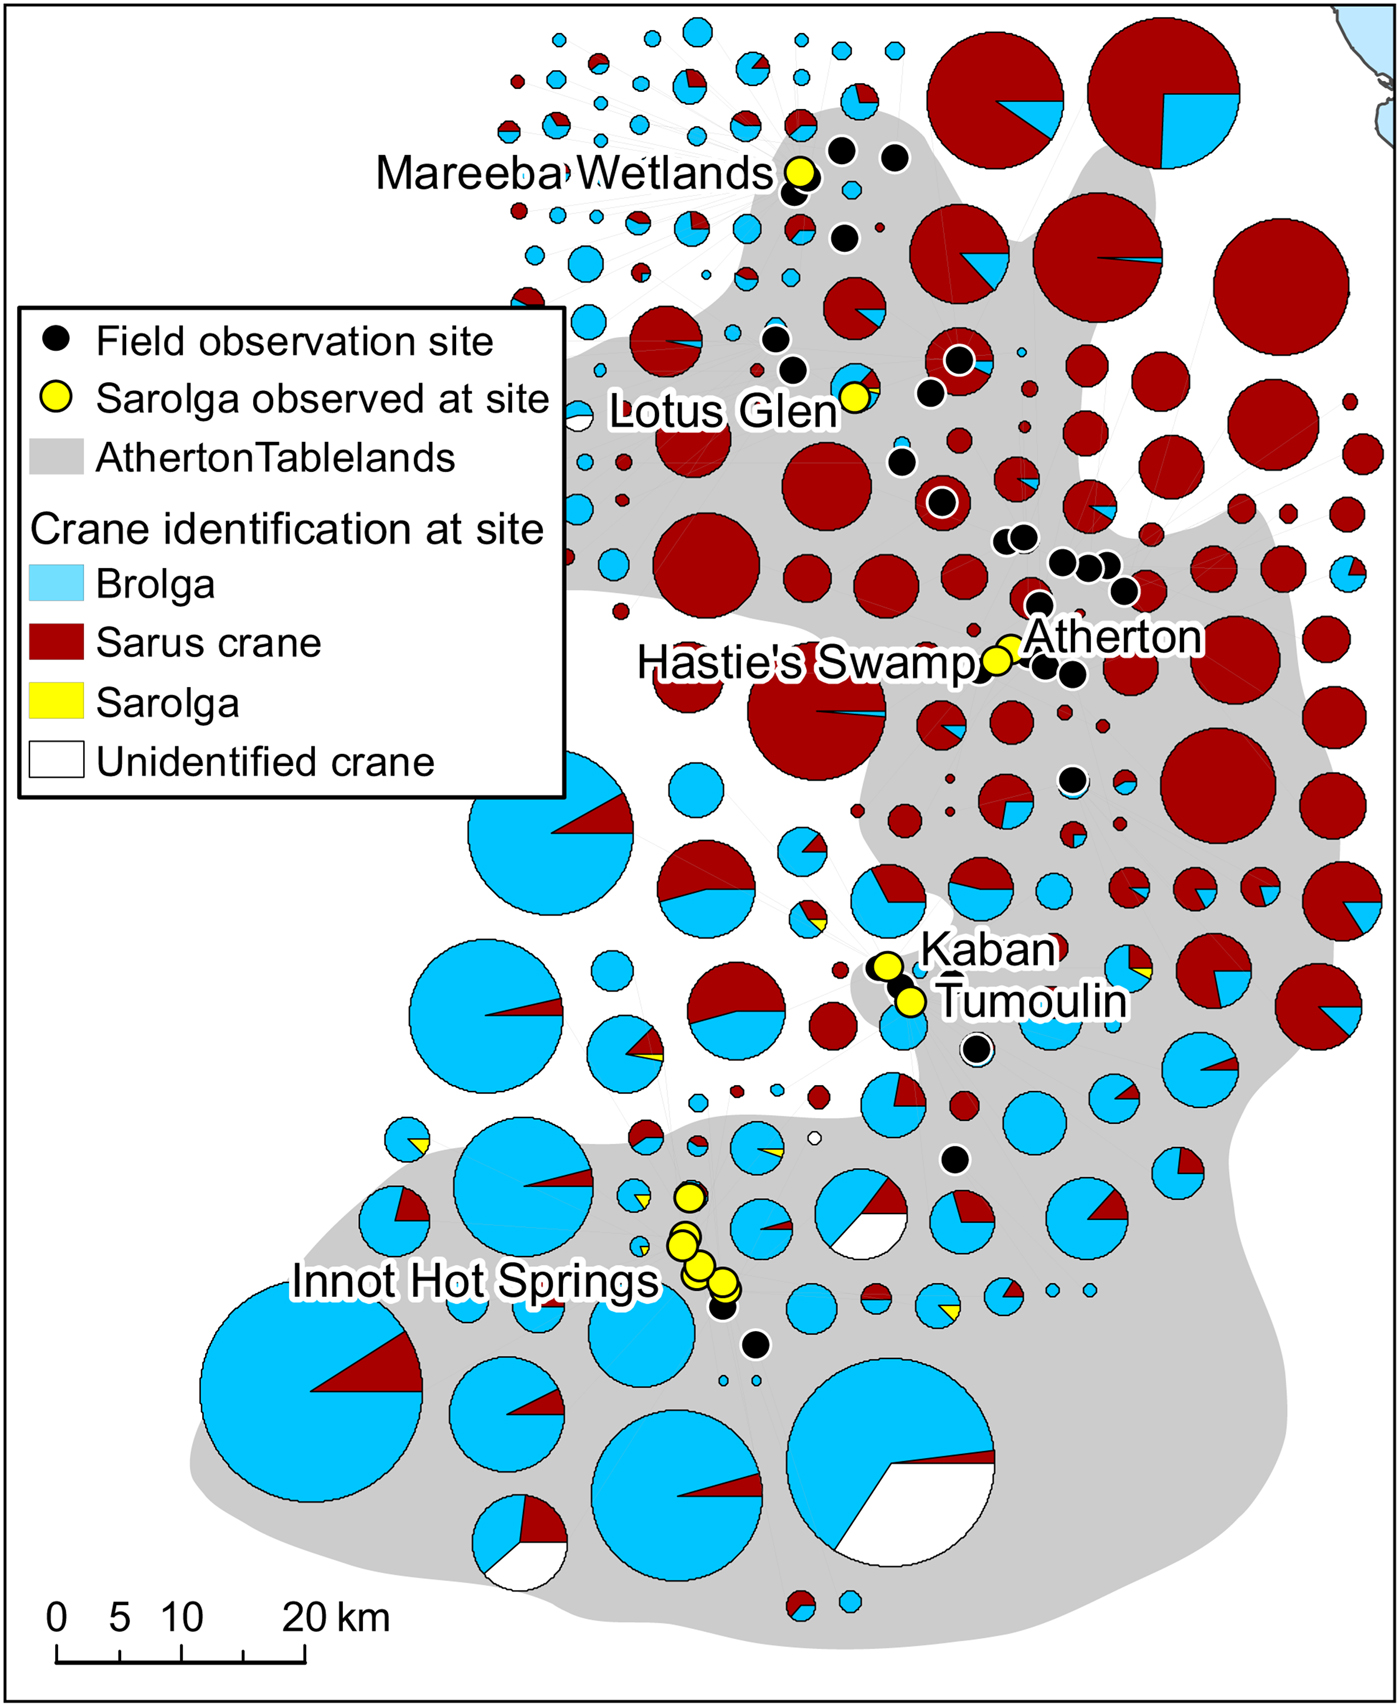
Fig. 2 Distribution and clustering of brolga, sarus crane and sarolga visually identified at 46 sites on the Atherton Tablelands (Fig. 1) during 2013–2016. On some occasions, as a result of poor light and weather conditions, cranes could not be identified.
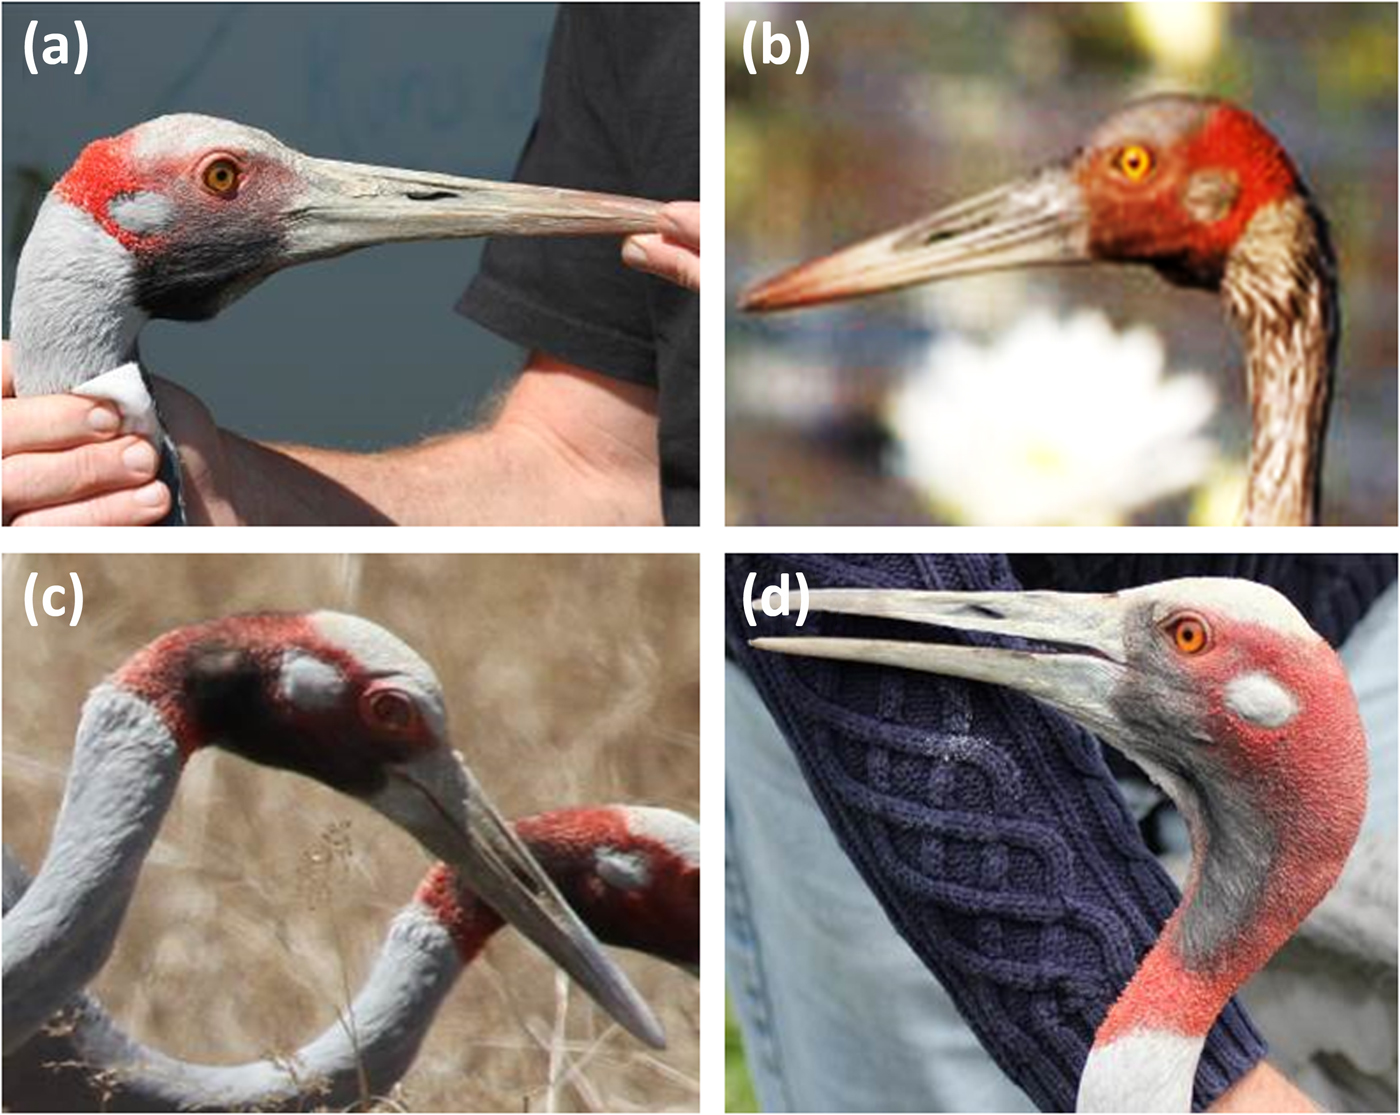
Plate 3 Heads and necks of typical species phenotypes and presumed hybrids. (a) Typical brolga; (b) sarolga (this bird was congruent with a typical brolga, except that it had pink legs, slightly more red on the nape of the comb than is typical of brolgas, and a very small, almost non-existent wattle; this combination of characters had not hitherto been recorded); (c) typical sarolga, with much shorter neck comb and slight wattle; and (d) typical Australian sarus crane. (Photos a, c & d: T. Nevard; b: B. Johnson)
The initial identification of hybrids was based on the presence of at least four readily observable characteristics including at least two of (1), (4) and (6) in Archibald's (Reference Archibald, Lewis and Masatomi1981) typology of sarolgas: (1) larger and heavier than either parent species; (2) an irregular border to the comb; (3) notches in the cap; (4) intermediate or mixed-colour legs; (5) a scalloped mantle; (6) brighter yellow eyes than typical sarus cranes (which are more orange); and (7) a small wattle. Although Archibald's (Reference Archibald, Lewis and Masatomi1981) typology was helpful, in overall appearance the sarolgas he described were more like atypical sarus cranes than atypical brolgas, whereas we also observed putative hybrids that looked more like atypical brolgas (Plate 3b).
In May 2014, freshly shed feathers were collected opportunistically from Miranda Downs cattle station (17°19.755′ S, 141°52.770′ E, elevation 55 m) on the Gulf Plains, and in September 2015 from Innot Hot Springs (17°43.749′ S, 145°16.302′ E, 628 m) on the southern edge of the Atherton Tablelands (Fig. 1c). Only feathers with minimal contamination from soil and vegetation were selected and were picked from dry ground, using forceps, placed immediately in sealed plastic bags and refrigerated prior to analysis.
Molecular analysis
A total of 389 feathers were collected and prepared for genotyping: 187 from the Gulf Plains and 202 from the Atherton Tablelands. Fifteen samples (blood, feathers) were taken from reference birds, which were either phenotypically typical or for which a potential history of contact with the other species could be excluded or minimized (3 A. antigone antigone, 7 A. antigone gillae, 5 A. rubicunda; Table 1; note that including the non-Australian A. antigone antigone in the reference collection does not affect the veracity of the comparison with brolga). DNA was extracted using the slightly modified sodium dodecyl sulphate/salting-out protocol of Miller et al. (Reference Miller, Dykes and Polesky1988). To increase the yield, dithiothreitol and Roti-PinkDNA (Carl Roth, Karlsruhe, Germany) were added. Initially we tested the 22 microsatellite loci that had been used successfully for other species of crane (Hasegawa et al., Reference Hasegawa, Ishibashi and Abe2000; Meares et al., Reference Meares, Dawson, Horsburgh, Glenn, Jones and Braun2009) as well as the sarus crane (Jones et al., Reference Jones, Barzen and Ashley2005) and the brolga (Miller, Reference Miller2016). Of these, 10 could be consistently amplified and scored (Table 2). Polymerase chain reactions (PCRs) were conducted in a volume of 10 μl and contained 1 μl DNA (10–25 ng), 1 μl of 10 × NH4-based reaction buffer, 1.5–2.25 mM MgCl2 solution (Table 2), 0.25 mM of each primer, 0.2 mM of dNTP, 0.04 μl of BioTaq DNA polymerase (5 U/μl), 0.6 μl of 1% bovine serum albumin and sterile ddH2O. For two loci, GR22 and GR25, we used the MyTaq mix (all products from Bioline, London, UK). The PCR profile comprised an initial denaturation at 94 °C, 36 cycles including denaturation at 94 °C, primer specific annealing (Table 2) and extension at 72 °C, each for 30 s, and a final elongation at 72 °C for 10 minutes. Microsatellite alleles were separated on a 3130xl Genetic Analyzer, together with the GeneScan 600 LIZ Size Standard 2.0 (Applied Biosystems, Waltham, USA). Fragment sizes were determined manually to avoid the inconsistencies in automatic calling that result from the arbitrariness of bin width definitions using GeneMapper 4.0 (Applied Biosystems, Waltham, USA). To control the accuracy of size determination we repeated PCRs of samples that initially gave weak signals or had rare variants. In other cases, problematic PCR samples that were initially typed in different runs, and therefore possibly difficult to calibrate, were loaded on the same plate to improve comparability.
Table 1 Notes on 15 reference individuals of the sarus cranes Antigone antigone antigone and Antigone antigone gillae and the brolga Antigone rubicunda from which samples were taken for molecular analysis. Samples were taken from living or recently deceased wild birds that were phenotypically typical, or from birds whose lineages of descent were known not to have had contact with the other species.
Table 2 PCR specifications, genetic diversity and allele richness of microsatellite loci of brolgas and sarus cranes from the Gulf Plains (Gulf) and Atherton Tablelands (Table), Australia (Fig. 1), with locus/dye (fluorophore at 5′-end of forward primer), MgCl2 concentration, annealing temperature (T), number of alleles, genetic diversity and allelic richness. The following loci could not be consistently amplified or scored: Gamμ2, Gamμ5, Gamμ6, Gamμ7, Gamμ9, Gamμ12, Gamμ21, Gamμ102, GjM11, GjM34, GjM40, GR17 (Hasegawa et al., Reference Hasegawa, Ishibashi and Abe2000; Meares et al., Reference Meares, Dawson, Horsburgh, Glenn, Jones and Braun2009; Miller, Reference Miller2016).
1 Heterozygote deficiency.
2 Multiplexed.
As there was the possibility that feathers of a particular bird were collected more than once, identical genotypes were identified using Cervus 3.0.7 (Kalinowski et al., Reference Kalinowski, Taper and Marshall2007). Consequently, 41 samples (16 Gulf Plains, 24 Atherton Tablelands, 1 captive reference A. antigone gillae that was identical to its sibling) were excluded from the following analyses. In 11 of these cases the same genotype was found in both localities. In these cases the sample from the Atherton Tablelands was excluded arbitrarily. Missing data were not considered to be problematic, as only 16.2% of the birds had missing data and only two of the nine potential hybrids lacked data (at one locus each). It was not possible to distinguish siblings from non-siblings because the genetic variance would be too large given the moderate number of markers.
To identify the number of genetic clusters and potential hybrid individuals we conducted Bayesian clustering using STRUCTURE 2.3.4 (Pritchard et al., Reference Pritchard, Stephens and Donnelly2000; Falush et al., Reference Falush, Stephens and Pritchard2007), with K (number of clusters) ranging from one to five and 10 replicates, assuming the admixture model and, in different runs, either uncorrelated or correlated allele frequencies. The Markov chains ran for 550,000 generations, including a burn-in of 50,000. Pilot runs with longer Markov chains yielded identical results. We used Structure Harvester 0.6.94 (Earl & von Holdt, Reference Earl and von Holdt2012) to analyse the data, following Evanno et al. (Reference Evanno, Regnaut and Goudet2005), and STRUCTURE PLOT V2.0 (Ramasamy et al., Reference Ramasamy, Ramasamy, Bindroo and Naik2014) and Adobe Illustrator CS4 (Adobe Systems Inc., San José, USA) to render the graphical output. We defined individuals with admixture Q of 0.1–0.9 as hybrids, following Devitt et al. (Reference Devitt, Baird and Moritz2011). These thresholds were considerably more conservative in our analysis as we used 10 loci, compared to three used by Devitt et al. (Reference Devitt, Baird and Moritz2011). However, this restriction was necessary because the loci used by Devitt et al. (Reference Devitt, Baird and Moritz2011) had species-specific alleles whereas the two species of cranes we compared shared some alleles. We did not attempt to identify different classes of hybrids (F1, F2 and their backcrosses) because this would have required genotyping at least 50 loci (Fitzpatrick, Reference Fitzpatrick2012) and we had only 10 available. The Bayesian clustering approach was validated by k-means clustering, which, in contrast to STRUCTURE, is free of assumptions about population genetics, using GenoDive 2.0b23 (Meirmans & van Tienderen, Reference Meirmans and van Tienderen2004). Individuals were clustered based on their allele frequencies according to the pseudo F statistic of Caliński & Harabasz (Reference Caliński and Harabasz1974; see also Meirmans, Reference Meirmans2012).
More detailed population genetic analyses were conducted based on the clusters identified by Bayesian clustering, including descriptive statistics and tests for Hardy–Weinberg equilibrium, linkage disequilibrium, null alleles, and population differentiation, using FSTAT 2.9.3.2 (Goudet, Reference Goudet1995), GenePop 4.2 (Raymond & Rousset, Reference Raymond and Rousset1995; Rousset, Reference Rousset2008) and Micro-Checker 2.2 (Van Oosterhout et al., Reference Van Oosterhout, Hutchinson, Wills and Shipley2004). We estimated gene flow using the formula Nm = [(1/FST) − 1]/4 (where Nm is the number of effective migrants) as well as based on private alleles; i.e. alleles occurring only in one subpopulation (Barton & Slatkin, Reference Barton and Slatkin1986), the latter in GenePop. Probabilities that two individuals were identical were calculated using Cervus, assuming either that the two birds were unrelated or, more conservatively, that they were full siblings (Waits et al., Reference Waits, Luikart and Taberlet2001). In multiple tests, α was Bonferroni corrected.
Lincoln-Petersen index
We applied the Lincoln–Petersen index to our ‘genetically re-trapped’ birds (nGulf × nTablelands/nboth) based on methodology described by Southwood & Henderson (Reference Southwood and Henderson2000).
Results
Field observations
Our observations of cranes on the Atherton Tablelands are summarized in Table 3 and Fig. 2. Of 40,826 cranes identifiable to species level (of a total of 44,554 observations), only 84 were classified as morphologically intermediate sarolgas (0.205%). Variation among these intermediate birds meant it was not possible to assess the extent of potential hybridization (Plate 3).
Table 3 The number of brolgas, sarus cranes and sarolgas observed across 46 sites on the Atherton Tablelands in Queensland, Australia (Fig. 1) during 2013–2016.

* Because of poor weather/light conditions.
Our observations of identifiable hybrids on the Atherton Tablelands were concentrated in a relatively small number of areas (Fig. 2), including Innot Hot Springs, Tumoulin/Kaban, Hastie's Swamp and the Mareeba Wetlands. Figure 2 also illustrates that although they occur in mixed flocks, brolgas and sarus cranes are differentially distributed across the Atherton Tablelands, with higher numbers of sarus cranes concentrated on more fertile volcanic soils closer to Atherton itself, and both brolgas and putative hybrids occurring predominantly in areas of lower intrinsic fertility.
At sites with higher counts of either brolgas or sarus cranes, the species with smaller numbers in the flock tended to have proportionally more first-year juveniles (Table 4; χ 2 tests: P < 0.0001 in both cases), potentially increasing opportunities for interactions between species while juveniles are at a critical age for pair-bonding.
Table 4 Total number of cranes (and % juveniles) at sites dominated by either brolgas or sarus cranes.

Population genetics
In all STRUCTURE analyses the highest ΔK resulted from assuming two clusters, and this was confirmed by k-means clustering. These clusters corresponded well to the species brolga and sarus crane, as indicated by the reference birds (Fig. 3). As allele frequencies apparently differed considerably between the species, we based the subsequent analyses on the STRUCTURE model assuming uncorrelated frequencies. Although the majority of birds were either pure brolga or pure sarus crane, some were admixed (Fig. 3).

Fig. 3 STRUCTURE plot with K = 2 showing admixture (Q) among a total of 363 brolgas and sarus cranes, ordered horizontally by decreasing Q, with brolga as reference. The rectangle includes nine hybrids, with Q = 0.9–0.1. The bar underneath indicates the origin of birds and reference specimens.
According to our criteria, 239 samples belonged to brolgas (90 Gulf Plains, 149 Atherton Tablelands) and 101 to sarus cranes (77 Gulf Plains, 24 Atherton Tablelands). Nine individuals (2.58%; 4 Gulf Plains, 5 Atherton Tablelands) had Q scores of 0.125–0.888 (reference: brolga) and were identified as hybrids (Fig. 3), a proportion c. 10 times greater than in our field observations. Four hybrids had alleles occurring only in brolgas at one or two loci, indicating that hybrids are fertile and can interbreed at least with brolgas or other hybrids.
After exclusion of reference birds and hybrids, we analysed the species separately, dividing both into two subpopulations corresponding to the localities. Genetic diversity is summarized in Table 2. Genetic diversity and allelic richness were both considerably higher in brolgas. Brolgas also exhibited 26 private alleles, 1–6 per locus, whereas sarus cranes had only eight private alleles, and four loci did not have any. This translates into much lower probabilities that two individuals will carry the same genotype in brolgas than in sarus cranes. The probabilities of finding two unrelated individuals with identical genotypes were 7.1 × 10⁻⁷ for brolgas and 0.0012 for sarus cranes. Assuming the individuals were full siblings, these probabilities increased to 0.0023 and 0.0395, respectively. In brolgas and sarus cranes, four and three loci, respectively, deviated from the Hardy–Weinberg equilibrium and the same loci had indications of null alleles. However, this was probably because there was a relatively high number of rare alleles (frequency < 5%) in both species, and therefore it was not considered to be problematic for our analyses. In any case, the general results of the STRUCTURE analysis did not change after exclusion of these loci. Linkage disequilibrium did not play a role in either species. In both species, subpopulations were hardly differentiated, with F ST = 0.010 (95% CI 0.003–0.020) in brolgas and 0.047 (−0.006–0.136) in sarus cranes. The significant result for brolgas is probably attributable to sample size and is not biologically relevant. Estimates of migration based on the private allele method were high in both species, with 6.56 and 7.75 migrants per generation for brolgas and sarus cranes, respectively. Transforming FST into estimates of migration using the formula Nm = [(1/FST) − 1]/4, we inferred 24.75 and 5.07 migrants, respectively.
Lincoln–Petersen index
In 11 cases the same genotypes were collected at both Miranda Downs in the Gulf Plains and at Innot Hot Springs in the southern Atherton Tablelands. Of these, nine were attributable to brolgas and two to sarus cranes. According to the probabilities of encountering two individuals carrying identical genotypes by chance with our sample sizes, only the two sarus cranes could be cases of chance identity, provided the birds were siblings (see above). Applying the Lincoln–Petersen index (nGulf × nTablelands/nboth; Southwood & Henderson, Reference Southwood and Henderson2000) to these results implies that at least 1,473 brolgas and 923 sarus cranes could have moved between the Gulf Plains and Atherton Tablelands.
Discussion
Since Archibald's first observation of brolga–sarus crane hybrids in 1972 (Archibald, Reference Archibald, Lewis and Masatomi1981), local observers have continued to note the presence of apparent hybrids amongst dry season, non-breeding crane flocks on the Atherton Tablelands (Matthiessen, Reference Matthiessen2002) and elsewhere. We have shown that natural hybridization between brolgas and sarus cranes is happening and occurs more widely than is visually detectable. As hybridization is still relatively rare and brolgas and sarus cranes are differentially distributed on the Atherton Tablelands (Fig. 2), its evolutionary influence could potentially be relatively limited. However, a closer look at the allele combinations in the hybrids suggests that introgression could become more widespread. Four of the birds had alleles that occur only in brolgas at one or two loci. Although one of these birds had a membership index of 0.5, suggestive of being an F1-hybrid, these pure brolga combinations indicate that the birds are hybrids of a later generation with a hybrid parent that back-crossed with a brolga or another hybrid. Sarolgas therefore appear to be fertile at several generational recombinations.
Longitudinal research on Darwin's finches Geospiza spp. has shown that they evolved from a common ancestor in the Galápagos archipelago in the last 2 million years (Grant & Grant, Reference Grant and Grant2008), with both natural selection and introgressive hybridization being key processes in their evolution. At this stage it is not possible to predict the trajectory of brolga/sarus crane introgression but Lamichhaney et al. (Reference Lamichhaney, Berglund, Wang, Almén and Webster2016) demonstrated that introgression at only a single locus may have important evolutionary consequences. Interaction of introgression and selection may be complex and locality dependent, as shown for the European crow Corvus corone (Vijay et al., Reference Vijay, Bossu, Poelstra, Weissensteiner, Suh, Kryukov and Wolf2016), in which genetic and phenotypic differentiation varies significantly across its range, with some boundaries being firm and others mobile. Ongoing brolga/sarus crane introgression may provide alleles to either species that could facilitate their adaptation to environmental changes brought about by such stresses as climate change or agricultural intensification; however, whether the larger body size of hybrids identified by Archibald (Reference Archibald, Lewis and Masatomi1981) confers a selective advantage over the parental species, potentially leading to its displacement, cannot yet be determined.
The current Australian population of sarus cranes appears to have increased relatively rapidly from what is thought to have been small numbers in northern Australia since its formal identification in the 1960s (Gill, Reference Gill1967). Archibald (Reference Archibald, Lewis and Masatomi1981) estimated the sarus crane population was c. 200 on the Atherton Tablelands in 1972, when he identified at least two and possibly six potential brolga–sarus crane hybrids (Archibald, Reference Archibald, Lewis and Masatomi1981).
Crops have been grown in northern Australia since the late 19th century and agriculture expanded substantially on the Atherton Tablelands in the 1960s, soon after Gill's first observation of sarus cranes. Templeton et al. (Reference Templeton, Shaw, Routman and Davis1990) found that changes in landscapes can be associated with genetic consequences, including introgression, which threatens species integrity (e.g. kākāriki Cyanorhamphus spp., Triggs & Daugherty, Reference Triggs and Daugherty1996, and black-eared miners Manorina melanotis, Clarke et al., Reference Clarke, Gordon and Clarke2001). Landscape features and heterogeneity can also be reflected in population genetic structure within and across species (Miller & Haig, Reference Miller and Haig2010; Safner et al., Reference Safner, Miller, McRae, Fortin and Manel2011), and often changes in landscape are associated with habitat loss, contributing to population decline and possibly resulting in changes in the genetic diversity of remaining populations (Templeton et al., Reference Templeton, Shaw, Routman and Davis1990; Keyghobadi, Reference Keyghobadi2007).
That the species with fewer individuals in a mixed-species flock has proportionally more first-year juveniles means that young brolgas and sarus cranes are more exposed to one another other at a time when imprinting is important (Horwich, Reference Horwich, Ellis, Gee and Mirande1996). This may make pairing with the other species more likely. The enduring pair bond and longevity in both species (Johnsgard, Reference Johnsgard1983) suggests that, once formed, hybrid pairs could contribute numerous hybrid offspring to the population. Although we cannot yet predict the trajectory of crane introgression in northern Australia, there are clear conservation implications. The sarus crane is thought to be declining in much of its Asian range, particularly in Burma, Thailand and Indochina (Meine & Archibald, Reference Meine and Archibald1996; Archibald et al., Reference Archibald, Sundar and Barzen2003). The maintenance of Australian sarus crane populations and their genetic integrity may therefore provide security for the species should populations continue to decline in Asia. However, there seems to be no practical way of eliminating Australian crane introgression in the wild, as (1) hybrids are not necessarily visually distinguishable in the field, (2) Australian cranes occur in remote and inaccessible areas, and (3) the underlying behavioural stimuli are not yet understood. If related to anthropogenically driven land-use change, brolgas and sarus cranes may be brought into ever-closer and more frequent foraging and flocking proximity, potentially leading to more opportunities for hybridization. Therefore, should the maintenance of genetically pure populations of Australian sarus cranes and northern Australian brolgas be considered desirable for conservation purposes, one or more well-managed extralimital populations may need to be established. As far as we know, the only captive flock of Australian sarus cranes is in Lemgo, Germany, whose ancestry dates from a wild capture in the 1970s. This could potentially form a nucleus for a captive metapopulation, spread across several institutions. Establishing a flock managed to maintain its genetic variability at this stage could also serve as insurance against climate change impacts, with some models predicting a potential 91% decline in climatic suitability for the Australian sarus crane by 2085 (Garnett et al., Reference Garnett, Franklin, Ehmke, VanDerWal, Hodgson and Pavey2013).
As we have collected feathers from what appear to be the same birds in both the Gulf Plains and Atherton Tablelands, considering the low probabilities of encountering genetically identical individuals, we have been able to confirm what has hitherto only been assumed by birdwatchers in North Queensland, that cranes migrate between breeding areas in the Gulf Plains and the Atherton Tablelands, a distance of c. 500 km. There appears to be no material genetic difference between Gulf Plains and Atherton Tablelands cranes, indicated by estimates of population differentiation and migration after exclusion of the duplicate genotypes. The conservation implications of this are significant, as both areas will need to be targeted with appropriate conservation measures to ensure the survival of north Queensland's brolgas and sarus cranes. There are currently no laws protecting species that migrate within Australia (Runge et al., Reference Runge, Gallo-Cajiao, Carey, Garnett, Fuller and McCormack2017).
The identification of identical birds in both the Gulf Plains and Atherton Tablelands based on shed feathers highlights the potential of genetic analyses to explore migration patterns and potential trends, not only in Australian cranes but also in other species. Although our collection of feathers was opportunistic rather than deliberately random and our estimates using the Lincoln–Petersen index are therefore necessarily indicative, they are of the same order as other estimates of crane populations on the Atherton Tablelands (Brolga 800–2,000 counted, 1,473 calculated; sarus crane 800–1,500 counted, 973 calculated). Similarly to the use of non-invasive genetic monitoring techniques elsewhere, such as for large carnivores in Europe (Kaczensky et al., Reference Kaczensky, Guillaume, Huber, Andrén and Linnell2012), feather genetics could contribute to the assessment of population trends and movements of cranes within the Atherton Tablelands and between the Atherton Tablelands and other locations where either species occurs.
Although feathers have the advantage of being a non-invasive means of gathering genetic data on individuals, as noted by Hou et al. (Reference Hou, Xu, Lin, d'Urban-Jackson, Dixon and Bold2018), the probability of detecting hybrids was > 10 times greater using genetic analysis rather than visual observation. However, the boundaries between pure and hybridized birds are unclear and are probably indefinable given that hybrids are fertile, meaning that introgression may have reached the point where it has no clear thresholds. A subject of future research could therefore be the definition of the relationship between genetics and phenological expression, using the feathers of known birds with hybrid phenotypes, and using data from more than the 10 loci we had available (Fitzpatrick, Reference Fitzpatrick2012). In addition, genomic approaches targeting coding loci (Payseur & Rieseberg, Reference Payseur and Rieseberg2016) would provide a deeper insight into the evolutionary consequences of the hybridization, as the example of Darwin's finches has shown (Lamichhaney et al., Reference Lamichhaney, Berglund, Wang, Almén and Webster2016). However, to obtain DNA of sufficient quality and in the necessary quantities would necessitate catching many more cranes to obtain tissue and blood samples.
Whilst acknowledging that the proportion of apparent hybrids identifiable by observers is likely to be an order of magnitude lower than are actually present in the crane population, both visual observation and analysis of shed feathers could provide valuable collateral data to monitor the trajectory of Australian crane introgression.
Acknowledgements
We acknowledge the assistance of many people who have made this work possible, including Elinor Scambler and John Grant, who shared their insights on cranes on the Atherton Tablelands and Gulf Plains; Inka Veltheim and Adam Miller in relation to brolgas in Victoria; Silke Fregin, who managed our large number of samples and laboratory work at the University of Greifswald; Annabelle Olsson, who facilitated veterinary health clearance for our samples to be sent to Germany; Harry, Ruairidh and Bronwen Nevard, and Dominic and Vera von Schwertzell, who assisted with sample collection; Hans Rehme of Lemgo, who provided access to his collection of cranes; Tom and Tanya Arnold (Miranda Downs cattle station), the Waddell family (Woodleigh cattle station), Terry Trantor, Nick Reynolds, the Godfrey family and Fay Moller-Nielsen, who all provided access to their farms; and Angela Freeman of the North Queensland Wildlife Trust, who provided funding for laboratory costs.
Author contributions
Conception of research, fieldwork, sample collection, data analysis, writing: TDN; sample collection, supervision of laboratory work, genetic analysis, writing: MH; first identified the sarolga, facilitation of research, writing: GA; GIS-based mapping, data analysis, writing: IL; institutional supervision, facilitation of research, data analysis, writing: STG.
Conflicts of interest
None.
Ethical standards
The research was carried out in accordance with Charles Darwin University Animal Ethics Committee's approval A13019 and Queensland Department of Environment and Heritage Protection Scientific Purposes Permit WISP13984714. Export of samples to Greifswald University was undertaken under Australian Customs permit ACLTEM47 K and CITES permit PWS2014-AU-001240. The authors abided by the Oryx Code of Conduct for authors.


