


Obesity represents a global public health problem(1,Reference Ng, Fleming and Robinson2) and an increasing proportion of women start pregnancy with excess weight or obesity(Reference Thompson3). Maternal obesity has an important role in the development of child obesity(Reference Thompson3), being observed in the first 1000 d of life – period from conception until 2 years of age(Reference Baidal, Locks and Cheng4). Simultaneously, child obesity has reached epidemic levels in developed and developing countries(Reference Sahoo, Sahoo and Choudhury5,Reference Abarca-Gómez, Abdeen and Hamid6) , taking into account that most of the excess weight in childhood is gained in the preschool years(Reference Lanigan7).
In view of obesity prevention, the WHO published a guideline suggesting reduction in sugar intake, recommending that it does not exceed 10 %, ideally 5 %, of the consumption of total daily calories(8). In order to prevent future cardiovascular risk, the American Heart Association also published a guideline suggesting the non-exposure to added sugar in the first 2 years of life(Reference Vos, Kaar and Welsh9).
Sugary drinks, such as sodas and fruit juices, are the main source of discretionary calories in diet (the excess calories ingested after to meet recommended nutrient intakes)(Reference Johnson, Appel and Brands10), which consumption has been consistently associated with overweight, even in children(Reference Malik, Pan and Willett11–Reference Luger, Lafontan and Bes-Rastrollo14). Although the early exposure to sugars is a cause of serious concern, few studies have been published focusing on sugar-sweetened beverages consumption in the first 1000 d of life(Reference Watt, Appel and Roberts15–Reference Pan, Li and Park17). The first 1000 d includes gestation and the child’s first 2 years, period that there is more phenotypic plasticity, when environmental influences may acts increasing the risk of obesity and non-communicable diseases in future(Reference Barker, Eriksson and Forsen18). The sugar-sweetened beverages consumption during pregnancy was associated with greater adiposity in preschool(Reference Watt, Appel and Roberts15) and middle school children(Reference Gillman, Rifas-Shiman and Fernandez-Barres16). Furthermore, the higher sugar-sweetened beverages intake during gestational period has shown linked to harmful effect in offspring health, such as risk of atopy and asthma(Reference Nascimento, Ribeiro and Batista19–Reference Wright, Dono and Brownbill21), while the children intake of sugar-sweetened beverages in the first year of life was associated with higher adiposity levels at 6 years of age(Reference Pan, Li and Park17) and to asthma traits in children(Reference Padilha, Vianna and Vale22).
The mechanisms connecting the sugary drinks intake during the pregnancy and early exposures to offspring for products with high sugar content may be linked to social vulnerability(Reference De Coen, Vansteelandt and Maes23,Reference Pettigrew, Jongenelis and Chapman24) , paternal attitudes and unhealthy dietary behaviours(Reference Woo Baidal, Morel and Nichols25). As physiological mechanisms, the higher gestational exposure to sugary drinks may result in epigenetic changes and fetal programming with effects along life course(Reference Mateo-Fernández, Merinas-Amo and Moreno-Millán26,Reference de Boo and Harding27) . Furthermore, the hyperinsulinaemia in gestational period may result in childhood obesity(Reference Reichetzeder, Dwi Putra and Li28,Reference Jen, Erler and Tielemans29) .
Structural equation modelling allows to test a complex hypothetical causal structure(Reference Kline30). Exposures from the perinatal period, such as sugar consumption and maternal obesity, may increase future risk to early exposure to sugar in offspring and higher obesity risk in their children; thus, modelling direct and indirect pathways linking those perinatal factors may add knowledge that will allow to better analyse this multicausal structure around the first 1000 d of life.
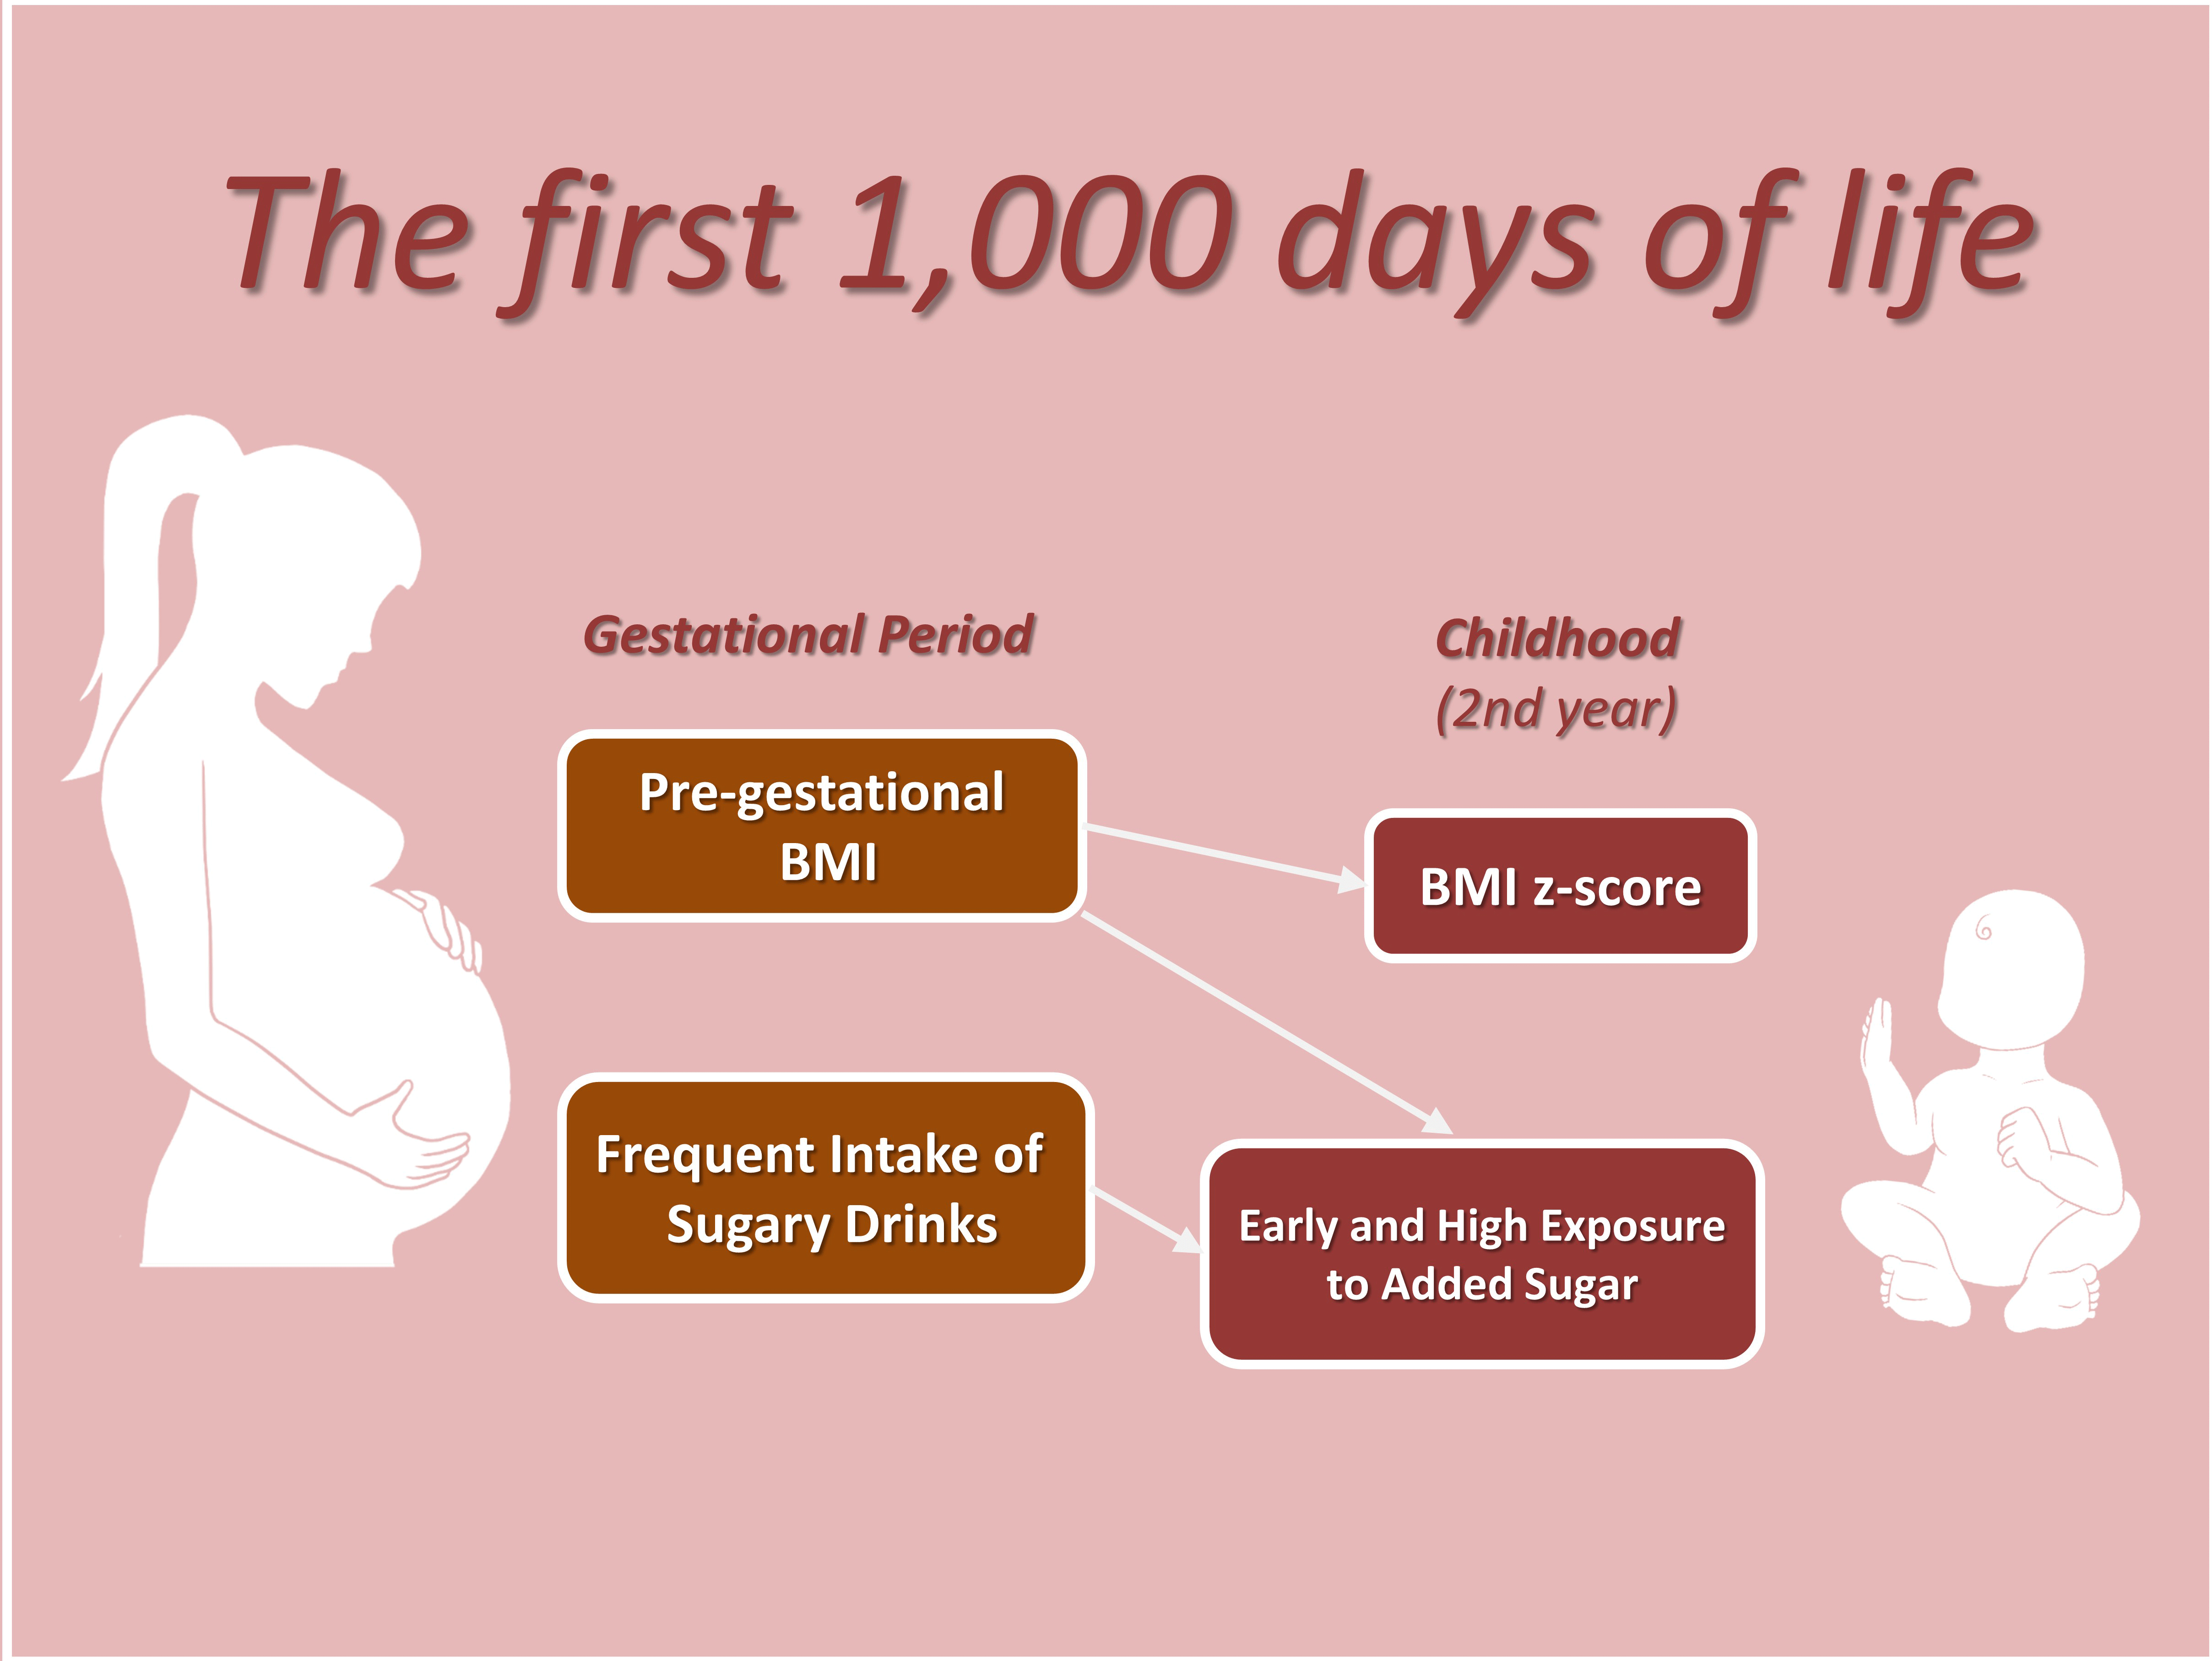
In this context, the current study modelled the pathways linking sugary drinks consumption during pregnancy and maternal pre-gestational BMI with the child’s exposure to high sugar content products, as well as the child’s growth in the second year of life.
Method
Here, the data from the prospective cohort of pregnant women BRISA in the city of São Luís, Brazil were used. The pregnant women were invited to participate in the study in prenatal services and in public and private hospitals from February 2010 to June 2011(Reference da Silva, Simões and Barbieri31).
At baseline, pregnant women who were held prenatal care from 22nd and 25th gestational week were included (n 1447). In the occasion of birth, from May 2010 to November 2011, puerperal women (n 1382) were interviewed again during the first 24 h after delivery (first follow-up). Mother and children (n 1151) were evaluated between September 2011 and March 2013 (second follow-up). The study sample was composed of 1136 mother–child pairs, with the children up to 24 months of age (Fig. 1).

Fig. 1 Flow diagram of the BRISA cohort, São Luís, Brazil
The following information was used from pregnant women at baseline: age (years), monthly family income (multiples of minimum wage), education (years of study), occupation of the head of the household, economic class according to the Brazilian Criteria of Economic Classification (A/B, C, D/E), ranging from E (lowest economic class) to A (highest economic class)(32), self-reported pre-gestational weight (kg), height (m) measured with a portable stadiometer (Alturexata®)(Reference Lohman, Roche and Martorell33,34) ; subsequently, the pre-gestational BMI(34) and frequency of consumption of soft drinks and chocolate beverages during current pregnancy were calculated.
The frequency of consumption of sugary drinks (soft drinks and chocolate beverages), from the 22nd to 25th gestational weeks, was calculated using the following questions from the prenatal questionnaire: ‘How many days per week do you drink soft drinks?’, ‘How many times per day do you drink soft drinks?’, ‘How many days per week do you drink chocolate beverages?’, ‘How many times per day do you drink chocolate beverages?’ and the weekly consumption (zero to seven times per week) multiplied by the daily consumption (one to six times per day). Finally, the consumption frequencies for each sugary drink were added and this variable was analysed in categories: none, until 1 time per day, until to 2 times per day and 3 or more times per day.
Previous study using São Luis BRISA cohort data showed an association between this higher frequency of soft drink consumption in pregnancy with maternal periodontal diseases(Reference Menezes, Ribeiro and Alves35) and with asthma in offspring(Reference Nascimento, Ribeiro and Batista19).
A second follow-up of the cohort was conducted during the second year of life of the children (13–24 months old). From the second follow-up, the following information was used about the children: age (months), sex, weight (kg) measured with digital scale (Tanita®)(Reference Jen, Erler and Tielemans29), length/height (cm) measured with a portable stadiometer (Alturexata®)(Reference Jen, Erler and Tielemans29), exclusive breast-feeding treated as a dichotomous categorical variable: < 6 months or ≥ 6 months, the BMI in z-score(36), a continuous numerical variable and data from the food consumption through the application of 24-h food recalls reported for mother.
The nutritional composition of the child’ diet in the second cohort follow-up was calculated with the Software Virtual Nutri Plus® (2010 version). Details from the data collection of food consumption in the second year follow-up of BRISA cohort are published in Padilha et al.(Reference Padilha, França and da Conceição37). The percentage of calories from most frequently used industrialised products with high sugar content by children was derived from non-dairy beverages (soft drinks, industrialised juices, nectars and reconstituted powdered juices); dairy sugary products (ready-to-drink chocolate beverages, ice creams, popsicles, creamy beverages, yogurts and foods of the Petit Suisse type) and industrialised sweetened puree baby food. Thus, the calories from products with added sugar as a percentage of the total daily energy intake were analysed in theoretical model by structural equation modelling. Subsequently, solid foods (cakes and cookies) were also tested replacing those products with a high sugar content and were analysed by structural equation modelling (data not shown in the tables).
Proposed theoretical model
The proposed theoretical model was constructed to analyse the association between frequency of sugary drinks consumption in pregnancy and maternal pre-gestational BMI to the outcomes of early child’s exposure to products with a high sugar content and BMI z-score in the second year of life (Fig. 2). Socio-economic status (SES) was assumed as the more distal determinant (exogenous variable), exerting its effects on all other variables in model. Maternal age may influence maternal weight, the choice and supply of food for herself and her child, and the child BMI. Higher maternal exposure to sugary drinks may be related to higher maternal BMI and may link the pathways to child’s exposure to products with a high sugar content and higher child’s BMI in the second year of life. Higher maternal BMI may be associated with early child’s exposure to products with a high sugar content and to higher child’s BMI in the second year of life. The higher maternal BMI may be associated with a shorter duration of exclusive breast-feeding, while exclusive breast-feeding may have a protective effect on the child’s BMI.

Fig. 2 Proposed theoretical model to evaluate the association between the consumption of sugary drinks in pregnancy and maternal pre-gestational BMI to early child’s exposure to products with high sugar content and to BMI z-score in the second year of life in the BRISA cohort. São Luís-MA, 2010. ![]() , Latent variables;
, Latent variables; ![]() , effect indicators of the latent variable;
, effect indicators of the latent variable; ![]() , observed variables
, observed variables
Statistical methods
Structural equation modelling is an epidemiological tool that allows to test direct and indirect paths between multiple variables, observed, and also latent variables. Latent variables are derived from their effect indicator variables, representing the shared variance among them, estimating effects free from the measurement error bias(Reference Kline30).
The SES was latent variable family deduced through the following indicator variables collected at prenatal period: a) mother’s education, b) occupation of the head of the family, c) monthly household income relative to the Brazilian national minimum wage in 2010 and d) economic class. This variable has already been analysed in a previous study by BRISA prenatal cohort(Reference Ribeiro, da Silva and de Britto38).
The initial statistical analyses and construction of the weighting variable were performed using the Stata® 14.0 software, and the Mplus® 7.0 software was used for structural equation modelling.
For the good model adjustment, the following estimates were considered: a) P > 0·05 and an upper limit of the CI of 90 % < 0·08 for the root mean square error of approximation, b) comparative fit index and Tucker–Lewis index > 0·95 and c) value < 1 for the weighted least squares mean and variance adjusted. If these parameters were not adequate to the originally proposed model adjustment, the modindices command would be used in the structural equation modelling(Reference Kline30) to identify new pathways which if included may result in a better fitting model. The command modindices was used to calculate the modification indices (higher than 10 values) and thus to identify new paths that could improve the model fit(Reference Byrne39). The total (the sum of direct and indirect effects), direct (not mediated) and indirect (through the mediator) effects were estimated, adopting effect criterion if P < 0·05(Reference Kline30).
In order to minimise the possibility of selection bias from the losses of the sample and to increase the external validity of the study, the analysis was weighted by the inverse probability of participation, comparing data of the mothers who participated in the follow-up with those of the mothers who did not participate through the χ 2 test. Fewer children who were born at an earlier gestational age attended the second follow-up visit. On this basis, the sample was weighted by calculating the probability of a children being seen at the second follow-up visit as a function of gestational age using a logistic regression model. The inverse of this probability of selection was then calculated and this variable was used to weight the sem estimates.
Results
The average of the pre-gestational BMI was 23·1 kg/m2 (sd 4·1) and 23·6 % of the pregnant women presented excess weight. The frequency of sugary drinks consumption during pregnancy 58·0 % had sugary drinks intake at least once a day, 18·7 % until to 2 times per day and 8·8 % three or more times a day, the average age of the mothers was 26·1 (sd 5·6) years and 77·2 % of the mothers studied for 9–11 years. In 40·5 % of the cases, the head of the family had a manual semi-specialised occupation, 46·0 % of the mothers belonged to families with average monthly income of 1 to < 3 minimum wages and approximately 65·6 % of them belonged to class economic C (Table 1).
Table 1 Socio-demographic, economic and nutritional characteristics of pregnant women in the BRISA prenatal cohort, São Luís – MA, 2010–2013 (n 1136)

* Values unknown or not informed.
† Monthly family income based on Brazilian national minimum wage (approximately US$ 290.00 in 2010).
‡ Economic class according to the Brazilian Criteria of Economic Classification, categorised in A/B, C and D/E (BRASIL, 2008).
Among the children, 54·0 % were exclusively breastfed for 6 months, the average of the z-score of BMI for age was 0·6 kg/m² (sd 1·3) (Table 2) and more than half of the children (54·8 %) with an average age of 15·9 (sd 2·1) months was already exposed to products with a high sugar content. Among them, 37·0 % consumed more than 5·0 % of total calories from the sugar that is present in those products in the first 1000 d of life (Table 3).
Table 2 Characteristics of children at second follow-up in the BRISA prenatal cohort, Sao Luis – MA, 2010–2013 (n 1136)

* Values unknown or not informed.
† z-score of BMI for age (reference: WHO, 2006).
Table 3 Consumption of products with a high sugar content data of the children. Mean, sd, median and percentiles. BRISA prenatal cohort, São Luís, Brazil, 2010–2013

* Percentage of daily calories from added sugar.
† Total energy of sugars.
The latent variable SES showed a good fit, with all of the indicators with factorial loads above 0·50 and with significant P-value (P < 0·001). Similarly, the final model analysed in structural equation modelling showed a good fit for all of the indexes considered (root mean square error of approximation: 0·023, 90 % CI 0·000, 0·040, P-value root mean square error of approximation = 0·998, comparative fit index: 0·988, Tucker–Lewis index: 0·976 and weighted root mean square residual: 0·597) (Table 4). Suggestions of modification for this model were not theoretically plausible; thus, the analysis of the model proceeded as originally proposed.
Table 4 Indexes of expected and found model adjustments. BRISA cohort, São Luís – MA, 2010–2013

* Expected index values for a good fit of the model.
† Final model analysed by structural equation modelling.
Higher values for the SES explained the higher maternal age at pregnancy (standardised coefficient (SC) = 0·111; P = 0·012) and indirect association of protection of the SES for the higher frequency of consumption of sugary drinks during pregnancy via the mother’s older age (SC = -0·015; P = 0·037) (Table 5).
Table 5 Standardised coefficient, SE and P-value of total and direct effects for the indicator variables. São Luís – MA, 2010–2013

SC, standardised coefficient.
* Latent variable of prenatal socio-economic status.
† Frequency of consumption sugary drinks in pregnancy (soft drinks and chocolate beverages).
‡ Pre-gestational BMI.
§ z-score of BMI for age.
|| Percentage of daily calories from added sugar (products with a high sugar content).
¶ Indirect association of protection of the SES for the higher frequency of consumption of sugary drinks during pregnancy via the mother’s older age.
** Indirect association was also observed for the increase in z-score of BMI in the child through a higher pre-gestational BMI.
The mother’s older age was associated with an increase in pre-gestational BMI (SC = 0·260; P < 0·001), although older age in pregnancy has a direct association of protection for excess weight in the second year (SC = –0·090; P = 0·021) (Table 5). An indirect association was also observed for the increase in z-score of BMI in the child through a higher pre-gestational BMI (SC = 0·030; P = 0·008) (Table 5).
The higher pre-gestational BMI (SC = 0·100; P = 0·008) and the higher frequency of sugary drinks consumption during pregnancy (SC = 0·134; P < 0·001) resulted in higher percentage of intake of calories from products with high sugar content at the second year of life, revealing an obesogenic environment in the first 1000 d of life (Table 5).
The higher maternal BMI was not associated with a shorter duration of exclusive breast-feeding (SC = –0·040; P = 0·438), nor exclusive breast-feeding had protective effect on the child’s BMI (SC = –0·080; P = 0·095) (data not shown in the table). The higher percentage of calories from products with high sugar content by the children did not result in excess weight in the second year of life.
Our findings showed that the higher pre-gestational BMI were associated to the higher z-score BMI in the offspring (SC = 0·103; P = 0·006) (Table 5).
Mother’s sugary drinks consumption was also associated with higher exposure to solid foods containing sugar (SC = 0·132; P < 0·001). However, maternal obesity was not associated with higher exposure to solid foods containing sugar (SC = 0·003; P = 0·715) (data not shown in the tables).
Discussion
In the present study, the higher pre-gestational BMI and the higher frequency of sugary drinks consumption during pregnancy resulted in higher percentage of intake of calories from added sugar in the second year of life, revealing behavioural and metabolic risk factors in the first 1000 d of life.
More than half of the children (54·8 %) with an average age of 15·9 (sd 2·1) months was already exposed to industrialised products with a high sugar content, while according to recommendations from the American Heart Association children under 2 years should avoid consuming any added sugar(Reference Vos, Kaar and Welsh9). Furthermore, the average consumption of calories from sugar in relation to total calories was 7·4 %, which is considered high, since it is above the 5 % recommended as ideal for the prevention of obesity according to the WHO(8). In addition, 37·0 % of the sample exceeded the 5 % of the total calories coming only from products with a high sugar content, with even higher risk of obesity in the future(8).
The findings that the higher pre-gestational BMI explains the higher consumption of calories from added sugar by the offspring reveal the role of environmental factors in obesity that are already present in the first 1000 d of life. These data support the findings of a previous study, showing that children of obese mother have an increased risk for obesogenic eating practices in the beginning of life(Reference Thompson3).
The higher frequency of sugary drinks consumption during gestation resulted in higher percentage of intake of calories from products with high sugar content by the offspring (SC = 0·134; P < 0·001), reinforcing again the role of behavioural and environmental factors in obesity risk. The children’s eating preferences are shaped by a combination of genetic and environmental factors or both(Reference Scaglioni, Arrizza and Vecchi40–Reference Kral and Rauh42), showing that mothers perform an important role in the eating practices of their children(Reference Scaglioni, Arrizza and Vecchi40,Reference Anzman, Rollins and Birch41) . Maternal consumption of sugary drinks after pregnancy could be an indicator of the child’s early exposure to products with high sugar content, however, unfortunately these data were not assessed in BRISA Cohort.
The higher percentage of sugar consumption through added sugar by the children did not result in excess weight in the second year of life. This finding is different from the expected, since previous studies showed association of early exposures to sugar-sweetened beverages with excess weight in childhood(Reference DeBoer, Scharf and Demmer43,Reference Shao, Tao and Ni44) . Children exposed to sugar-sweetened beverages at 2 years of age had prospectively an increase in BMI in the two following years(Reference DeBoer, Scharf and Demmer43). Early exposure to sugar-sweetened beverages increased the risk of obesity at 6 years of age, being a risk 92 % higher than the non-exposure when the introduction of beverages occurred before 6 months of age(Reference Pan, Li and Park17). Therefore, it is possible that the effect of added sugar consumption on excess weight is observed later in life, since systematic reviews show consistent association between sugar-sweetened beverages consumption and excess weight, however, in children who are older than in those in the present study(Reference Malik, Pan and Willett11–Reference Luger, Lafontan and Bes-Rastrollo14).
The average proportion of calories derived from added sugars consumed by the children was higher than 5 % that has been recommended by the WHO for the prevention of obesity.(8) The American Heart Association also recommends to avoid consumption of added sugars by children up to 2 years to reduce cardiovascular risk in future(Reference Vos, Kaar and Welsh9).
Our findings that the higher pre-gestational BMI was associated with the higher BMI z-score in the offspring validate the previous data that showed pre-gestational obesity as a risk factor for child obesity in the future(Reference Shao, Tao and Ni44,Reference Li, Liu and Guo45) . The influence of pre-gestational excess weight in the development of childhood obesity can reveal itself through an interaction of genetic, epigenetic and environmental factors(Reference Kakinami, Barnett and Séguin46–Reference Rooney and Ozanne48). There is evidence of a strong genetic influence in the appetite of children, but the environment also has an important role in shaping the eating behaviours in childhood(Reference Scaglioni, Arrizza and Vecchi40). This fact could be especially relevant when taking into account the taste of sugar(Reference Avena, Rada and Hoebel49,Reference Westwater, Fletcher and Ziauddeen50) , which can result in compulsive eating behaviours(Reference Kakinami, Barnett and Séguin46).
Higher values for the SES were associated here with the higher consumption of sugary drinks during pregnancy. The data contrast with previous studies, in which lower SES was associated with higher consumption of soft drinks in European residences(Reference Naska, Bountziouka and Trichopoulou51) and among Hispanic pregnant women from low-income households in the USA(Reference Watt, Appel and Roberts15). The different findings from our study could be explained by the increase in the soft drinks consumption that is still occurring in populations in low- or medium-income countries(Reference Monteiro, Levy and Claro52). In Brazil, the consumption of these beverages is still increasing(Reference Levy, Claro and Mondini53), especially among higher income groups(Reference Bielemann, Motta and Minten54).
The increased added sugar consumption by industrialised products has resulted in the proposal of regulatory measures, such as taxation, warning messages in labels of products with high sugar content and public policies to fight obesity(Reference Jaime, Delmuè and Campello55). The data in the present study are even more concerning, since the children’s consumption in the second year of life was high according to the WHO guidelines for obesity prevention(8). Regulatory policies for sugary drinks could also benefit pregnant women, considering that the intake of these beverages during pregnancy is also concerning, since it could result in pre-eclampsia(Reference Clausen, Slott and Solvoll56,Reference Borgen, Aamodt and Harsem57) and preterm birth(Reference Englund-Ögge, Brantsæter and Haugen58,Reference Petherick, Goran and Wright59) .
As limitations of the study, it is important to emphasise the use of convenience sampling in the prenatal due to the impossibility of obtaining a random sample that is representative of the population of pregnant women in São Luís, Brazil. The representativity of the sample of this BRISA prenatal cohort was already compared with the populational base sample of the BRISA birth cohort performed during the same period in the city of São Luís; merely, the intermediate categories of mother’s education (5–8 years and 9–11 years of study) were greater in the present sample, while the frequencies of the other variables were similar, reinforcing the external validity of our data(Reference Nascimento, Ribeiro and Batista19). Yet, in this research only the frequency of sugary drinks consumption during the pregnancy was available in the questionnaire applied in gestational period. Furthermore, the consumption variables had missing data; however, Mplus software imputes values for missing based on the variables that preceded it in the path analysis, using frequency analysis and Bayesian analysis(Reference Muthén and Muthén60).
As far as the strengths of the study, we highlight the use of data from a prospective cohort of pregnant women, which allowed for the observation of the sample in two moments: during pregnancy and the child’s second year of life. Also, the use of structural equation modelling allowed the analysis of total, direct and indirect pathways between the exposure to products with high sugar content and excess weight around the first 1000 d of life.
Finally, the higher pre-gestational BMI and higher frequency of sugary drinks consumption during gestation were identified in the current study as the pathways that result in early (before to 2 years) and high exposure to added sugar in offspring, reinforcing the importance of the recommendation to avoid the consumption of these products in the first 1000 d of life. Strategies to promote adequate and healthy eating habits must be directed to pregnant women and to the families of those children, sensibilising them to the adverse effects of added sugar consumption on people’s health in a transgenerational way.
Acknowledgements
Acknowledgements: Not applicable. Financial support: Maranhão State Research and Scientific and Technological Development Foundation (FAPEMA), São Paulo State Research Foundation (FAPESP), and National Council for Scientific and Technological Development (CNPq) and the Coordination for the Improvement of Higher Education Personnel (CAPES), ‘Finance Code 001’. Conflict of interest: No competing financial interests exist. Authorship: Contributions of the authors: D.A.S.P., J.X.P.T.N., L.L.P., S.I.O.C., A.K.T.C.F., V.M.F.S., R.F.L.B., M.A.B. and C.C.C.R. Analysed and interpreted data: D.A.S.P., J.X.P.T.N., L.L.P. and C.C.C.R. Elaborated the manuscript: D.A.S.P., J.X.P.T.N., L.L.P., S.I.O.C., A.K.T.C.F., V.M.F.S., R.F.L.B., M.A.B. and C.C.C.R. Critical reading of the manuscript and final approval of the version to be published: D.A.S.P., J.X.P.T.N., L.L.P., S.I.O.C., A.K.T.C.F., V.M.F.S., R.F.L.B., M.A.B. and C.C.C.R. Ethics of human subject participation: ‘This study was conducted according to the guidelines laid down in the Declaration of Helsinki and all procedures involving research study participants were approved by the Ethics Committee from the Hospital of Federal University of Maranhão’. Written informed consent was obtained from all subjects/patients.


