


A trend towards increasing dietary fat intake has been noted worldwide. The fat:energy ratio is above the minimum recommended value of 15 % in some developed countries( 1 , Reference Honors, Harnack and Zhou 2 ). High fat contributes to the increasing prevalence of obesity. In America, approximately 70 % of people aged 65 years or older are overweight (BMI, kg/m2≥25) or obese (BMI≥30) as per the 2007–2012 National Health and Nutrition Examination Survey (NHANES)( Reference June, Eva Erber and Zhaohui 3 ). Increased fat intake is associated with metabolic risk factors( Reference Gadgil, Anderson and Kandula 4 ). Particularly in the elderly population, greater attention to fat intake is warranted. Elderly people differ from younger populations with regard to metabolism and fat distribution. Older individuals have more stored body fat and less lean mass compared with young adults( Reference Cree, Newcomer and Katsanos 5 ). Moreover, because of their increased insulin resistance, elderly people have a greater proportion of body fat in the intrahepatic, intramuscular and intra-abdominal compartments( Reference Cree, Newcomer and Katsanos 5 ). These changes lead to poor metabolic outcomes for older people.
However, a low-fat diet may not always be beneficial for health( Reference Howard, Van Horn and Hsia 6 ). Previous evidence has suggested that some types of fat, such as fat from tree nuts and extra-virgin olive oil, reduce cardiovascular events and risk factors, atrial fibrillation, peripheral artery disease, type 2 diabetes and the metabolic syndrome( Reference Schwingshackl and Hoffmann 7 ). Although there is some controversy surrounding the effects of fat( Reference Schwab, Lauritzen and Tholstrup 8 , Reference Miyake, Sasaki and Yokoyama 9 ), recent studies have suggested that diets that are high in certain fats, including some MUFA and PUFA, and that contain adequate amounts of essential fatty acids are associated with reduced risk for CVD, metabolic diseases, cancer and depression( Reference Sanchez-Villegas and Martínez-González 10 , Reference Liu, Green and John Mann 11 ). These findings of the benefits of fat raised questions about the effects of the amount of fat intake on health outcomes( Reference Sanchez-Villegas and Martínez-González 10 ).
Hearing discomfort is one of the most common degenerative disorders among elderly people and is generally irreversible. Several studies have focused on modifiable factors associated with hearing discomfort, particularly nutritional factors. Previous studies have demonstrated that a diet rich in folate, fibre and vitamins A, E and C is beneficial for alleviating age-related hearing discomfort( Reference Gopinath, Flood and Rochtchina 12 – Reference Kang, Choi and Kim 14 ). Generally, a high-fat diet is associated with hearing discomfort. Many studies have demonstrated that increased dietary intake of fats, particularly cholesterol and SFA, accelerates the development of age-related hearing discomfort( Reference Gopinath, Flood and Teber 15 , Reference Evans, Tonini and Shope 16 ). However, most of these studies did not consider the appropriate proportional intake of fat and other nutritional factors and were based on populations with high dietary fat intakes. Previous studies reported conflicting results concerning the effects of hypercholesterolaemia on hearing. Some studies found that hyperlipidaemia was an aetiological factor in hearing discomfort( Reference Gopinath, Flood and Teber 15 , Reference Evans, Tonini and Shope 16 ); however, other studies suggested no difference between the lipid profiles of the hearing discomfort and normal-hearing groups. These studies reported that hearing thresholds were significantly enhanced in the high-cholesterol group( Reference Jones and Davis 17 , Reference Jones and Davis 18 ). In addition, the dietary intake of some types of fats, such as n-3 PUFA, is associated with hearing preservation( Reference Gopinath, Flood and Rochtchina 19 ).
In the adult Korean population, the proportion of dietary fat has also significantly increased from 18·5 % in 1998 to 20·3 % in 2012, which reflects the increasing trend towards westernised nutritional intakes( Reference Kwon and Ju 20 ). Although a trend towards increasing fat intake as a result of the rapidly increasing consumption of westernised foods, such as fried chicken, pizza and hamburgers, has been observed, a rice-based diet is predominant in the Korean population, particularly among the elderly. Given this dietary characteristic, fat intake of the Korean elderly population may be reduced compared with the dietary reference intake level( Reference Paik 21 ). The proportions of dietary carbohydrates and protein have remained relatively stable, between 65 and 67 % and approximately 15 %, respectively, from 1998 through to 2012( Reference Kwon and Ju 20 ).
To date, little information regarding the effect of the proportional intakes of fat, carbohydrates and protein on the hearing abilities of Asian populations is available. In this study, we investigated the relationships between nutritional intake and hearing in the elderly. The primary outcome of the present study was to evaluate the relation between total energy/protein/fat/carbohydrate intake and the presence of hearing discomfort. We also analysed the association of the protein/fat/carbohydrate intakes with hearing discomfort at specific frequencies (500, 1000, 3000, 4000 and 6000 Hz). To exclude other factors associated with hearing, we applied a multiple logistic regression analysis with complex sampling. Moreover, to exclude the influence of total energy intake, we calculated the proportional intakes of fat and carbohydrate compared with the total energy intake. The protein and total energy intakes were compared with the age- and sex-matched recommended dietary intake for the Korean population. These standardisations enabled us to further exclude the confounding effects of age, sex, BMI, income, smoking status and the underlying disease status.
Methods
Study population and data collection
This study was approved by the institutional review board of the Korean Centers for Disease Control and Prevention. Written informed consent was obtained from all participants before commencement of the study.
This cross-sectional study used data from the Korean National Health and Nutrition Examination Survey (KNHANES) and included the entire national population. The survey included a health interview, a nutritional survey and physical examinations. Statistical methods were applied on the basis of the sampling design using adjusted weighted values. The KNHANES data collected by the Centers for Disease Control and Prevention of Korea from 2009 to 2012 were analysed. Each year, 192 districts were selected by a panel. A total of twenty households from each selected district were identified to obtain a sample that was reflective of the entire Korean population. The surveys were obtained from the civilian, non-institutionalised South Korean population using a stratified, multistage, clustered sampling method based on the national census data. The sample was weighted by statisticians, who performed post-stratification analyses and accounted for the non-response rate and for extreme values. Among the selected candidate population, 80·8 % of individuals participated in the KNHANES from 2009 to 2012.
As a result, a total 36 067 people were sampled; of these, the following participants were excluded from this study: participants aged under 60 years or over 80 years (27 958 participants); participants who did not undergo audiometric testing or a physical examination or who had an abnormal tympanic membrane (TM; 3020 participants); participants who had not completed the nutritional survey (331 participants); participants who had incomplete data on BMI (kg/m2), income level and smoking status; and participants who had a history of hypertension or hyperlipidaemia, and the presence of diabetes mellitus (143 participants). Finally, 4615 participants (2048 males and 2567 females) were included in this study (Fig. 1). To focus on the elderly population, the survey participants ranged in age from 60 to 80 years. To avoid survival effects, we excluded subjects who were ≥80 years of age.
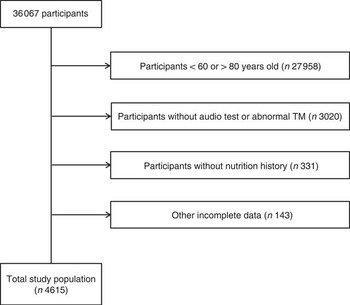
Fig. 1 A schematic illustration of participant selection in the present study. Among a total of 36 067 participants, participants aged 60 to 80 years who underwent audiological testing, showed normal tympanic membrane (TM) findings and provided a nutritional history were selected for this study. The data on the 4615 participants from whom complete data were obtained were analysed.
Survey
Food intake data were obtained by trained staff using the complete 24 h recall method. The answers obtained on certain days, such as holidays or weekends, were not included. The total energy (kJ/d (kcal/d)) and total protein (g/d) intake were calculated by referencing the nutrient contents of foods described in the Korean Food Composition Table( 22 ). The intake amount was compared with the recommended intakes for Korean people( 23 ). Therefore, the proportional total energy and total protein intakes of each participant were calculated by adjusting for age and sex. For example, the proportion of total intake energy (%)=total energy intake/age- and sex-matched recommended total energy intake. Unlike for other nutritional components, the balance of proteins, fats and carbohydrates is the most important aspect of fat and carbohydrate intake measurements( 23 ). Thus, fat and carbohydrate intake were measured as the proportion of the total energy intake rather than the proportion of age- and sex-matched recommended intake( 24 ). The fat and carbohydrate intakes were measured using the following methods: fat energy intake/total energy intake (%) and carbohydrate energy intake/total energy intake (%). According to each nutrient intake compared with the average values, the subjects were divided into high and low groups (Table 1). The reference values for total energy, protein, fat and carbohydrate distributions were 100, 100, 12, 74 and 25, respectively.
Table 1 General characteristics of participantsFootnote * (Means and standard deviations; numbers and percentages)
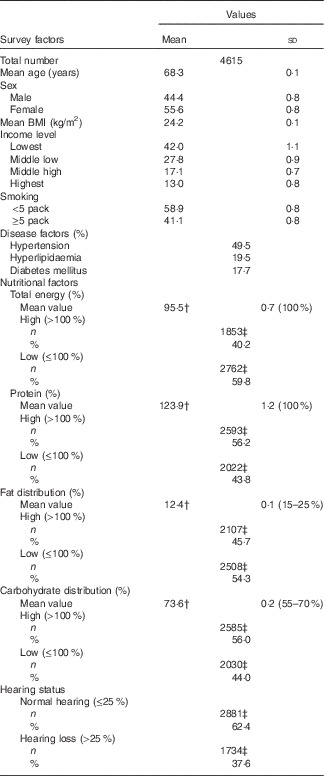
* Mean values and rates of each factor were adjusted with recommended weighted values.
† Dietary reference of the recommended intakes for Koreans (KDRI).
‡ Number of subjects per group.
In this study, trained otorhinolaryngologists examined the TM of all the participants using a 4 mm-diameter, 0°-angled rigid endoscope (Xion GmbH). Participants with an abnormal TM were excluded from this study. Pure-tone audiometry was performed in a soundproof booth using an automatic audiometer (SA 203; Entomed) to determine the air-conduction hearing thresholds at 500, 1000, 2000, 3000, 4000 and 6000 Hz in both ears. Hearing discomfort was defined as a hearing discomfort exceeding an average of 25 dB on pure-tone audiometry at 500, 1000, 2000, and 4000 Hz( Reference Mathers, Smith and Concha 25 ). If the right and left ear hearing thresholds differed, the worse hearing threshold was selected.
By dividing the household income by the square root of the number of household members, the monthly income was divided into four quartiles from top to bottom: lowest, low middle, upper middle and highest. Smoking status was divided into the two following categories: smoked less than five packs (100 cigarettes) in a lifetime and smoked five or more packs in a lifetime. Diagnoses of the possible comorbidities of hearing discomfort, including hypertension, hyperlipidaemia and diabetes mellitus, were documented using the questionnaire. The participants were considered positive for these comorbidities if they had been diagnosed by a medical doctor.
Statistical analysis
The general characteristics of the participants were calculated by adjusting the recommended weighted values based on the KNHANES data (Table 1).
The OR of each nutritional factor for the hearing discomfort was calculated. Simple logistic regression analysis with complex sampling (unadjusted) was performed. Multiple logistic regression analysis with complex sampling adjusted for age and sex was performed (model 1). Multiple logistic regression analysis with complex sampling adjusted for age, sex, BMI, income, smoking status and history of hypertension, hyperlipidaemia and diabetes mellitus was performed (model 2; Table 2).
Table 2 Odds ratios of nutritional factors for hearing discomfort (>25 dB) by multiple logistic regression analysis with complex sampling (Odds ratios and 95 % confidence intervals)
† Adjusted for age and sex.
‡ Adjusted for age, sex, BMI, income, smoking, history of hypertension and hyperlipidaemia, and diabetes mellitus.
* Significant at P<0·05.
The OR for the hearing thresholds (dB) at 500, 1000, 2000, 3000, 4000 and 6000 Hz were examined according to the fat and carbohydrate proportions of the total energy intake and protein intake, using multiple logistic regression analysis with complex sampling adjusted for age, sex, BMI, income, smoking status and history of hypertension, hyperlipidaemia and diabetes mellitus (Table 3).
Table 3 Odds ratios of the hearing discomfort (hearing threshold>25 dB hearing loss) at each 500, 1000, 2000, 3000, 4000 and 6000 Hz in high-intake groups for fat, protein and carbohydrate by multiple logistic regression analysis with complex samplingFootnote † (Odds ratios and 95 % confidence intervals)
† Analysis was adjusted for age, sex, BMI, income, smoking, history of hypertension and hyperlipidaemia, and diabetes mellitus.
* Significant at P<0·05.
Two-tailed analyses were conducted, and P values<0·05 were considered significant. In addition, 95 % CI was calculated. The weighted values recommended by the KNHANES were applied, and all of the results were stated as weighted values. The statistical analyses were performed using SPSS version 21.0 (IBM).
Results
The demographic and nutritional data on the total study population are summarised in Table 1. The mean age of the participants was 68·3 (sd 0·1) years, and their mean BMI (24·2 (sd 0·1) kg/m2) was within the normal range. Their mean fat (12·4 (sd 0·1) %) and total energy (73·6 (sd 0·2) %) intakes were lower than the recommended values (15–25 and 55–70 %, respectively). In contrast, their mean protein (123·9 (sd 1·2) %) and carbohydrate (73·6 (sd 0·2) %) intakes were higher than the recommended values (55–70 % for carbohydrates).
Multiple logistic regression analysis revealed an association between the mean hearing thresholds and the nutritional intake (Table 2). The fat intake was negatively correlated with the mean hearing thresholds; the unadjusted OR was 0·74 (95 % CI 0·64, 0·85, P<0·001). When adjusted for age and sex, the OR was 0·79 (95 % CI 0·68, 0·92, P=0·002), and the significance of the correlation was maintained even when the results were adjusted for all of the retrieved variables (OR 0·82, 95 % CI 0·71, 0·96, P=0·011; Table 2). In contrast, the carbohydrate intake exhibited a positive correlation with the mean hearing thresholds in model 1. The unadjusted OR for age and sex was 1·18 (95 % CI 1·00, 1·39, P=0·047); however, when adjusted for all of the retrieved variables, the association was NS.
The total energy intake exhibited a significant correlation with the mean hearing thresholds only in the unadjusted model (OR 0·85, 95 % CI 0·74, 0·97, P=0·034). The protein intake was significantly associated with the mean hearing thresholds in the unadjusted model (OR 0·72, 95 % CI 0·61, 0·85, P<0·001). When adjusted for other factors in the study, the OR was 0·81 (95 % CI 0·67, 0·96, P=0·017).
Next, we focused on fat, carbohydrate and protein intake and evaluated their contributions to the hearing thresholds at each frequency. Each nutrient intake was significantly associated with the hearing threshold at some of the measured frequencies (Table 3). High-fat intake exhibited statistically significant correlation with decreased hearing thresholds, with adjusted ORs in the range of 0·80 at 4000 Hz (95 % CI 0·67, 0·96, P=0·010). The carbohydrate intake was significantly correlated with the hearing thresholds at 3000 Hz (OR 1·20, 95 % CI 1·01, 1·42, P=0·034) and 4000 Hz (OR 1·26, 95 % CI 1·06, 1·52, P=0·11). The protein intake was significantly associated with the hearing threshold at 1000 Hz (OR 0·82, 95 % CI 0·70, 0·96, P=0·015).
Discussion
Our results indicate that low fat and protein intakes are correlated with hearing discomfort in the elderly Koreans. To our knowledge, this is the first report on low-fat intake and its effects on hearing. Moreover, our data were based on pure-tone audiometric findings, which were used to analyse the relationships between fat, carbohydrate and protein intake and the hearing thresholds at each frequency.
Although a high-fat diet can have harmful effects on health, such as increasing the risk for CVD and other metabolic syndromes, fat is essential for cellular membrane functions given its effects on lipid rafts; furthermore, fat regulates the metabolism of many fat-soluble vitamins, modulates ion-channel function and promotes brain development and function( Reference Kim, Fan and Barhoumi 26 , Reference Kim, Fan and Barhoumi 27 ). All of these fat-related functions are associated with hearing preservation. For example, vitamins A and E are associated with hearing preservation( Reference Kang, Choi and Kim 14 ). Because vitamins A and E are lipid soluble, insufficient fat intake may hinder their metabolism and function, consequently impairing hearing sensitivity.
In addition, adipose tissue functions as a complex endocrine organ and is a major source of numerous adipokines. Adiponectin is synthesised exclusively in adipose tissue; its synthesis is inhibited by obesity-induced insulin resistance and oxidative stress in adipose tissue( Reference Lu, Huang and Chang 28 ). A low adiponectin level is associated with hearing discomfort( Reference Hwang, Hsu and Liu 29 ). Therefore, we hypothesise that a low-fat diet that leads to insufficient adiponectin production may not be good for hearing. Body fat has several protective effects, such as providing a rich metabolic reserve, reducing the activation of the sympathetic nervous system and lowering the levels of circulating hazardous materials, such as natriuretic peptides( Reference Lavie, Milani and Ventura 30 ). These protective effects of body fat may also have beneficial effects on the auditory system.
Various types of fats are related to hearing preservation; however, the mechanisms have not been well defined. The PUFA HDL-cholesterol has beneficial effects on hearing preservation( Reference Gopinath, Flood and Rochtchina 19 ). Insufficient levels of PUFA are associated with neuropsychiatric diseases, such as major depression, bipolar disorder, schizophrenia, Alzheimer’s disease and attention-deficit hyperactivity disorder( Reference Liu, Green and John Mann 11 ). These psychiatric disorders are associated with hearing discomfort( Reference Li, Zhang and Hoffman 31 ). Eicosapentaenoic and docosahexaenoic acids have been reported to have a cardioprotective function( Reference Connor 32 ). CVD have been suggested to be associated with cochlear impairment in the elderly( Reference Torre, Cruickshanks and Klein 33 ). By reducing the vascular risk factors that impair the cochlear blood supply, these types of fats may have a role in hearing preservation. Although we did not analyse the intake of specific types of fat, the negative correlation between fat intake and the hearing thresholds could be explained by the sum of the above-mentioned beneficial functions of fat. Further studies to elucidate the effects of each type of fat on hearing are warranted.
In the current study, the carbohydrate intake (73·6 (sd 0·2) %) was somewhat increased compared with the recommended value, which is approximately 55–70 % depending on age and sex( 24 ). Although statistical significance was only obtained with model 1 (adjusted for age and sex) for the mean hearing threshold (Table 2) and at the specific frequencies of 3000 and 4000 Hz (Table 3), the detrimental effects of high carbohydrate intake on hearing observed in our study were comparable to that observed in previous studies, which suggest that hyperglycaemia can cause microvascular injuries that result in increased blood viscosity and embolic or thrombotic events in the vessels of the auditory system( Reference Fukui, Kitagawa and Nakamura 34 ). Previous studies showed that type 2 diabetes mellitus is related to hearing discomfort through angiopathy, neuropathy, oxidative stress and the deposition of advanced glycation end products( Reference Fukui, Kitagawa and Nakamura 34 ). In contrast, low-protein intake also exhibited a negative correlation with hearing discomfort based on mean hearing thresholds; however, only the hearing threshold at 1000 Hz exhibited a statistically significant correlation with protein intake. Some studies suggested that various types of peptides, such as insulin, orexin and leptin, played roles in hippocampal synaptic plasticity and enhancement of cognitive function( Reference Marmot 35 ). Moreover, an animal study revealed that insufficient protein intake enhanced ototoxic side effects( Reference Lautermann and Schacht 36 ). Therefore, it can be inferred that low-protein intake may have detrimental effects on neural function associated with auditory system.
There were some limitations in the present study. It is possible that the low-fat intakes observed in our sample were the consequence of other lifestyle risk factors, such as low socio-economic status (SES), unemployment and poor hygiene( Reference Fadel, Jolivalt and Reagan 37 , Reference Kumar, Dagli and Mathur 38 ). Collinearity potentially occurs between different dietary habits and residual confounding factors, including both nutritional and non-nutritional confounders. Thus, it is possible that low SES, not a low-fat intake, could be related to hearing discomfort. To exclude this possibility, we analysed several potential confounding factors, including age, sex, BMI, economic status as represented by income level, smoking status and a medical history of hypertension, hyperlipidaemia and diabetes mellitus. Moreover, if a low SES or poor nutritional supply caused the hearing discomfort observed in this study, other nutritional factors, such as protein or energy intakes, would also show relationships with hearing. However, in this study, the total energy and protein intakes were not related to the hearing thresholds. A significant correlation between total energy intake and the hearing thresholds was observed in the unadjusted model but did not remain after the model was adjusted for covariates. Because nutritional needs differ according to age, sex and other covariates, it was reasonable to adjust the nutritional intakes according to these covariates. Our results did not reveal better or worse hearing thresholds according to the total energy intake, implying that the amount of fat consumed was not important for hearing. The proportional dietary intake of fat may be the factor related to hearing discomfort. Because the participants had an average total energy intake that was lower than the recommended value, it is also possible that the negative effects of the excessively high proportion of fat intake were outweighed by the positive effects of the increased fat intake on hearing function.
This study was based on a cross-sectional epidemiological survey, and it has some limitations that prevent an explanation of the causal relationships between the nutritional intake and hearing discomfort in the elderly. The cross-sectional nature of the study precluded an investigation of the effect of nutritional factors on the progression of hearing discomfort over time. Moreover, a possible reverse causality issue could not be excluded. The low-fat intake of our study population might be attributed to the rice-based Korean food culture, which differs from that of western countries. Therefore, the impact of a low-fat intake in this study cannot be generalised to other populations with different dietary cultures. Because a survival bias could affect hearing outcomes, people older than 80 years of age were not included in this study. Although the fidelity of our data was ensured by using mass-population data based on the representative sampling of the KNHANES, selection bias remains possible in the present study. Finally, because this study was based on a survey that employed the complete 24 h recall method, some level of recall bias is inevitable.
Animal studies assessing the effects of low-fat diets and molecular biological techniques may be needed to elucidate the molecular mechanisms underlying the hearing-protective effects of dietary fats. Our findings provide clues regarding the potential mechanisms that underlie diet-related hearing discomfort and suggest possible strategies for preventing hearing discomfort through dietary modifications. Clinicians should evaluate patients’ nutritional intake, both to prevent the development of other metabolic or cardiovascular disorders and to potentially facilitate hearing preservation.
The current study revealed that low-fat and low-protein diets are associated with increased hearing thresholds in the elderly Koreans. Given that total energy intake was not associated with hearing discomfort, the amount of dietary fat or protein is not important for prevention of hearing discomfort in the elderly Koreans; rather, the proportion of each nutrient among the total energy intake is key for prevention.
Acknowledgements
The authors gratefully acknowledge survey participants and examiners of the Division of Chronic Disease Surveillance in Korea Centers for Disease Control & Prevention for participating in this survey and the dedicated work they provided.
This work was supported by a Research Grant funded by Hallym University Sacred Heart Hospital (HURF-2015-31).
H. G. C. designed the study. H. G. C. and S. S. performed statistical analysis. H. G. C. and S. Y. K. wrote the paper. All authors reviewed and approved the final article.
The authors have no conflicts of interest.


