


Introduction
Short-chain fatty acids (SCFA) are the major products of microbial fermentation of non-digested dietary substrates that reach the human large intestine. They are the main metabolites of microbial fermentation of dietary carbohydrates and fibre, while branched-chain fatty acids (BCFA) are additional products of protein metabolism (Smith and Macfarlane, Reference Smith and Macfarlane1998; Scott et al., Reference Scott, Gratz, Sheridan, Flint and Duncan2013; Yao et al., Reference Yao, Muir and Gibson2016). It has long been recognised that these acids have major impacts on the gut environment, on mucosal absorption and host physiology (Cummings et al., Reference Cummings, Southgate, Branch, Houston, Jenkins and James1978). In addition to supplying energy from dietary fibre via SCFA absorption, these acids have multiple effects on host gene expression and cellular development as inhibitors of histone de-acetylation and through signaling via G-protein coupled receptors (see recent review by Blaak et al., Reference Blaak, Canfora, Theis, Frost, Groen, Mithieux, Nauta, Scott, Stahl, van Harsselaar, van Tol, Vaughan and Verbeke2020). The effects have been shown to include anti-inflammatory action via the maturation of regulatory T-cells, and the production of hormones that influence satiety (Morrison and Preston, Reference Morrison and Preston2016).
The three predominant SCFA products (acetate, propionate and butyrate) differ in their distribution through the host, modes of action and consequences for health (Chambers et al., Reference Chambers, Preston, Frost and Morrison2018). Butyrate is the preferred energy source for colonic epithelial cells and has been particularly associated with the maintenance of gut health because of its role in the prevention of colitis and colorectal cancer (Pryde et al., Reference Pryde, Duncan, Stewart, Hold and Flint2002; Hamer et al., Reference Hamer, Jonkers, Venema, Vanhoutvin, Troost and Brummer2008; Louis et al., Reference Louis, Hold and Flint2014). It is therefore important to determine to what extent, and why, the relative production of these major SCFA in the gut varies within human populations. Since most SCFA produced are rapidly absorbed in the colon, faecal concentrations represent a balance between production and absorption and represent approximately 5–10 percent of the total production (Boets et al., Reference Boets, Gomand, Deroover, Preston, Vermeulen, de Preter, Hamer, den Mooter, de Yuyst, Courtin, Annaert, Delcour and Verbeke2017). The higher concentrations in the proximal compared to the distal colon (Cummings et al., Reference Cummings, Pomare, Branch, Naylor and MacFarlane1987) reflect both greater bacterial fermentation (production) at that site and less time for absorption. Transit rate through the colon also affects the amount of absorption and correlates with faecal SCFA concentrations (Lewis and Heaton, Reference Lewis and Heaton1997; Müller et al., Reference Müller, Hermes, Canfora, Smidt, Masclee, Zoetendal and Blaak2020). Nevertheless, many studies have demonstrated diet-associated changes in faecal SCFA concentrations, indicating that they can be a proxy for monitoring overall changes in the balance between production and absorption (Duncan et al., Reference Duncan, Belenguer, Holtrop, Johnstone, Flint and Lobley2007; Boets et al., Reference Boets, Deroover, Houben, Vermeulen, Gomand, Delcour and Verbeke2015).
Although some of the earliest literature represents carbohydrate fermentation by anaerobic gut communities as a single balanced equation (Wolin, Reference Wolin1960), it is now clear that fermentation stoichiometry can vary with the species composition of the gut microbiota, with the types of substrate fermented, and with the general gut environment (Flint and Juge, Reference Flint and Juge2015; Louis and Flint, Reference Louis and Flint2017; Reichardt et al., Reference Reichardt, Vollmer, Holtrop, Farquarson, Wefers, Bunzel, Duncan, Drew, Williams, Millligan, Preston, Morrison, Flint and Louis2018). Thus many factors can potentially influence the relative production rates of acetate, propionate and butyrate in vivo. Added to this is the influence of metabolite cross-feeding, as many butyrate-producing bacteria in the colon are also net consumers of acetate (Duncan et al., Reference Duncan, Barcenilla, Stewart, Pryde and Flint2002; Louis and Flint, Reference Louis and Flint2017). A stable isotope study illustrating the systemic availability of colonically administered labelled SCFA showed that 24 per cent of acetate was converted to butyrate (Boets et al., Reference Boets, Gomand, Deroover, Preston, Vermeulen, de Preter, Hamer, den Mooter, de Yuyst, Courtin, Annaert, Delcour and Verbeke2017).
We report here an analysis of multiple studies conducted with human volunteers in Aberdeen, UK, in which data are available for SCFA concentrations in human stool samples. This is a valuable dataset with comparable information for a large number of volunteers that can provide significant insights into the function of the human gut microbiota. The results reveal some highly significant relationships, in particular between % butyrate and total SCFA concentrations that build on classic dietary intervention studies involving human volunteers (Cummings et al., Reference Cummings, Southgate, Branch, Houston, Jenkins and James1978; Stephen et al., Reference Stephen, Wiggins and Cummings1987; Lewis and Heaton, Reference Lewis and Heaton1997).
Methods
Human studies
All the human studies included (Table 1) recruited volunteers locally who did not take antibiotics in the 3 months preceding study participation, nor during the studies, and were conducted according to guidelines laid down in the Declaration of Helsinki, with approval from the appropriate local ethical committee (North of Scotland Research Ethics committee or internal Rowett Institute Human Studies committee). Written consent was obtained from all participants. Samples within studies were collected at the timepoints stated in the respective study protocol. Here, we mainly compare the baseline samples from the volunteers entering the different studies, which represent the free-living population. Any volunteers who participated in more than one study were only considered once by excluding them from datasets in later studies. Details of the dietary regimes followed are detailed in publications relating to individual studies, and are described in the text when appropriate (see Table 1).
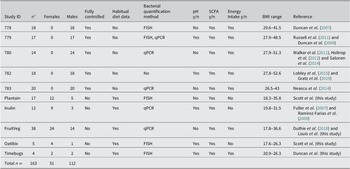
Table 1. Volunteer studies included in this analysis.

a n = Number of volunteers on each study, followed by number of Females/Males.
Where recorded, energy intake was the average sum of energy (kcal) from carbohydrate, protein, fat and fiber per day based on standardised baseline diets (studies 778 – 783) or by use of a 4-day self-reported food diary (FruitVeg) or weekly averages of daily intake records for Timebugs study.
Abbreviations: BMI, body mass index; FISH, fluorescent in situ hybridisation; qPCR, quantitative polymerase chain reaction.
Sample processing
Faecal samples were collected and the fresh samples processed within 12 h of collection following standard protocols in place at the Rowett Institute (Duncan et al., Reference Duncan, Belenguer, Holtrop, Johnstone, Flint and Lobley2007; Walker et al., Reference Walker, Ince, Duncan, Webster, Holtrop, Ze, Brown, Stares, Scott, Bergerat, Louis, McIntosh, Johnstone, Lobley, Parkhill and Flint2011). The number of samples collected varied in the different studies, and the number used in each comparison is indicated at the appropriate point in the results section. Specific methods used for sample processing and analysis are shown in Table S1, illustrating the consistency across all studies.
SCFA analysis
SCFA analysis was carried out using gas chromatography using derivatised samples as previously described in Richardson et al. (Reference Richardson, Calder, Stewart and Smith1989). In brief, following derivatisation of the samples using N-tert-butyldimethylsilyl-N-methyltrifluoroacetamide with 2-ethyl butyrate as the internal standard, the samples were analysed using a Hewlett Packard gas chromatograph (GC) fitted with a silica capillary column and using helium as the carrier gas.
Microbiota analysis
Fluorescent in situ hybridisation (FISH) and quantitative polymerase chain reaction (qPCR) analyses were carried out as detailed in Walker et al. (Reference Walker, Duncan, Leitch, Child and Flint2005) and Ramirez-Farias et al. (Reference Ramirez-Farias, Slezak, Fuller, Duncan, Holtrop and Louis2009), respectively. Any variations on standard protocols are detailed in publications relating to specific individual studies.
Statistical analysis
Associations between individual SCFA ratios and total SCFA were examined via Pearson’s correlation. All statistical tests were performed using R 3.6.0 (R Foundation for Statistical Computing, Vienna), with significance limits set at p < 0.05. Significance of correlations based on multiple observations per volunteer was assessed using a linear mixed model with volunteer as a random effect. Figures were prepared using R version 3.6.3 (R foundation for Statistical Computing, Vienna).
Results
Data on the concentrations of SCFA in faecal samples were compiled from 10 studies conducted in Aberdeen, UK, between 2006 and 2012. Five of these studies involved obese or overweight male volunteers who were enrolled onto carefully controlled dietary intervention trials looking at the impact of diet upon weight loss. The remaining five studies involved healthy volunteers from the general population who received different supplements to their habitual diets (four studies), while Timebugs was a longitudinal study with no dietary intervention (see Table 1 and previous publications, references provided in Table 1, for details).
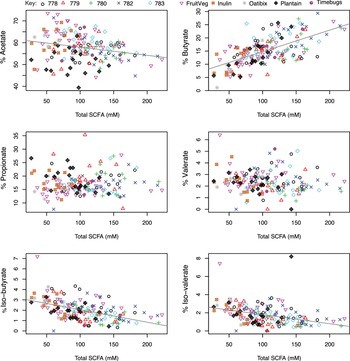
We first examined data from baseline samples provided by each volunteer before any major dietary intervention. These corresponded to the subjects’ habitual diets in the five ‘normal weight’ studies, or following a balanced weight maintenance diet for 1–3 days in the case of the five obesity studies. Results from these single samples from 158 different volunteers are shown in Figure 1, in which the percentage of each fermentation acid within the total SCFA pool was plotted against absolute total faecal SCFA concentrations. Three relationships were highly significant (p < 0.001). The % butyrate increased with increasing total SCFA concentration (correlation r = 0.627, p < 0.001) while % iso-butyrate and % iso-valerate decreased with increasing total SCFA concentration (r = −0.492 and r = −0.373 respectively, p < 0.001). There was also a significant negative correlation between the % acetate and total SCFA concentration (r = −0.247, p = 0.002). The same relationships were also observed when all datapoints (n = 502) across the time courses of the various dietary interventions were included (Figure S1), again with the strongest positive correlation between % butyrate and total SCFA (r = 0.597, p < 0.001). Across the entire dataset, as the total SCFA concentration increased, percentages of acetate, valerate, iso-valerate and iso-butyrate all decreased significantly (p < 0.001; Figure S1).

Figure 1 Relationship between total faecal short-chain fatty acid (SCFA) concentrations and proportional abundance (%) of individual fermentation acids for single baseline samples from 158 of the 163 volunteers. Excludes five volunteers with no samples for SCFA analysis. The sum of all SCFA concentrations (Total SCFA, mM) is on the x-axis while the percentage of each respective SCFA (individual mM divided by total SCFA concentration in mM) is on the y-axis. Pearson’s correlation and linear mixed model analysis gave the following values. Acetate: r = −0.247, p = 0.002; Propionate: r = 0.042, p = 0.602; Iso-butyrate: r = −0.492, p < 0.001; Butyrate: r = 0.627, p < 0.001; Valerate: r = −0.126, p = 0.116; Iso-valerate: r = −0.373, p < 0.001.
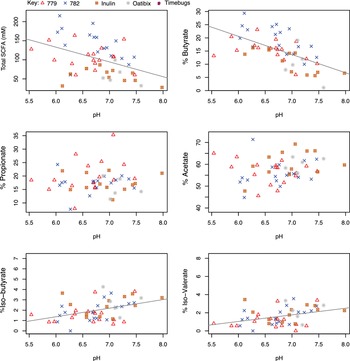
Faecal pH measurements were available for samples from five of the studies listed in Table 1. Figure 2 shows the relationship between SCFA concentrations and pH in the baseline samples (n = 51). This reveals a significant inverse correlation between total SCFA concentration and faecal pH (r = −0.425, p =0.002, and specifically between high % butyrate and low faecal pH (r = −0.588, p < 0.001). In contrast, there was a significant positive correlation between % iso-butyrate (r = 0.415, p = 0.002) and % iso-valerate (r = 0.377, p = 0.006) and faecal pH. There was no significant correlation between the % acetate, or % propionate and faecal pH (Figure 2). The strong correlations between decreasing total SCFA concentrations and decreasing % butyrate with increasing pH were also observed when data for all available timepoints (n = 198; including dietary intervention periods) were plotted against pH (Figure S2, r = −0.503, p < 0.001; r = −0.602, p < 0.001, respectively). Across the full dataset, weak positive correlations were observed between pH and the % propionate (r = 0.142, p = 0.049) and % acetate (r = 0.163, p = 0.022), while the strong positive correlation for % iso-butyrate (r = 0.245, p < 0.001) and pH was still present.

Figure 2 Correlation between faecal pH, short-chain fatty acid (SCFA) and SCFA proportions in baseline samples collected from five volunteer studies (n = 51). The pH is on the x-axis while total SCFA concentration (mM) or the individual SCFA percentage is on the y-axis. Pearson’s correlation and linear mixed model analysis gave the following values. Total SCFA: r = −0.425, p = 0.002; Propionate: r = 0.058, p = 0.686; Iso-butyrate: r = 0.415, p = 0.002; Butyrate: r = −0.588, p < 0.001; Acetate: r = 0.198, p = 0.164; Iso-valerate: r = 0.377, p = 0.006.
Populations of butyrate-producing bacteria related to Roseburia spp. (including Eubacterium rectale) were previously shown to decrease in parallel with % butyrate in faecal samples in dietary interventions (Duncan et al., Reference Duncan, Belenguer, Holtrop, Johnstone, Flint and Lobley2007). Here, data from all timepoints for four studies in which pH and microbial composition was measured (n = 130; Table 1) showed a significant inverse relationship (r = −0.239, p = 0.017) between pH and the relative abundance of the Roseburia group within the faecal microbiota (Figure 3). No such relationship was found between pH and Faecalibacterium prausnitzii, which is another commonly abundant butyrate producing taxon in the human gut, after combining data from three studies (n = 109; Figure 3).

Figure 3 Relationship between faecal pH and proportional abundance (%) of butyrate-producing bacterial groups (Roseburia/E. rectale and F. prausnitzii) within faecal microbiota. Data are based on FISH microscopy counts (Oatibix, Timebugs and 779 study) or quantitative polymerase chain reaction (qPCR) analysis (Inulin study) of all samples from volunteers in four studies (n = 130) in the case of Roseburia, and three studies (n = 109) in the case of F. prausntizii (F. prausnitzii data were not obtained from the Oatibix study). Pearson’s correlation and linear mixed model analysis gave values of: Roseburia % r = −0.239, p = 0.017; F. prausnitzii % r = −0.010, p = 0.829.
In order to specifically investigate links between dietary carbohydrate consumption and butyrate-producing bacteria, for one of the longitudinal studies (study 779), we followed changes in the population of the Roseburia group (as measured by qPCR) over time following the switch from maintenance to a low carbohydrate diet in eight volunteers. These data demonstrate a rapid response to the dietary intervention, with numbers of the Roseburia group declining markedly (p = 0.008) from 5 days of the shift to the low carbohydrate diet in all volunteers (Figure 4).

Figure 4 Change in the proportion of Roseburia/E. rectale 16S rRNA gene amplicons in faecal samples from overweight volunteers following switch from a maintenance diet to a decreased carbohydrate, weight loss diet. Estimates are from quantitative polymerase chain reaction (qPCR) data from study 779, analysed as described in Hamer et al. (Reference Hamer, Jonkers, Venema, Vanhoutvin, Troost and Brummer2008) and Ramirez-Farias et al. (Reference Ramirez-Farias, Slezak, Fuller, Duncan, Holtrop and Louis2009). The number of days after the diet shift is on the x-axis while the % of Roseburia/E. rectale group 16S rRNA gene calculated as a % of total bacterial 16S rRNA genes is on the y-axis. The proportional representation of the Roseburia group declined significantly (p = 0.008) from five days after the diet shift (non-parametric test of means before and after day 5).
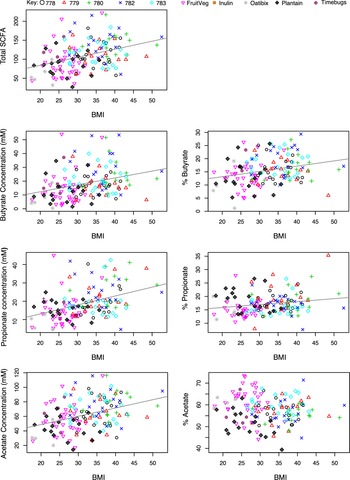
Across volunteers from all 10 studies, total faecal SCFA concentrations in baseline samples increased significantly with body mass index (BMI) (p < 0.001, Figure 5). We should note that the 5 studies, 778–783, involved only male volunteers who were overweight or obese, while the other studies involved volunteers of both sexes, of mixed BMI (n = 145; Table 1). Increased faecal SCFA have been reported previously in obese subjects of both sexes (Schwiertz et al., Reference Schwiertz, Taras, Schäfer, Beijer, Bos, Donus and Hardt2010). Plots of individual SCFAs against BMI showed that concentrations of each of the three major SCFAs (butyrate, acetate and propionate) also all increased significantly with increasing BMI (p < 0.001). These significant increases in SCFA concentrations converted into significant positive correlations between increased proportional abundance of butyrate and propionate (p = 0.001 and p = 0.023 respectively, Figure 5) with increased BMI. Although the mean concentrations of butyrate and total SCFA were significantly lower in females than males (p < 0.001; Figure S3A), this appears to reflect the higher mean body mass and energy intakes of male compared to female volunteers involved in these studies (Figure S3B). Total food intake and intake of dietary fibre were highly correlated in these studies (data not shown), making it impossible to distinguish separate relationships between fibre intake and SCFAs.

Figure 5 Relationship between total faecal short-chain fatty acid (SCFA) or concentrations of individual SCFA in baseline samples versus body mass index in nine studies where body mass index (BMI) was specifically recorded (n = 145). Pearson’s correlation and linear mixed model analysis gave the following values. Total SCFA: r = 0.369, p < 0.001; Butyrate: r = 0.308, p < 0.001; % Butyrate: r = 0.266, p = 0.001; Propionate: r = 0.393, p < 0.001; % Propionate: r = 0.188, p = 0.023; Acetate: r = 0.369, p < 0.001; % Acetate: r = −0.112, p = 0.179.
Discussion
We reported previously that % butyrate decreased and % iso-valerate and iso-butyrate increased in faecal SCFA in response to reduced carbohydrate intake in small groups of overweight volunteers (Duncan et al., Reference Duncan, Belenguer, Holtrop, Johnstone, Flint and Lobley2007; Russell et al., Reference Russell, Gratz, Duncan, Holtrop, Ince, Scobbie, Duncan, Johnstone, Lobley, Wallace, Duthie and Flint2011). The wider analysis presented here of samples donated by 163 individuals from 10 human volunteer studies reveals significant changes in the ratios of different SCFA with increasing total faecal SCFA concentration. Specifically, as the total SCFA concentration increases, the proportion (%) of butyrate increases and % iso-valerate and % iso-butyrate decreases. These relationships were significant both across the baseline samples, and when complete longitudinal data from the full dietary intervention periods were included. The simplest interpretation is that inter-individual variation in the volunteers’ habitual dietary intake results in variation in the delivery of fermentable fibre to the large intestine, which is reflected in the bacterial fermentation products detected in faecal samples.
There are two distinct mechanisms involving colonic pH that could explain the increase in % butyrate with increasing total faecal SCFA concentration. The first is that the stoichiometry of butyrate formation by dominant butyrate-producing bacteria, including Roseburia spp. and Faecalibacterium prausnitzii, changes with gut luminal pH. These species rely on the butyryl-CoA:acetate CoA-transferase reaction for the final step in butyrate formation that can involve the net uptake of acetate (Duncan et al., Reference Duncan, Barcenilla, Stewart, Pryde and Flint2002). More butyrate is formed, and more acetate taken up, per mol of hexose fermented by pure cultures when the pH is slightly acidic than when it is closer to neutrality (Kettle et al., Reference Kettle, Louis, Holtrop, Duncan and Flint2015; Louis and Flint, Reference Louis and Flint2017). This effect appears to account for a 25–50 per cent higher proportion of butyrate among the SCFA products of in vitro batch incubations with mixed faecal bacteria observed when the initial pH was 5.5 compared to 6.5 (Reichardt et al., Reference Reichardt, Vollmer, Holtrop, Farquarson, Wefers, Bunzel, Duncan, Drew, Williams, Millligan, Preston, Morrison, Flint and Louis2018). This effect occurred across a wide range of microbial community composition and was not observed for propionate formation in the same incubations (Reichardt et al., Reference Reichardt, Vollmer, Holtrop, Farquarson, Wefers, Bunzel, Duncan, Drew, Williams, Millligan, Preston, Morrison, Flint and Louis2018). Since there is evidence that higher SCFA concentrations result in lower pH values in the colon in vivo (Bown et al., Reference Bown, Gibson, Sladen, Hicks and Dawson1974; Cummings et al., Reference Cummings, Southgate, Branch, Houston, Jenkins and James1978) this stoichiometric shift would increase the % butyrate produced as total SCFA concentrations increase.
pH may also play a crucial role in determining the competition for carbohydrates in the colon. Chemostat studies with human colonic microbiota have shown that major butyrate-producing species compete better for soluble carbohydrates when the pH is slightly acidic than when it is close to neutrality. This is explained by decreased competition between these butyrate-producers and Bacteroides species that are more sensitive to acidic pH (Walker et al., Reference Walker, Duncan, Leitch, Child and Flint2005; Duncan et al., Reference Duncan, Louis, Thomson and Flint2009; Chung et al., Reference Chung, Walker, Louis, Parkhill, Vermeiren, Bosscher, Duncan and Flint2016). Theoretical modelling was used to demonstrate that the experimental changes in community composition and butyrate formation were consistent and predictable from the behaviour of cultured human colonic bacteria (Duncan et al., Reference Duncan, Louis, Thomson and Flint2009; Kettle et al., Reference Kettle, Louis, Holtrop, Duncan and Flint2015).
Another possible mechanism is that an increased supply of dietary fibre to the proximal colon promotes the growth and activity of butyrate-producing species, thereby increasing their representation within the microbial community. Evidence for this in vivo comes from carefully controlled dietary intervention studies that show a significantly higher proportional representation (and absolute numbers) of butyrate-producing bacteria related to Roseburia (including Eubacterium rectale) in faecal microbiota from individuals when consuming diets high in fibre compared with diets low in total carbohydrate and fibre (Duncan et al., Reference Duncan, Belenguer, Holtrop, Johnstone, Flint and Lobley2007; Russell et al., Reference Russell, Gratz, Duncan, Holtrop, Ince, Scobbie, Duncan, Johnstone, Lobley, Wallace, Duthie and Flint2011). Indeed, a fourfold decrease in the Roseburia population was associated with fourfold lower % butyrate (and butyrate concentration) among faecal SCFAs (Duncan et al., Reference Duncan, Belenguer, Holtrop, Johnstone, Flint and Lobley2007). The link between high fibre consumption and higher abundance of the Roseburia group has also been reported in other studies (Adamberg et al., Reference Adamberg, Jaagura, Aaspõllu, Nurk and Adamberg2020), and there is evidence that some of these bacteria specialise in the utilisation of insoluble fibres (Duncan et al., Reference Duncan, Russell, Quartieri, Rossi, Parkhill, Walker and Flint2016). Fermentable carbohydrates also tend to favour lactate-producing Bifidobacterium species. Since several species of colonic bacteria are known to produce butyrate from lactate (Louis and Flint, Reference Louis and Flint2017) this could stimulate butyrate formation indirectly via metabolite cross-feeding.
Iso-butyrate and iso-valerate are products of the fermentation of branched chain amino acids, mainly by Bacteroides and Clostridia species (Aguirre et al., Reference Aguirre, Eck, Koenen, Marjorie, Savelkoul, Budding and Venema2016; Rios-Covian et al., Reference Rios-Covian, González, Nogacka, Arboleya, Salazar, Gueimonde and los Reyes-Gavilán2020). The % iso-butyrate and iso-valerate among total SCFA is reported to increase with high protein, low carbohydrate diets (Russell et al., Reference Russell, Gratz, Duncan, Holtrop, Ince, Scobbie, Duncan, Johnstone, Lobley, Wallace, Duthie and Flint2011; Gratz et al., Reference Gratz, Hazim, Richardson, Scobbie, Johnstone, Fyfe, Holtrop, Lobley and Russell2019), while BCFA levels are inversely correlated with consumption of dietary fibre (Rios-Covian et al., Reference Rios-Covian, González, Nogacka, Arboleya, Salazar, Gueimonde and los Reyes-Gavilán2020). The decrease in % BCFA with increasing total SCFA therefore suggests that high faecal SCFA concentrations are largely attributable to increased carbohydrate fermentation that does not yield BCFA. If we assume that dietary protein is largely digestible (Cummings and Macfarlane, Reference Cummings and Macfarlane1997; Van der Wielen et al., Reference Van der Wielen, Moughan and Mensink2017), then the delivery of ‘resistant’ dietary protein to the colon is not likely to increase greatly, if at all, on high-fibre diets, while endogenous sources of protein should be largely independent of fibre intake. Therefore, increased fibre intake is expected to lead to fermentation of more non-digestible carbohydrate relative to protein in the large intestine.
Another potential contributor to the observed correlations between higher % butyrate, higher total faecal SCFAs and lower faecal pH is gut transit time. Several studies have shown that gut transit rate can play a major role in determining metabolite concentrations and microbiota profiles. In early studies that used drug or fibre intake to vary gut transit, generally in small groups of volunteers, more rapid whole gut transit was associated with increased faecal SCFA concentrations, increased % butyrate and decreased colonic pH (Cummings et al., Reference Cummings, Southgate, Branch, Houston, Jenkins and James1978; Stephen et al., Reference Stephen, Wiggins and Cummings1987; El Oufir et al., Reference El Oufir, Flourié, Bruley des Varannes, Barry, Cloarec, Bornet and Galmiche1996; Lewis and Heaton, Reference Lewis and Heaton1997; Abell et al., Reference Abell, Conlon and AL2006). More recently, longer gut transit times correlated with higher microbial diversity and species richness (Roager et al., Reference Roager, Hansen, Bahl, Frandsen, Carvalho, Gøbel, Dalgaard, Plichta, Sparholt, Vestergaard, Hansen, Sicheritz-Pontén, Nielsen, Pedersen, Lauritzen, Kristensen, Gupta and Licht2016; Vandeputte et al., Reference Vandeputte, Falony, Vieira-Silva, Tito, Joossens and Raes2016). Constipated patients across different age-groups appear to have lower total SCFA concentrations, much lower concentrations of butyrate and lower numbers of butyrate-producing bacteria than age-matched healthy controls (Zhuang et al., Reference Zhuang, Shang, Ma, Strappe and Zhou2019).
Increased gut transit rate is considered to lead to increased faecal SCFA concentrations for two main reasons (Stephen et al., Reference Stephen, Wiggins and Cummings1987; Flint, Reference Flint2011). First, there is evidence that an increase in transit rate through the upper gut may result in less complete digestion of food components, thus increasing the amount of digestive residue arriving in the large intestine and increasing the rate of microbial fermentation (Holgate and Read, Reference Holgate and Read1983; Chapman et al., Reference Chapman, Sillery, Graham and Saunders1985). Second, more rapid transit is expected to decrease the proportion of SCFA produced by microbial fermentation that is subsequently absorbed across the colonic mucosa. Individuals with slow colonic transit tend to show lower faecal concentrations of SCFA (Müller et al., Reference Müller, Hermes, Canfora, Smidt, Masclee, Zoetendal and Blaak2020), and longer average colonic transit times are reported in healthy females than in healthy males (Rao et al., Reference Rao, Kuo, McCallum, Chey, DiBaise, Hasler, Koch, Lackner, Miller, Saad, Semler, Sitrin, Wilding and Parkman2009; Wang et al., Reference Wang, Mohammed, Farmer, Wang, Zarate, Hobson, Hellström, Semler, Kuo, Rao, Hasler, Camilleri and Scott2015). The present study was not designed to examine the influence of gender, but we can note that gender-associated differences in the microbiota composition have been linked to BMI (Haro et al., Reference Haro, Rangel-Zúñiga, Alcalá-Díaz, Gómez-Delgado, Pérez-Martínez, Delgado-Lista, Quintana-Navarro, Landa, Navas-Cortés, Tena-Sempere, Clemente, López-Miranda, Pérez-Jiménez and Camargo2016).
In conclusion, inter-individual variation in habitual dietary intakes, in particular fibre intake, are likely to be the main factors accounting for the systematic variation in microbial fermentation and SCFA concentrations observed among human volunteers. The stimulation of butyrate, the main energy source for colonocytes, by decreased colonic pH associated with high microbial SCFA production, noted here, is likely to be a significant factor in the protective effect of fibre consumption against colorectal cancer and certain other bowel diseases.
Acknowledgements
We would like to thank all the volunteers who participated in the 10 human studies included here. We would also like to thank the Rowett Institute Human Nutrition Unit, and the many other staff and students who were involved in each of these studies in recruitment, sample collection and analysis.
Supplementary Materials
To view supplementary material for this article, please visit http://doi.org/10.1017/gmb.2022.1.
Funding
The Rowett Institute (University of Aberdeen) receives financial support from the Scottish Government Rural and Environmental Sciences and Analytical Services (RESAS). Studies 779 and 780 were supported by a grant from the World Cancer Research Fund.
Disclosure statement
The authors declare no conflicts of interests.
Notes on contributors
Maria LaBouyer , Master of Science University of Aberdeen, Scotland. Main Research interests: Gut microbial metabolism.
Grietje Holtrop, PhD 1998, Biomathematics and Statistics Scotland (BioSS), Aberdeen, Scotland. Main research Interests: Mathematical modelling of gut bacteria.
Graham Horgan, PhD 1990. Biomathematics and Statistics Scotland (BioSS), Aberdeen, Scotland. Main research Interests: data integration, linear programming and high dimensional data.
Silvia W. Gratz, PhD 2007, Senior Research Fellow, Rowett Institute, University of Aberdeen. Main Research interests: food toxicology, gut microbial metabolism, intestinal function and toxicity.
Alvaro Belenguer, PhD 2004, Tenured Scientist, Institute of Aquaculture Torre de la Sal (IATS - CSIC). Main Research interests: Gut microbial metabolism, intestinal health and feed efficiency, fish nutrition, genomics and epigenomics.
Nicola Smith, PhD 2021, Rowett Institute, University of Aberdeen. Currently trainee at European Food Safety Authority, Parma, Italy. Main Research interests: gut health, microbiome and food safety.
Alan W. Walker, PhD 2006, Senior Lecturer, Rowett Institute, University of Aberdeen. Main Research interests: Anaerobic gut microbiology, impact of diet on microbial composition, colonisation resistance.
Sylvia H. Duncan, PhD 2001, Senior Research Fellow, Rowett Institute, University of Aberdeen. Main Research interests: human intestinal microbiology, impact of dietary fibre on health, microbial metabolism and cross feeding.
Alexandra M. Johnstone, PhD 2001, Research Professor, Rowett Institute, University of Aberdeen. Main Research interests: Obesity, appetite and energy balance across the lifecourse.
Petra Louis, PhD 1996, Senior Research Fellow, Rowett Institute, University of Aberdeen. Main Research interests: human gut microbiota, microbial ecology, microbial metabolism.
Harry J. Flint, PhD 1977, Emeritus Professor, Rowett Institute, University of Aberdeen. Main Research interests: Anaerobic microbiology, microbial fermentation of carbohydrates, gut health and nutrition.
Karen P. Scott, PhD 1993, Senior Research Fellow, Rowett Institute, University of Aberdeen. Main Research interests: Anaerobic gut microbiology, impact of diet on microbial composition and health, antimicrobial resistance, bacterial gene transfer.
Author Contributions
Conceptualisation: S.H.D., S.W.G., H.J.F., A.M.J., P.L., K.P.S., and A.W.W.
Methodology: A.B., M.L.B., S.H.D., P.L., K.P.S., N.S. and A.W.W.
Formal analysis: A.B., M.L.B., S.H.D., H.J.F., S.W.G., G.Hol., G.Hor., P.L., A.M.J., K.P.S. and N.S.
Data curation: G.Hol. and G. Hor.
Supervision: H.J.F. and K.P.S.
Funding acquisition: S.H.D., S.W.G., H.J.F., A.M.J., P.L., K.P.S. and A.W.W.
Writing – original draft: K.P.S. and H.J.F.
Writing – review & editing: all authors.
Research transparency and reproducibility
The data used to prepare this manuscript were generated from 10 previous studies, many published as primary papers. The combined dataset is available in the Supplementary file entitled ‘faecal SCFA and butyrate study data tables’.


 Open access