


To the Editor—Clostridium difficile infections (CDI) are among the most common healthcare facility-associated infections, and hospital outbreaks occur regularly. Outbreaks often occur either as a general increase in incidence on the hospital level, or as a cluster of cases within a single ward. For the latter type of outbreak, it is not entirely straightforward to determine the number of cases within a ward in a certain time period that ought to make one suspect an outbreak. In Ontario, Canada, 1 notification thresholds for further investigation of possible outbreaks are set at 3 cases within a week or 5 cases within 4 weeks for wards with >20 beds. For wards with <20 beds, the threshold is set at 2 cases within 1 week or 4 cases within 4 weeks. Although this approach is sensible, it does not take into account that there is a variability of CDI background rates at different wards.Reference Chung, Wu and Lee 2 At our hospital, the CDI rate varies 10-fold between high-incidence wards (eg, infectious diseases, gastroenterology) and low-incidence wards (eg, orthopedics, gynecology). For example, 3 cases within 4 weeks happen regularly at the former but very seldom at the latter. We would hereby like to propose a method for taking the variability in ward-specific rates in account when determining notification thresholds for CDI. We intend to validate the method scientifically, and in the meantime, we hope that this letter will inspire others to implement, test, and refine the method at their own hospitals. We welcome contact with other researchers interested in this issue.
The Poisson distribution (Figure 1) describes the probability for a certain number of independent events to occur within a specified period. Say, for instance, that you happen to bump into an old friend from your school years about once every year on average. You would not be surprised to have 0, 1, or 2 encounters during a year; 3 or 4 might raise your eyebrows, and if you encounter 5 or more schoolfriends in a single year, you may question the randomness of the situation. Perhaps your friends have talked to each other and decided to meet up, thus making the events dependent. Consulting the Poisson distribution, you could confirm your intuition: given an average of one encounter per year, random encounters of 5 old friends in a single year would be expected to happen only once every 326 years.
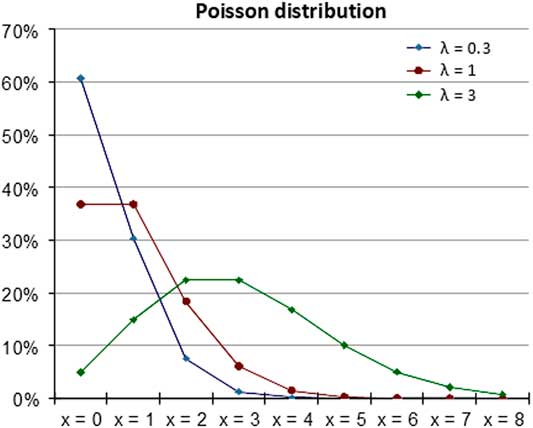
Fig. 1 The Poisson distribution for 3 different values of λ.
The formula for the Poisson distribution for a given period is $P\left( {X{\equals}x} \right){\equals}{{\lambda ^{x} e^{{{\minus}\lambda }} } \over {x\,!\,}}$
where P(X=x) is the the probability for x events; x=0, 1, 2, 3… (ie, the number of events in question); λ is the mean number of events per time period over the long run; e is Euler’s constant ≈2.718; and ! is the factorial sign. For example, 4!=4×3×2×1.
Sporadic cases of CDI in a ward should theoretically follow the Poisson distribution. In the event of spread within a ward, the cases are not independent and thus do not respect the distribution, similar to when your old friends talk to each other and decide to appear at the same time. An unlikely high number of cases for the ward in question should raise suspicion of spread within the ward. The method can be seen as a diagnostic test for CDI outbreaks, where there is a trade-off between sensitivity (ie, detecting most outbreaks) and specificity (ie, a low level of “false alarms”). Here, we describe how we have implemented the method at our secondary-care, 420-bed hospital and a neighboring 100-bed hospital in western Sweden.
We determine the λ value for each ward at the hospital measured as cases per month. In selecting the number of months to base λ on, there is a trade-off between having too few measure points such that chance impacts too much, and using data that is too old to be relevant. We used 36 months as a reasonable compromise. We then determined the variance (= standard deviation squared) of the distribution of cases per month, which should be equal to λ. If not, it is not a Poisson distribution. At the wards in our hospital, most wards had a variance that was almost uncannily close to their λ, strengthening our assumption that sporadic CDI cases follow the distribution not only in theory but also in practice. A few wards, however, had variances that were substantially higher than their λ, suggesting that there may have been small outbreaks that went under our radar at the time. To not contaminate the background rates with possible outbreaks, we deleted any outliers (ie, months with an unusually high number of cases in a ward) from the sample until the variance approached λ. This measure could be discussed from a methodological standpoint, but as a safety measure, we deemed it appropriate. We chose a cutoff of 1% (ie, the number of cases in a ward that is expected to occur more infrequently than once every 100 months). This cutoff was set arbitrarily and will likely change as we test and refine the method. Using this cutoff and the Poisson formula, we determined for each ward the number of cases within a month that serves as an alert for further investigation of a possible outbreak.
Financial support
No financial support was provided relevant to this article.
Conflicts of interest
All authors report no conflicts of interest relevant to this article.

