


Diabetes mellitus (DM) is a metabolic disease that causes disorders of carbohydrate, fat and protein metabolism characterised by chronic hyperglycaemia( Reference Gautam and Banerjee 1 ). Globally, it was expected that DM cases will reach 438 million by 2030, in which type 2 DM was the most commonly diagnosed type( Reference Gautam and Banerjee 1 – 3 ). Today, the most important approach used to prevent and reduce the occurrence of type 2 DM is dietary modifications in macronutrients as a primary and long-term strategy( 4 , Reference Redmon, Caccamo and Flavin 5 ).
Although the studies conducted in this regard are usually based on dietary carbohydrates, recent studies indicate that SFA and unsaturated fatty acids are also involved in the aetiology of diabetes owing to their function as signal molecules in various cellular processes including occurrence and progress of diabetes( Reference Liu, Li and Guan 6 , Reference Xu, Zhang and Huang 7 ). Although high levels of SFA in the membrane have adverse effects on insulin signalling, there are studies reporting that high levels of n-3 and n-6 fatty acids, among PUFA, might have a role in increasing insulin sensitivity( Reference Siri-Tarino, Sun and Hu 8 – Reference Lalia and Lanza 10 ).
Although insulin signalling and insulin secretion have been generally investigated in studies related to type 2 DM, recent studies concluded that multifactorial causes, insulin, as well as different peptides, may be involved in the aetiology of diabetes( Reference Bergman and Ader 11 ). The studies conducted on CD36 fatty acid transport (FAT) receptor have recently increased owing to its multi-functional properties. Soluble CD36 (sCD36) is an important multi-functional membrane receptor to participate fatty acid uptake and a recently detected in blood as a cell-free form and identified as a biomarker of the metabolic syndrome( Reference Kuijpers, De Witt and Nergiz-Unal 12 – Reference Febbraio and Silverstein 14 ). Thus, sCD36 might be associated with insulin resistance, obesity and low-grade inflammations. In some recent studies, it was also reported that CD36 has a wide range of expression and it may play a role in diabetes and selection of fatty foods, as well as the mentioned functions( Reference Nergiz-Unal, Rademakers and MEM Cosemans 15 – Reference Lynes and Widmaier 17 ).
Accordingly, human studies that examine the relationship between sCD36 level, dietary fatty acid pattern, and fatty food preferences in relation to insulin resistance in human nutrition are limited in the literature. Therefore, this study aimed to analyse the relationship between dietary fat and fatty acid pattern, fatty food preferences, insulin resistance and CD36 fatty acid receptor levels in newly diagnosed type 2 diabetic patients in comparison with healthy individuals.
Methods
The research was conducted on individuals between 30 and 65 years of age with newly diagnosed type 2 DM (n 38) who were admitted to the Endocrinology Outpatient Clinic of Kırıkkale University Faculty of Medicine, and healthy volunteers (n 37) who were selected in compliance with the BMI and age of patients, between October 2014 and June 2015. The sample size of this study was determined with power analysis at an 80 % statistical power and 0·05 % two-sided significance level. A total of 104 individuals were assessed for the research and the study was completed with seventy-five volunteers. To assess the potential influence of long-term blood glucose control impairment on sCD36 levels in newly diagnosed T2 DM patients, the study included those who had not started to receive any medication such as insulin and oral antidiabetic drugs. Individuals who did not meet the study criteria could not give a reliable diet trait or information, and those who wanted to quit were excluded from the study. Ethics committee approval suitable for the Declaration of Helsinki (Ethics Committee no. 12/03) was received from the Commission for Evaluation of Scientific Research at Kırıkkale University. Volunteers were interviewed face to face and a signed written consent form was obtained from each participant.
Anthropometric measurements
The body weight measurement was taken using an electronic scale sensitive to 0·1 kg (Tanita BC 420) and with appropriate garments while the participant was fasting( 18 ). Furthermore, body composition analysis was also determined by bioelectrical impedance analysis (Tanita BC 420)( Reference Bohm and Heitmann 19 ). The height measurement was taken while standing without shoes and on a Frankfurt horizontal plane (eye triangle and top of tragus on the same line)( 18 ).
BMI (kg/m2) was calculated from body weight (kg) and height (cm) measurements of the individuals. Individuals with a BMI between 18·5 and 24·9 kg/m2 were classified as normal, those between 25·0 and 29·9 kg/m2 were classified as pre-obese, those between 30·0 and 34·9 kg/m2 were classified as first-degree obese, those between 35·0 and 39·9 kg/m2 were classified as second-degree obese and those with a BMI of ≥40·0 kg/m2 were classified as third-degree obese( 18 ).
Waist circumference was measured from the lowest circumference in the middle of the iliac prominence and the lowest rib of the individual by an inflexible measuring tape. Individuals were classified as risky (female: ≥80 cm; male: ≥94 cm) or at high risk (female: ≥88 cm; male:≥102 cm) according to the waist circumference measurements( 18 ). Hip circumference was measured parallel to the ground from the highest point on the hip by an inflexible measuring tape. Waist:hip ratio was calculated by the waist circumference (cm)/hip circumference (cm) formula and their risk values were considered as ≥0·85 for women and ≥0·90 for men( 18 ).
Dietary intake and fat type consumption
In the study, individual daily food consumption was determined by the ‘24-h recall’ method using a Food Consumption Registration Form. Fatty acid type and fat intake amounts of the individuals were calculated using BeBIS 7.1 (Nutrition Information System) program. The type and frequency of fat or oil consumed and fatty food preferences by individuals on a daily diet was assessed by recording the FFQ( Reference Rakıcıoğlu and Akal Yıldız 20 ).
Fasting blood glucose, soluble CD36, TAG, insulin and insulin resistance levels analysis
Fasting serum glucose and TAG concentrations were measured using a photometric assay method with an autoanalyser (Roche Diagnostics). Serum insulin levels were determined by electrochemiluminescence immunoassay with an autoanalyser (Roche Diagnostics). After drawing blood from each patient, the serum was isolated from the whole blood, snap-frozen and preserved at −80°C. sCD36 levels were measured using a commercially available ELISA kit (Glycoprotein IV (GP4); Human Elisa Kit Cloud-Clone Corp. Company; product no.: SEB530HU)( Reference Nergiz-Unal, Kuijpers and de Witt 21 ). Insulin resistance (homeostatic model assessment of insulin resistance; HOMA-IR) was calculated by the (fasting serum glucose (mg/dl)×fasting insulin level (μU/ml))/405 formula( Reference Rössner, Neovius and Mattsson 22 ).
Statistical data analysis
The distribution and skewness of the data were assessed by normality tests and the mean was expressed with means with their standard errors or standard deviations values. In comparison of the differences between the two independent groups, a non-parametric hypothesis test (Mann–Whitney U test) was used for numerical/quantitative data, whereas the Pearson’s χ 2 test was used for qualitative data. Non-parametric Spearman’s rank correlation analysis was performed to determine the relationship between numerical variables. Logistic regression analysis was performed for the risk assessment. Statistical significance was set at P<0·05 and data analysis was performed with the Statistical Package for Social Sciences (SPSS version 23.0).
Results
General characteristics of participants
The study included thirty-eight (twenty-four females, fourteen males) newly diagnosed type 2 DM patients and thirty-seven healthy control (twenty-eight females, nine males) subjects. There was no statistically significant difference (P>0·05) between the groups in terms of individual characteristics such as sex, marital status, educational status, regular physical activity and smoking status of individuals who were newly diagnosed with type 2 DM or healthy individuals (Table 1). The same demographic characteristics in both groups confirm that an appropriate control group was selected in order to make comparisons (Table 1). Although there was a significant difference in the mean age of the subjects between the groups, the facts that both groups were in the adult age range and sCD36 does not change with age indicate that the groups were chosen appropriately for the comparisons (Table 1).
Table 1 General characteristics of the participants in the studyFootnote * (Mean values and standard deviations; numbers and percentages; mean values with their standard errors)
DM, diabetes mellitus.
* The χ 2 test was performed between the patient and the control groups for total participants.
Body composition and anthropometric measurements
The difference between the groups in terms of parameters of body composition such as total body fat (%, kg), fat-free body mass (%, kg), muscle mass (%, kg) and body water (%, kg) was not statistically significant (P>0·05) when BMI classification was taken as a basis (P>0·05) (data not shown).
The differences between the mean waist circumferences, measured for the determination of regional fatness in the body, of the control and type 2 DM patient groups were statistically significant (P<0·05). Hip circumference measurements did not differ between the groups (P>0·05), whereas the waist/hip ratio difference was statistically significant (P<0·05). When the above-mentioned measurements are classified according to intersection points determined by the World Health Organisation, risky and high-risk waist circumference and high-risk waist:hip ratio were significantly more frequent in the diabetic group in comparison with the control group (Table 2).
Table 2 Anthropometric measurements of the participantsFootnote † (Numbers and percentages)
DM, diabetes mellitus.
*P<0·05 is significant.
† The χ 2 test was performed between the patients and the control groups for total participants.
‡ WHO cut-off points and risk of metabolic complications (WHO Expert Consultation).( 18 )
Dietary fatty acids and dietary fatty acid pattern
Considering the dietary fat or oil type, it was determined that the most frequently consumed one in the patient and control groups was sunflower oil, followed by butter; the daily average consumption of sunflower oil and butter in the patient and control groups did not differ (P>0·05). In contrast, the mean olive oil consumption was significantly higher in the control group than in the patient group (P<0·05). In terms of the consumption of other dietary fat types including sunflower oil, maize oil, hazelnut oil, sesame oil, animal fat, butter, solid margarine and soft margarine, there was no significant difference between the groups (P>0·05) (Table 3).
Table 3 Dietary oil or fat types and daily consumption amounts of the participantsFootnote † (Mean values with their standard errors)
DM, diabetes mellitus.
* P<0·05 is significant.
† The Mann–Whitney U test was performed between the patients and the control groups for total participants.
Furthermore, after taking daily food consumption records from individuals, the dietary fatty acid pattern was calculated from foods and drinks consumed by the participants. According to these data, the percentage of daily energy received from fat was higher in the control group (P<0·05). However, there was no significant difference between the groups for fatty acid type, cholesterol, n-3 and n-6 PUFA (P>0·05). The ratio of n-6:n-3 PUFA was approximately 15:1 in both groups (Table 4).
Table 4 Dietary fat and fatty acids pattern of the participants (Mean values with their standard errors)
DM, diabetes mellitus; MCFA, medium-chain fatty acids; LCFA, long-chain fatty acids.
* P<0·05 is significant.
† The data were evaluated with the t test, and the rest of the data were assessed using the Mann–Whitney U test for total participants within the groups.
Serum soluble CD36, glucose, insulin, TAG levels and insulin resistance
Fasting blood glucose levels of the individuals who participated in the study were 9·2 (sem 0·67) mmol/l in the patient group and 5·2 (sem 0·05) mmol/l in the control group (P<0·05) (data not shown). sCD36 levels in the blood were analysed as 17·7 (sem 1·0) ng/ml in the patient group and 12·5 (sem 0·7) ng/ml in the control group (P<0·05). Mean blood insulin levels and HOMA-IR values were 16·5 (sem 1·4) μU/ml and 6·2 (sem 0·5), respectively, in the patient group, and 11·4 (sem 0·8) μU/ml and 2·3 (sem 0·1), respectively, in the control group (P<0·05). When the data were assessed based on sexes, this significance was only parallel to HOMA-IR and sCD36 levels. Blood TAG levels of individuals were 2·13 (sem 0·19) mmol/l in the diabetic group and 1·51 (sem 0·19) mmol/l in the control group (P<0·05) (Table 5).
Table 5 Fasting serum levels of soluble CD36 (sCD36), insulin, TAG and estimation of insulin resistance (homeostatic model assessment of insulin resistance; HOMA-IR)Footnote † (Mean values with their standard errors)
DM, diabetes mellitus.
* P<0·05 is significant.
† The Mann–Whitney U test was performed between the patient and the control groups for total participants.
The logistic regression analysis results showed that elevated sCD36 levels were associated with higher type 2 DM risk (OR 1·21; 95 % CI 1·03, 1·44; P=0·02), whereas increased consumption of olive oil was associated with lower type 2 DM risk (OR 0·92; 95 % CI 0·86, 0·99; P=0·03).
Correlation analysis was performed between sCD36 levels and insulin and TAG levels in the serum, HOMA-IR, anthropometric measurements (BMI, waist circumference and waist:hip ratio) and dietary fatty acids in the individuals newly diagnosed with type 2 DM. However, there was no significant relationship between sCD36 levels in the serum and these parameters (P>0·05) (data not shown). Correlation graphic in Fig. 1 shows that there was no relationship between sCD36, which had a difference of means in the patient and the control groups, blood insulin level (r 0·02, P=0·88), HOMA-IR value (r 0·13, P=0·63), blood TAG level (r 0·20, P=0·24) and the waist circumference (r −0·02, P=0·91) (Fig. 1(a) and (d)).
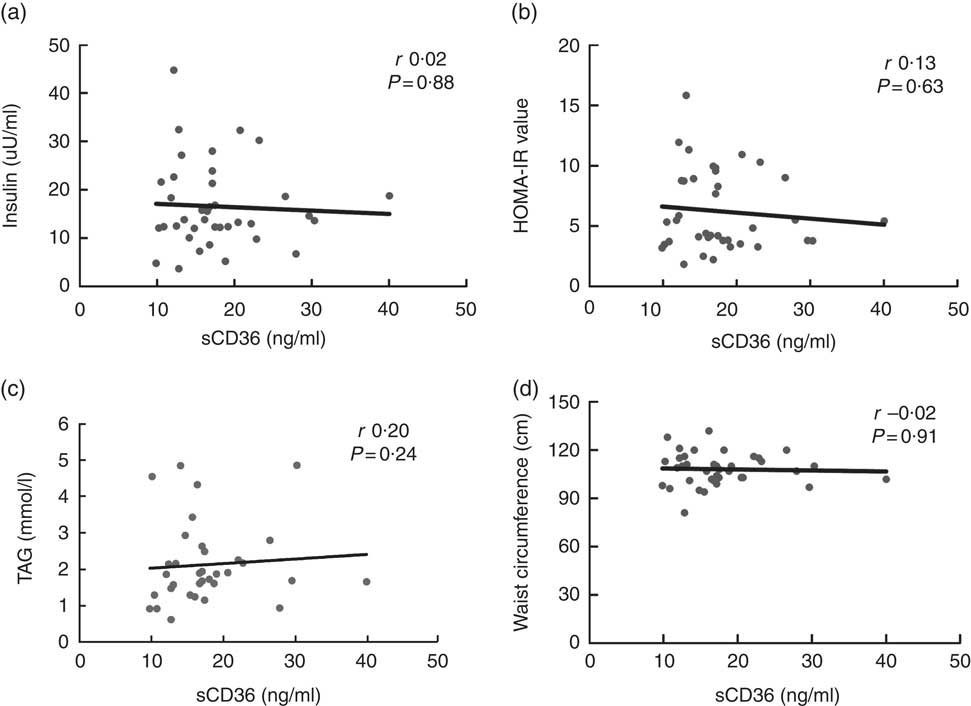
Fig. 1 Relationship between CD36 and insulin, insulin resistance, TAG and waist circumference levels of patients with type 2 diabetes mellitus. Fasting serum insulin (a), insulin resistance (homeostatic model assessment of insulin resistance; HOMA-IR) (b), TAG levels (c) and waist circumference measurement (d) correlation graphs of patients with type 2 diabetes mellitus are presented. sCD36, soluble CD36.
Serum soluble CD36 level, dietary fatty acid pattern and food preferences
Correlation analysis (Spearman’s rank correlation coefficient test) was performed for the relationship between total fat (g), PUFA (g), MUFA (g), SFA (g), n-3 PUFA (g), n-6 PUFA (g), cholesterol (mg) intake and n-6:n-3 ratio and sCD36 level. Hence, there was no significant difference (P>0·05) between the sCD36 levels and dietary fatty acid pattern of the newly diagnosed type 2 DM patient group and the control group (Table 6).
Table 6 Relationship between soluble CD36 (sCD36) level and dietary fatty acid patternFootnote †
DM, diabetes mellitus.
* P<0·05 is significant.
† The Spearman’s rank correlation coefficient test was performed between the patient and the control groups for total participants.
Fat, carbohydrate or protein food preferences were also recorded based on individual declaration, and these results are shown in Table 7. However, significant difference between food preferences in patient and control groups was determined only in carbohydrate-containing food preference, not in fatty food preference. A percentage of 21·6 % in the control group and 47·4 % in the diabetic patient group stated that they had a desire to eat carbohydrate foods (P<0·05) (Table 7). Moreover, the relationships of serum sCD36 values for individuals diagnosed with type 2 DM and in the control group were also assessed based on their food preferences. On the other hand, serum sCD36 values in both the diabetic patient group and control group were not affected by fat, carbohydrate and protein food preferences (χ 2 (2)=0·82, χ 2 (2)=4·94 P>0·05).
Table 7 Fat, carbohydrate or protein consisting food preferences of the participantsFootnote † (Numbers and percentages)
* P<0·05 is significant.
† The χ 2 test was performed between the patient and the control groups for total participants.
Discussion
According to our principal findings, serum sCD36 levels in type 2 DM patients elevated even if DM was newly diagnosed. Fatty acid pattern, abdominal adiposity, visceral fat and fatty acids transporters such as CD36 may be correlated with development of type 2 DM. According to recent studies, sCD36 levels are higher in type 2 DM patients, and this condition is considered to be closely correlated with insulin resistance( Reference Handberg, Levin and Hojlund 23 – Reference Liani, Halvorsen and Sestili 26 ). In this study conducted in parallel to this, the sCD36 level was significantly higher in type 2 DM patients (17·7 (sem 1·0) ng/ml) than in the control group (12·5 (sem 0·7) ng/ml). Similarly, in the studies by Alkhatatbeh et al. ( Reference Alkhatatbeh, Enjeti and Acharya 25 ) and Liani et al.( Reference Liani, Halvorsen and Sestili 26 ), sCD36 levels were significantly higher in diabetic individuals than in their control groups. High sCD36 levels may be considered to be involved in the pathogenesis of metabolic processes taking place commonly in DM and obesity, such as the use of muscle lipids, accumulation of TAG in the adipose tissue, fat absorption in the intestines and use of the substrate in the heart, as CD36 can bind to fatty acids and facilitate their transport into the cell( Reference Nergiz-Unal, Rademakers and MEM Cosemans 15 , Reference Christiaens, Van Hul and Lijnen 27 – Reference Martin, Chevrot and Poirier 30 ). Therefore, abdominal adiposity, inflammation and lipid profile indicators should be assessed together in diabetic individuals. In addition, in the literature, the role of CD36 as an oxidant LDL receptor in macrophages is correlated with vascular damage associated with diabetes( Reference Gautam and Banerjee 1 , Reference Liani, Halvorsen and Sestili 26 , Reference Park 28 , Reference Martin, Chevrot and Poirier 30 , Reference Atamer, Ovunc and Yesil 31 ).
In type 2 DM patients, insulin resistance may be affected by sCD36 levels. Interestingly, we found a positive correlation between HOMA-IR and sCD36 levels in our study. Similar to this, Handberg et al.( Reference Handberg, Levin and Hojlund 23 ) previously proposed the relationship between insulin resistance and blood sCD36 levels and higher level of sCD36 in type 2 DM patients to reveal a role of sCD36 in the homoeostasis of glucose. Studies conducted on cardiomyocytes indicated that CD36 may be involved in GLUT4-mediated glucose transport, and cells may be involved in energy substrate intake( Reference Angin, Schwenk and Nergiz-Unal 32 ). Moreover, in this study, blood TAG and CD36 levels, which are related to visceral fat in organs such as heart and liver, were found to be correlated. In some studies, the relationship between CD36 and TAG levels was examined owing to its involvement in lipid metabolism, FAT and proposed some haploid gene variants( Reference Angin, Schwenk and Nergiz-Unal 32 , Reference Ramos-Arellano, Salgado-Bernabé and Guzmán-Guzmán 33 ). However, controlled human studies are limited to assess the relationship between CD36 and diabetes.
On the other hand, studies showed that CD36 receptor played a role as a chemo-sensory factor in different flavours and smells in selection of fatty foods( Reference Abumrad 34 , Reference Laugerette, Passilly-Degrace and Patris 35 ). Rodent studies found that CD36 takes place particularly in the lingual epithelium where taste buds are present, and it has high affinity with long-chain fatty acids( Reference Christiaens, Van Hul and Lijnen 27 , Reference Abumrad 34 , Reference Laugerette, Passilly-Degrace and Patris 35 ). However, in this study, it was determined that sCD36 levels and dietary preferences in type 2 DM patients were not associated. The reason for this may be owing to the small size of the sample, similarity of body composition and the fact that these data were recorded based on the participants’ own declarations.
In addition to genetic predisposition, obesity and food habits are among the risk factors in development of DM( Reference Gautam and Banerjee 1 , Reference Redmon, Caccamo and Flavin 5 , Reference Ekoe, Punthakee and Ransom 36 – Reference Boffetta, McLerran and Chen 38 ). Fat distribution in the body and the degree of obesity are also important conpounding factors in insulin sensitivity( Reference Boffetta, McLerran and Chen 38 ). In this study, the waist circumference (cm) and waist/hip ratio, among the risk factors and determining factors for the prognosis and metabolic effects of type 2 DM( Reference Saikumar, Sudha and Chandraselvi 39 – Reference Shah, Bhandary and Malik 41 ), differed between the groups; however, the values in the obtained data were significantly higher in the patient group. Shah et al. found that waist circumference and waist/hip ratios were significantly higher in the diabetic group than in the control group( Reference Shah, Bhandary and Malik 41 ). Thus, abdominal or visceral adiposity could cause lipogenesis and inflammation-mediated dysfunction of insulin signalling pathways. Nevertheless, abdominal fat and CD36 were not correlated in this study.
The energy density of the diet supports the hypothesis that fatty acid pattern, abdominal adiposity and visceral fat and fatty acids transporters such as CD36 and insulin signalling may be correlated with type 2 DM development. Although dietary energy density and carbohydrates are being investigated in studies on obesity and diabetes, fat and fatty acids were not largely investigated. However, it was reported in recent limited studies that dietary fatty acids might play an important role in postprandial glycaemic control and development of diabetes( Reference Liu, Li and Guan 6 , Reference Xu, Zhang and Huang 7 , Reference Rivellese and Lilli 42 , Reference Salas-Salvado, Martinez-Gonzalez and Bullo 43 ). Conversely, the relationships between sCD36 levels and the amount of daily dietary fat intake, fat type, fatty acids pattern and TAG levels were not significant in this study. Similarly, in the cross-sectional study conducted by Breen et al.( Reference Breen, Ryan and McNulty 44 ), it was reported that the contribution percentages of total fat, PUFA, MUFA and SFA for the daily energy intake were not different in diabetic patients in comparison with the control group. In a study conducted by Mumu et al.( Reference Mumu, Saleh and Afnan 45 ) on DM patients, the contribution percentages of total fat, PUFA and MUFA for the daily energy intake in patients were higher than their control group. Similarly, the fact that the ratio of n-6/n-3 fatty acids is about 15 in studies mentioned above is a consequence that is required to be assessed in degenerative diseases such as diabetes. The main reason for the differences in the results here may be that the daily food consumption records are taken for 1 d, and other dietary devastating factors such as socioeconomic level and geographical conditions are not included.
Furthermore, the amount of daily fat intake is as important as the composition of fatty acids( Reference Evert, Boucher and Cypress 46 ). Current studies suggest that olive oil has positive effects especially on endothelial function, inflammation and oxidative stress owing to the MUFA and phytochemical contents of olive oil( Reference Al Jamal and Ibrahim 47 ). In this study, it was determined that the consumption of olive oil was significantly lower in the group of type 2 DM patients than in the control group. Similarly, other studies emphasised the beneficial effects of MUFA and olive oil consumption in diabetes( Reference Salas-Salvado, Martinez-Gonzalez and Bullo 43 , Reference Evert, Boucher and Cypress 46 , Reference Al Jamal and Ibrahim 47 ). In another study, it was found that consumption of olive oil in diabetic patients was correlated with a decrease in fasting blood glucose, TAG, total cholesterol and LDL-cholesterol( Reference Al Jamal and Ibrahim 47 ). Thus, consumption of olive oil may have positive effects on blood glucose and lipid profile in patients with type 2 DM.
In summary, this study is one of the rare nutrition studies that examines the relationship between sCD36 fatty acid receptor and insulin resistance in individuals with type 2 DM. In conclusion, sCD36 levels may be an important parameter for patients with type 2 DM owing to its higher concentration in diabetic patients in comparison with the control group. More extensive clinical nutrition studies that examine the relationships among CD36 fatty acid receptor, insulin resistance and dietary fatty acid pattern might be considered for further evidence.
Acknowledgements
The authors thank the volunteers for their participation in the study.
This study was partly supported by Hacettepe University Scientific Research Projects Coordination Unit (Ankara, Turkey) for RNU.
M. E. carried out the data collection, analysis and helped to draft the manuscript. U. K. carried out the blood analysis. S. A. D. facilitated the data collection from the participants and finalised the manuscript. E. U. helped to finalise and submit the manuscript. R. N.-U. designed the study, conducted the data collection and analysis and finalised the manuscript. All authors read and approved the final manuscript.
The authors declare that there are no conflicts of interest.
Preliminary data of the study were presented as a poster in the 41st FEBS Congress, and the abstract was published in the FEBS Journal, Volume 283, Supplement, 1 September 2016.


