


Introduction
Human–wildlife conflict arises when the requirements of people and wildlife overlap, creating costs to both (Inskip & Zimmermann, Reference Inskip and Zimmermann2009). Carnivores are particularly predisposed to conflict with people because of their large home ranges, which often exceed the area of the remaining natural habitat, and their protein-rich dietary requirements, which are usually limited by reduced availability of prey (Treves & Karanth, Reference Treves and Karanth2003; Graham et al., Reference Graham, Beckerman and Thirgood2005; Khorozyan et al., Reference Khorozyan, Ghoddousi, Soofi and Waltert2015). Such conflict has contributed to global declines of most large carnivores (Woodroffe & Frank, Reference Woodroffe and Frank2005; Michalski et al., Reference Michalski, Boulhosa, Faria and Peres2006), with up to 50% of Amur tiger Panthera tigris altaica (Miquelle et al., Reference Miquelle, Nikolaev, Goodrich, Litvinov, Smirnov, Suvorov, Woodroffe, Thirgood and Rabinowitz2005) and 75% of mountain lion Puma concolor deaths attributed to conflict with people (Weaver et al., Reference Weaver, Paquet and Ruggiero1996).
Historical evidence indicates that of the large cats, tigers may experience the most conflict with people (McDougal, Reference McDougal, Tilson and Seal1987), with the number of people killed by tigers ranging from < 1 per year in the Russian Far East (Miquelle et al., Reference Miquelle, Nikolaev, Goodrich, Litvinov, Smirnov, Suvorov, Woodroffe, Thirgood and Rabinowitz2005) to dozens per year in the Sundarbans of Bangladesh and India (Barlow, Reference Barlow2009). However, livestock depredation is the most common cause of human–tiger conflict worldwide (Goodrich, Reference Goodrich2010). Conflict can lead to negative attitudes towards tigers, their lethal control or removal from the wild by authorities, retribution killing by local communities, and increased poaching, with poachers taking advantage of tigers depredating livestock (Gurung et al., Reference Gurung, Smith, McDougal, Karki and Barlow2008; Goodrich, Reference Goodrich2010). The scale and occurrence of conflict may be affected by habitat, availability of wild prey, livestock management, human activities, and socio-economic and landscape factors (Inskip & Zimmermann, Reference Inskip and Zimmermann2009).
The forests of lowland Nepal and northern India were once continuous along the base of the Himalayas and supported a dense population of tigers (Smith et al., Reference Smith, Ahearn and McDougal1998). Since the 1950s, however, forest conversion and fragmentation in Nepal have resulted in tigers being confined to five protected areas (Dhakal et al., Reference Dhakal, Karki (Thapa), Jnawali, Subedi, Pradhan and Malla2014). Human–tiger conflict, poaching for illegal trade, and lack of habitat connectivity have been identified as common persistent threats for tigers in Nepal (Dhakal et al., Reference Dhakal, Karki (Thapa), Jnawali, Subedi, Pradhan and Malla2014), and a study in Chitwan National Park showed a general increase in human–wildlife conflict during 2003–2013 (Silwal et al., Reference Silwal, Kolejka, Bhatta, Rayamajhi, Sharma and Poudel2017). In Chitwan the deterioration of grassland as a result of the natural succession process and the invasion of the alien species Mikania micrantha has been identified as an additional threat because grasslands are a key habitat for the tiger's main prey, the spotted deer Axis axis. The Chitwan tigers are also reported to be increasingly dispersing to regions outside the National Park, making them more vulnerable to retaliatory killings in response to attacks on people and livestock (DNPWC, 2013).
Since the late 1990s tiger habitat in Chitwan has been improved as a result of strict protection and habitat management interventions in core areas of the Park (DNPWC, 2013; Dhakal et al., Reference Dhakal, Karki (Thapa), Jnawali, Subedi, Pradhan and Malla2014) and the implementation of community-based forest management in the buffer zone (Gurung et al., Reference Gurung, Smith, McDougal, Karki and Barlow2008). These developments have favoured tiger recovery in both areas (Dhakal et al., Reference Dhakal, Karki (Thapa), Jnawali, Subedi, Pradhan and Malla2014; Karki et al., Reference Karki, Pandav, Jnawali, Shrestha, Pradhan and Lamichhane2015) and the Chitwan population has become the source population for adjoining landscapes of Nepal and India (Karki et al., Reference Karki, Pandav, Jnawali, Shrestha, Pradhan and Lamichhane2015), having increased from < 50 breeding adults in 1998 (Smith et al., Reference Smith, Ahearn and McDougal1998) to 120 in 2013 (Dhakal et al., Reference Dhakal, Karki (Thapa), Jnawali, Subedi, Pradhan and Malla2014).
Nevertheless, human–tiger conflict is still a major threat to maintaining the momentum of population increase as well as the long-term viability of the Chitwan tigers (Gurung et al., Reference Gurung, Smith, McDougal, Karki and Barlow2008; Dhakal et al., Reference Dhakal, Karki (Thapa), Jnawali, Subedi, Pradhan and Malla2014). There are three reasons for this. Firstly, the impact of conflict-related mortality or removal is higher for such fragmented populations (Michalski et al., Reference Michalski, Boulhosa, Faria and Peres2006). Secondly, conflict is likely to increase as tiger numbers rise, especially in human-modified landscapes, such as the buffer zone (Gurung et al., Reference Gurung, Smith, McDougal, Karki and Barlow2008). Thirdly, conflict is critical if it involves human casualties, or loss of livestock that has a significant impact on local livelihoods (Bhattarai & Fischer, Reference Bhattarai and Fischer2014). Thus, the situation requires the development of effective conservation strategies that will reduce the effects of predators on people and their livelihoods and help maintain the viability of predator populations (Woodroffe & Frank, Reference Woodroffe and Frank2005). A study of conflicts between people and wildlife (rhinoceroses Rhinoceros unicornis, tigers, sloth bears Melursus ursinus, elephants Elephas maximus, and wild boar Sus scrofa) in the vicinity of Chitwan National Park found that tigers were responsible for 21% of all wildlife attacks on people (Silwal et al., Reference Silwal, Kolejka, Bhatta, Rayamajhi, Sharma and Poudel2017).
We are aware that the expressions human–wildlife conflict and human–tiger conflict may be misleading, as they wrongly portray wildlife as antagonists with conscious intent to interfere with people's lives and livelihoods, whereas the real conflict is often between conservation and other human interests (Redpath et al., Reference Redpath, Bhatia and Young2015; Fisher, Reference Fisher2016). However, following other publications, we use the term conflict to describe negative interactions between people and wildlife. As conflict scenarios are complex and may vary according to species and local conditions (Inskip & Zimmermann, Reference Inskip and Zimmermann2009), systematic and detailed assessment of species-specific conflicts are crucial for developing effective conservation strategies (Graham et al., Reference Graham, Beckerman and Thirgood2005; Goodrich, Reference Goodrich2010). Unlike Silwal et al. (Reference Silwal, Kolejka, Bhatta, Rayamajhi, Sharma and Poudel2017), who focused only on wildlife attacks on people, considering site, season, time, activity, gender and awareness, we investigated attacks by tigers on both people and livestock, specifically (1) spatio-temporal patterns of human–tiger conflict, (2) its correlates, namely human population, livestock population, forest area in buffer zone, National Park frontage (defined as the length of Village Development Committee/municipality boundary abutting the Park), rainfall and temperature, and (3) its causes and contexts. The correlates were identified mainly from a review of literature on conflict (Graham et al., Reference Graham, Beckerman and Thirgood2005; Michalski et al., Reference Michalski, Boulhosa, Faria and Peres2006; Dar et al., Reference Dar, Minhas, Zaman and Linkie2009; Goodrich et al., Reference Goodrich, Seryodkin, Miquelle and Bereznuk2011; Gubbi, Reference Gubbi2012; Soh et al., Reference Soh, Carrasco, Miquelle, Jiang, Yang and Stokes2014). We predicted that larger human populations, livestock populations, forest area in the buffer zone, and National Park frontage would correlate with higher levels of human–tiger conflict. Conversely, we expected higher levels of conflict during periods of lower rainfall, because of the probable impact on plant productivity (and consequently on wild prey biomass), and also during periods of lower temperature (e.g. winter months), because of the resulting physical stress on tigers (Goodrich et al., Reference Goodrich, Seryodkin, Miquelle and Bereznuk2011). Regarding causes, we predicted lower densities of wild prey would result in higher levels of human–tiger conflict (Miquelle et al., Reference Miquelle, Nikolaev, Goodrich, Litvinov, Smirnov, Suvorov, Woodroffe, Thirgood and Rabinowitz2005), and that male tigers would be more likely to be involved in conflict than female tigers because of their greater resource (e.g. food, space) requirements (Karanth, Reference Karanth2003).
Study area
The study was conducted in Chitwan National Park and its buffer zone, including all or part of 34 Village Development Committees and two municipalities (Fig. 1a). Designated as Nepal's first protected area in 1973, Chitwan covers 932 km2 in south-central Nepal, on the border with India. A UNESCO world heritage site since 1984, the Park is a global biodiversity hotspot and is part of a complex that includes Parsa Wildlife Reserve in the east and Valmiki Tiger Reserve (India) in the south. The complex is one of the 19 priority tiger conservation landscapes of the Indian subcontinent. Chitwan National Park comprises mainly sal Shorea robusta forests (73%), followed by grasslands (12%), riverine forests (7%), exposed surfaces (i.e. sandy banks of rivers and riverine islands, and other eroded areas; 5%) and water bodies (3%; Thapa, Reference Thapa2011). In 2013 tiger density was estimated to be 3.84 per 100 km2, with an estimated density of wild prey of 73.63 individuals per km2 (Dhakal et al., Reference Dhakal, Karki (Thapa), Jnawali, Subedi, Pradhan and Malla2014).

Fig. 1 (a) Land cover in Chitwan National Park and its buffer zone, with park management sectors, and the Village Development Committees/municipalities in the buffer zone. (b) Locations where people were killed or injured, and extent of livestock depredation, by tigers in Chitwan National Park and its buffer zone during 2007–2014.
The 750 km2 buffer zone surrounding the Park is mainly composed of forest patches, farmland and human settlements, with an estimated human population density of 347 individuals km−2 (mean for Nepal was 180 individuals km−2 in 2012), living in 45,616 households (DNPWC, 2013). The majority are subsistence farmers who depend on the forests of the buffer zone and even the Park itself (although this is restricted) for fodder, fuelwood, thatch grass, medicinal plants and livestock grazing (DNPWC, 2013). Livestock husbandry is the main local livelihood, providing dairy products, manure, protein, and draught animal power for tilling and carriage.
Methods
Spatio-temporal patterns of human–tiger conflict and mapping
We collected data on human casualties and incidents of livestock depredation that occurred during 2007–2014 from the Chitwan National Park office, mainly recorded as compensation applications (Gubbi, Reference Gubbi2012), and from verifiable anecdotal records (especially of human casualties within the Park). The human casualty data included type (killed or injured), date, location (Park or buffer zone) and coordinates of human casualties recorded using a hand-held global positioning system (GPS) unit. The livestock depredation data included livestock type (cattle, buffalo, goats, sheep or pigs), date and location (Village Development Committee/municipality of buffer zone). A mechanism has been established in Chitwan National Park to validate attacks and process compensation applications, to avoid false claims and exaggerations (Thapa, Reference Thapa2011; Dhungana et al., Reference Dhungana, Savini, Karki and Bumrungsri2016).
We triangulated and expanded the data set of human casualties by conducting questionnaire surveys with victims, their family members, and other people familiar with attacks (n = 54). We also gathered livestock depredation data by surveying 10% of the livestock owners who had lost livestock (n = 29), chosen at random. The consistency of the questionnaire data with official records enhanced our confidence to use the data on livestock depredation without further checks (Dhungana et al., Reference Dhungana, Savini, Karki and Bumrungsri2016). The surveys were conducted in Nepalese, with the consent of all respondents. The surveys were conducted during May–November 2015.
We conducted linear modelling using R v. 3.2.3 (R Development Core Team, 2015) to examine trends in human casualties and livestock depredation during 2007–2014. We used the Shapiro–Wilk normality test and a non-constant variance score test to check the assumptions of normality and homogeneity, respectively. We used χ2 goodness-of-fit tests to examine spatial (national park/buffer zone, Village Development Committee/municipality) and temporal (yearly, seasonal, monthly) patterns of human casualties and livestock depredation (Goodrich et al., Reference Goodrich, Seryodkin, Miquelle and Bereznuk2011). Seasons were defined as summer (16 February–15 June), monsoon (16 June–15 October) and winter (16 October–15 February). We also used the χ2 test to investigate whether losses of cattle, buffalo, goats, sheep and pigs were proportional to their relative availabilities in the buffer zone, as recorded in a 2011–2012 census (CBS, 2013). We used the Bonferroni confidence interval method to determine which of the five livestock species suffered losses significantly different than expected from relative availabilities, and calculated their percentage deviation from expected attack rates (Iliopoulos et al., Reference Iliopoulos, Sgardelis, Koutis and Savaris2009).
A conflict map was created using ArcGIS 10 (ESRI,Redlands, USA), using map data available from the Department of National Parks and Wildlife Conservation, to depict the locations and extent of human casualties and livestock depredation. Sites where human casualties occurred were shown by plotting GPS points and their shortest distance (km) from the National Park boundary, measured using ArcGIS 10. For livestock depredation, Village Development Committees/municipalities in the buffer zone were categorized and mapped based on the number of cases that occurred during 2007–2014: very high (> 50), high (11–50), low (1–10) and no depredation (Pant et al., Reference Pant, Dhakal, Pradhan, Leverington and Hockings2016).
Correlates of human–tiger conflict
We collected data on the human populations of each Village Development Committee/municipality from a 2011 census (CBS, 2012). We calculated the total livestock populations of each Village Development Committee/municipality from mean livestock densities in the various districts recorded in a 2011–2012 census (CBS, 2013). Similarly, we computed the forest area (km2) and National Park frontage (km) of each Village Development Committee/municipality from maps (2011) available from the Department of National Parks and Wildlife Conservation, using ArcGIS 10. We collected monthly and yearly rainfall and monthly temperature data for Rampur station (c. 10 km from Chitwan National Park) for 2007–2014 from the Department of Hydrology and Meteorology.
Collating data for 36 Village Development Committees/municipalities in the buffer zone, we performed a Spearman correlation analysis to assess the general bivariate relationships between the frequencies of human casualties and livestock depredation and the following variables: human population, livestock population, forest area in buffer zone, and National Park frontage (Gubbi, Reference Gubbi2012). For this analysis human casualties that occurred within the Park were assigned to the adjacent Village Development Committees/municipalities in the buffer zone. Similarly, collating data for years/months, we conducted a Spearman correlation analysis with rainfall and temperature.
Causes and contexts of human–tiger conflict
Using the 2013 survey data available from the Department of National Parks and Wildlife Conservation (collected from line transect surveys conducted jointly by the Department of National Parks and Wildlife Conservation, the Department of Forests, WWF Nepal, and the National Trust for Nature Conservation), we computed overall densities of wild prey in the four sectors of Chitwan National Park (eastern, Kasara, western and Madi; Fig. 1a), using Distance 6.0 (Thomas et al., Reference Thomas, Buckland, Rexstad, Laake, Strindberg and Hedley2010), and using the best fit model with a minimum Akaike information criterion value. Besides fulfilling the recommended 60 detections, the prey density estimates conformed to the underlying assumptions of model fitting (Buckland et al., Reference Buckland, Anderson, Burnham and Laake2005). We collated the data on attacks on people and livestock for each sector by summing the data of adjacent Village Development Committees/municipalities. Similarly, from the Chitwan National Park office and anecdotal records we collected details of tigers removed from the wild by the authorities (following attacks on people or livestock, or because the tigers posed a potential threat), or killed by local people in retaliation. In addition, from the Chitwan National Park office and questionnaire surveys with victims, their family members, and other people familiar with attacks (n = 54), we collected information on the behaviour of tigers and people that led to attacks (accidental meetings, predation attempts by tigers, provocation by people; Goodrich et al., Reference Goodrich, Seryodkin, Miquelle and Bereznuk2011), activity of victims during attack, and attack sites. Information regarding behaviour that led to attacks was based on what people said, information provided by park staff involved in tiger tracking, and the descriptions of removed tigers and victims in park records. There was no other way to verify this information.
We used Spearman correlations to test whether human casualties or depredation of livestock by tigers varied proportionally with wild prey densities, to determine if wild prey density was an underlying cause of human–tiger conflict. We used χ2 tests to determine if male and female tigers were removed (for conflict reasons) in proportion to their relative availabilities (populations). The availability data were obtained from a 2010 tiger census (Karki et al., Reference Karki, Pandav, Jnawali, Shrestha, Pradhan and Lamichhane2015).
Results
Extent and nature of human–tiger conflict
During 2007–2014 there were 54 human casualties (32 killings and 22 injuries) resulting from tiger attacks, and 351 incidents of livestock depredation, in 305 attacks on 292 households (Table 1). More than half of the livestock killings (55%) were of goats, followed by cattle (23.4%), buffalo (11.9%), pigs (7.7%) and sheep (2%). Livestock losses to tigers varied significantly among species, as expected from their relative availabilities (χ2 = 37.71, df = 4, P < 0.0001). Bonferroni confidence interval analysis revealed that cattle, goats and sheep were killed in proportion to their relative availabilities, whereas buffalo were killed 35% less than expected, and pigs 140% more than expected (P < 0.01; Table 2). A mean of 1.15 individuals (range 1–5) were killed per attack, although most incidents (nearly 90%) involved the killing of a single animal.
Table 1 Numbers of human casualties and livestock lost as a result of tiger Panthera tigris attacks in Chitwan National Park, Nepal, and its buffer zone (Fig. 1) during 2007–2014

Table 2 Prey selection by tigers amongst the five livestock species in Chitwan National Park and its buffer zone (Fig. 1) during 2007–2014, based on Bonferroni interval analysis.

* Significant at P < 0.01
Spatial patterns of human–tiger conflict and mapping
Tiger attacks were clustered in defined areas, and human casualties were significantly higher (χ2 = 13.50, df = 1, P < 0.001) in the buffer zone (75.9%) than in the Park (Fig. 1b). Spatial analysis showed that two-thirds of human casualties occurred within 1 km of the Park boundary and that nearly 80% (n = 43) occurred within 2 km (mean = 1.22 ± SD 1.55 km, range 0–6.10 km). Of 36 Village Development Committees/municipalities in the buffer zone, 22 experienced human casualties (mean = 2.45, range 1–6) during the 8-year study period. Thirty of the 36 Village Development Committees/municipalities experienced livestock depredation (mean = 11.7, range 1–89) over the period. Twenty-five percent of Village Development Committees/municipalities suffered high livestock depredation rates (one with very high depredation, > 50; eight with high depredation, 11–50), nearly 60% (n = 21) had low depredation rates (1–10), and no cases of depredation were recorded in the other six (Fig. 1b). The Village Development Committees/municipalities did not suffer livestock losses proportional to the relative availabilities of livestock (χ2 = 524.82, df = 35, P < 0.0001). Ayodhyapuri Village Development Committee (in the southern section of the Park), which accounted for > 25% (n = 89) of all depredation incidents, had losses 47% greater than expected.
Temporal patterns of human–tiger conflict
During 2007–2014 tigers killed a mean of 4 ± SD 3.25 people annually (range 0–8) and injured 2.75 ± SD 1.58 (range 0–5), and a linear model indicated there was a significant increase in human casualties during this period (Table 3). During the same period tigers killed a mean of 43.88 ± SD 22.27 livestock per year (range 17–81) but there was no significant change in livestock depredation during this period (Table 3). The number of human casualties did not vary among years (χ2 = 11.78, df = 7, P > 0.05), seasons (χ2 = 0.33, df = 2, P > 0.05) or months (χ2 = 9.11, df = 11, P > 0.05). The number of cases of livestock depredation varied among months (χ2 = 12.78, df = 11, P < 0.0001), being highest in July (15%; n = 54) and lowest in August (n = 13), and among years (χ2 = 79.15, df = 7, P < 0.0001). The seasons did not affect this variation (χ2 = 2.58, df = 2, P > 0.05).
Table 3 Results of simple linear regression models that explain changes in tiger attacks in Chitwan National Park and its buffer zone (Fig. 1) as a function of the years 2007–2014.

* Significant at P < 0.05
Correlates of human–tiger conflict
No significant correlation was found between human casualties and any of the variables examined (Table 4). However, for livestock depredation we found a significant positive correlation with National Park frontage (rs = 0.38, n = 36, P = 0.024) but not with any of the other variables examined (Table 4).
Table 4 Spearman rank correlations (r s) of human casualties and incidents of livestock depredation with seven independent variables in Chitwan National Park and its buffer zone (Fig. 1).

* Significant at P < 0.05
Causes and context of human–tiger conflict
Neither human casualties nor livestock depredation were correlated with density of wild prey (rs = −0.74, n = 4, P = 0.26; rs = −0.20, n = 4, P = 0.8). More male tigers were removed (73.3%) because of conflict than females (χ2 = 14.05, df = 1, P < 0.001), in contrast to that expected from their relative availabilities (populations). During the study period 11 males and four females were removed, 13 following attacks on people or livestock, and two for posing potential threats. Five were killed (four by local people in retribution and one by the authorities), and the remainder were relocated into the wild or to zoos, or died in captivity. Over 75% (n = 42) of attacks on people occurred during accidental meetings. Nearly 20% of attacks were on people sleeping or working at home (n = 2) or fishing in the river (n = 8). Provocation by people attempting to retrieve a human body resulted in one death and one injury. The number of attacks varied with victims’ activity (Fig. 2a), with more than half (53.7%) occurring while the victims were collecting fodder or fuelwood (including grass and thatch grass), and across site types (χ2 = 32.85, df = 4, P < 0.0001), with nearly half (48.2%) occurring in forests of the buffer zone (Fig. 2b).
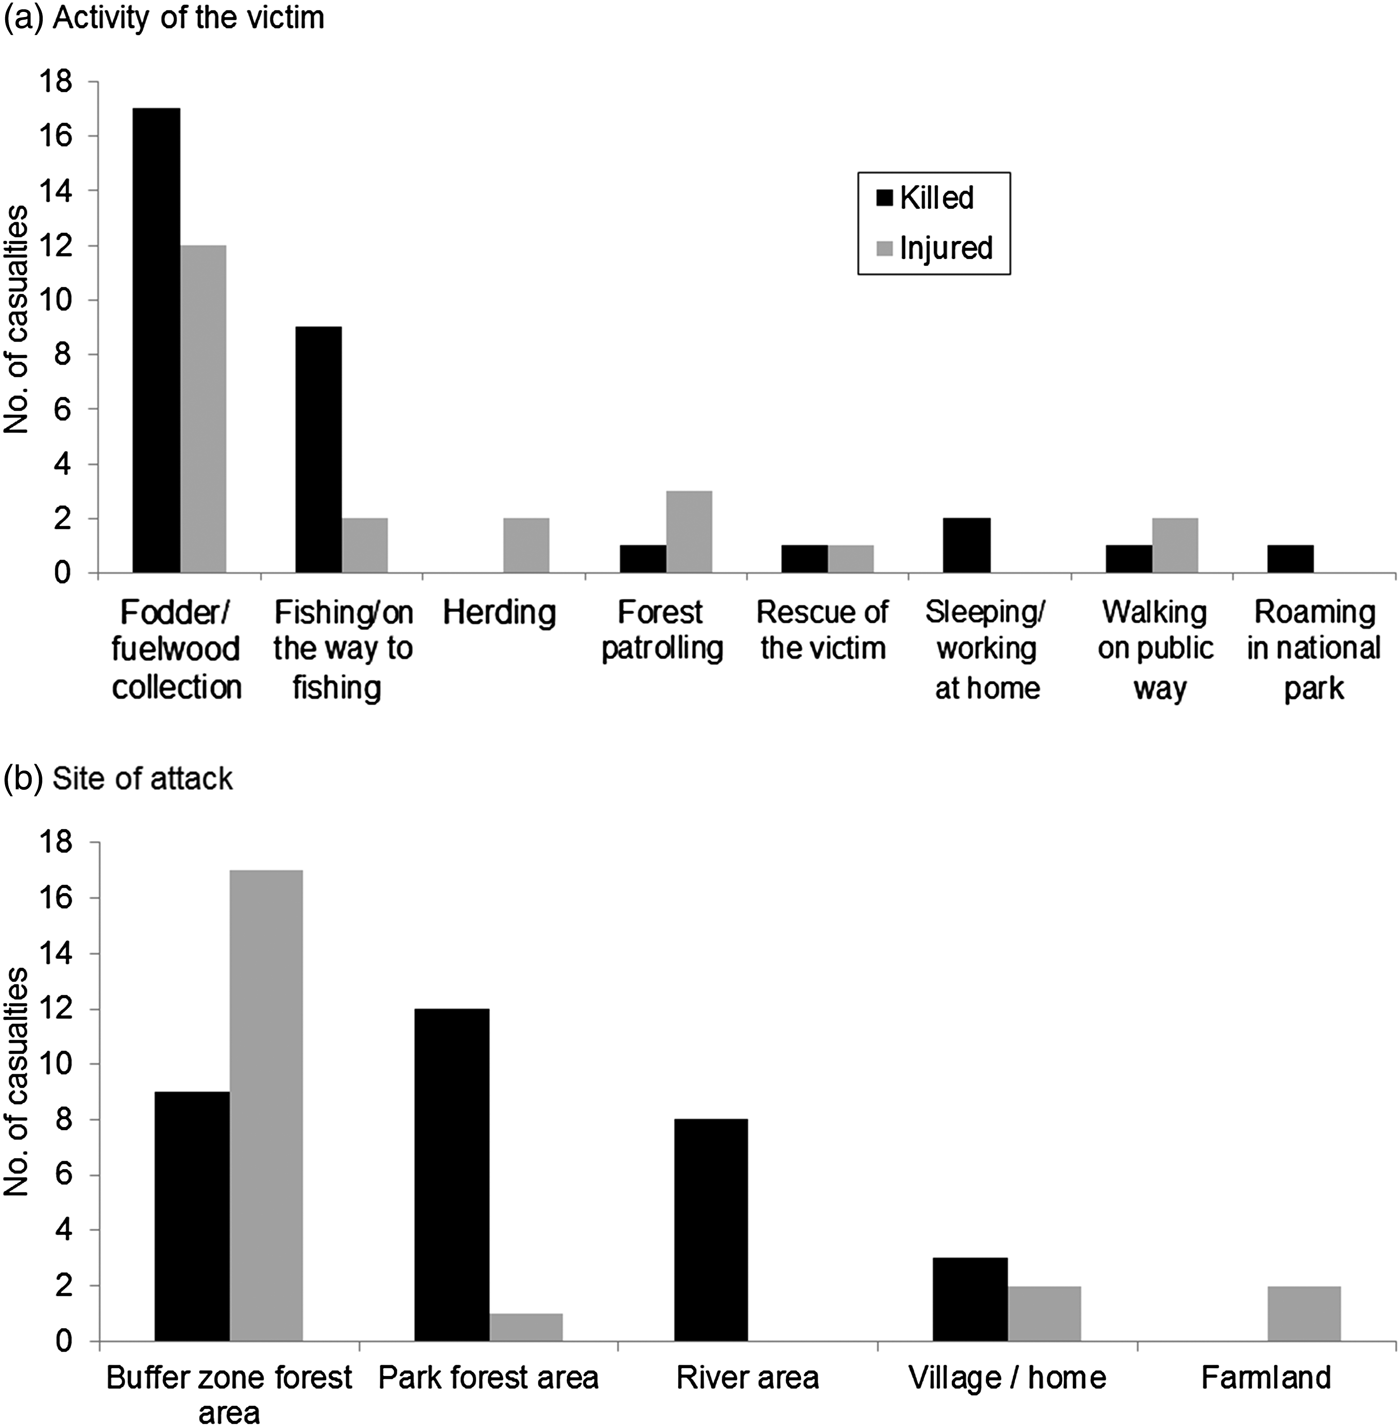
Fig. 2 Numbers of people killed or injured by tigers in Chitwan National Park and its buffer zone (Fig. 1) during 2007–2014, by (a) the activity of the victim and (b) site.
Discussion
Characteristics of human–tiger conflict
The scale of human casualties and livestock depredation was within the range reported elsewhere (Miquelle et al., Reference Miquelle, Nikolaev, Goodrich, Litvinov, Smirnov, Suvorov, Woodroffe, Thirgood and Rabinowitz2005; Barlow, Reference Barlow2009). For human casualties there were some discrepancies between our findings and those of Silwal et al. (Reference Silwal, Kolejka, Bhatta, Rayamajhi, Sharma and Poudel2017), probably because of differences in the data sources used. We report 44 cases of human killings and human injuries during 2007–2013, whereas Silwal et al. (Reference Silwal, Kolejka, Bhatta, Rayamajhi, Sharma and Poudel2017) reported 47 cases. We relied mainly on park office records, followed and augmented by questionnaire surveys, whereas Silwal et al. (Reference Silwal, Kolejka, Bhatta, Rayamajhi, Sharma and Poudel2017) primarily collected data from group discussions, key stakeholder interviews, field observations, and questionnaire surveys, and, as a secondary source, obtained demographic information about the victims from the authorities. We considered only the cases of injuries for which medical treatment was required, whereas it is not clear whether Silwal et al. (Reference Silwal, Kolejka, Bhatta, Rayamajhi, Sharma and Poudel2017) also considered cases that did not require medical treatment. Despite having a wide dietary breadth, tigers are selective predators and prefer to kill prey weighing 60–250 kg (Hayward et al., Reference Hayward, Jedrzejewski and Jedrzewska2012). Thus, attacks on buffalo (300–600 kg) are limited, whereas pigs (60–120 kg) are killed in a higher proportion than expected based on their availability. Moreover, in terms of size and weight the domestic pig is comparable to the wild pig, which is a preferred prey of the tiger (Hayward et al., Reference Hayward, Jedrzejewski and Jedrzewska2012). Goats, the most depredated livestock species (55%), were killed proportionally to their relative availability. However, leopards Panthera pardus killed goats 19% more than expected from their relative availability amongst all livestock species combined. Goats accounted for 87.7% of all incidents of livestock killing by leopards (n = 332; R. Dhungana, unpubl. data), which may explain leopards’ coexistence with tigers given their inclination towards smaller prey (Hayward et al., Reference Hayward, Jedrzejewski and Jedrzewska2012).
Our results revealed a higher proportion of human casualties in the buffer zone (> 75%), with a greater clustering around the Park boundary. Although it has been argued that people and tigers coexist through temporal separation of space use (Carter et al., Reference Carter, Shrestha, Karki, Pradhan and Liu2012), higher levels of human activity in the forests around the Park boundary (including inside the Park, where the forest is in better condition but is restricted for utilization) during both day and night, mainly for collection of fodder and fuelwood, may have reduced temporal separation, resulting in a greater clustering of tiger attacks. The proportion of human casualties in the buffer zone (75.9%) in our study was higher compared to previous periods (34.8% during 1979–1997 and 56.9% during 1998–2006; Gurung et al., Reference Gurung, Smith, McDougal, Karki and Barlow2008). This shift in tiger attacks from inside to outside the Park may be attributable to the increase of restored forest in the buffer zone since 1998 (i.e. the inception of community forests) and to the consequent use of these forests by people (Gurung et al., Reference Gurung, Smith, McDougal, Karki and Barlow2008; DNPWC, 2013). The increase in human casualties could also result in higher tiger mortality rates, making such areas ecological traps (Northrup et al., Reference Northrup, Stenhouse and Boyce2012). Considering the increasing importance of buffer zones for wide-ranging tigers, some spatial separation with people is necessary to minimize both human and tiger mortality (Treves & Karanth, Reference Treves and Karanth2003; Goodrich, Reference Goodrich2010). The escalation in the rate of tiger attacks outside the Park could discourage local communities from promoting reforestation in the buffer zone. However, such discouragement may not arise because access to forest resources inside the Park is restricted, and local people depend on buffer zone forests, and gain multiple benefits from the Park.
We recorded greater clustering of human casualties around the northern boundary between Kasara and the western sectors (Fig. 1a,b). This could be related to a number of factors: the close proximity of people and tigers in the area, which is surrounded by human settlements; anthropogenic pressure (i.e. fishing) in the Narayani River; and the occasional presence of human corpses in the river, which could attract and provoke man-eating behaviour among tigers (this latter argument is a speculation and needs further study for verification). A spatial analysis of these details involving identification of the most sensitive areas could help to focus research and mitigation efforts. The spatial location of human casualties (Fig. 1b) appears to contrast with the results of Silwal et al. (Reference Silwal, Kolejka, Bhatta, Rayamajhi, Sharma and Poudel2017): our findings indicate clustering of human casualties around the northern boundary between Kasara and the western sectors of the Park, whereas Silwal et al. (Reference Silwal, Kolejka, Bhatta, Rayamajhi, Sharma and Poudel2017) did not show such a pattern. The difference could be related in part to the different time scales of the study periods in question (2007–2014 in our study vs 2003–2013 in that of Silwal et al., Reference Silwal, Kolejka, Bhatta, Rayamajhi, Sharma and Poudel2017); six of 10 human casualties in 2014 occurred between Kasara and the western sectors, which affected the patterns.
Our results indicate a significant increase in human casualties during 2007–2014 as a result of the regeneration of forests in the buffer zone, which attracted dispersing tigers from inside the Park (Gurung et al., Reference Gurung, Smith, McDougal, Karki and Barlow2008). Moreover, habitat degradation caused by the invasive Mikania micrantha and the conversion of grasslands into woodlands (e.g. grassland cover has decreased from 20 to 12% since the 1970s) inside the Park (DNPWC, 2013) might also have contributed to tiger dispersal. The restored buffer zone, which was formerly used for livestock grazing, is now used by people for fodder and other forest resources (Gurung et al., Reference Gurung, Smith, McDougal, Karki and Barlow2008), resulting in increased proximity of people and tigers. However, fewer people were killed per year during 2007–2014 (4) than during 1998–2006 (7.2). The higher number of kills per year during 1998–2006 may reflect a high variance in number of kills among years (Gurung et al., Reference Gurung, Smith, McDougal, Karki and Barlow2008). The trend of livestock depredation showed non-significant variation during 2007–2014, mostly because of the prohibition of grazing in buffer zones (Gurung et al., Reference Gurung, Smith, McDougal, Karki and Barlow2008), an increasing trend in stall feeding of livestock, the introduction of improved breeds, remittance and other alternative income sources, and changes in lifestyle. In addition, increased prey density (62.6 animals per km2 in 2008, Karki et al., Reference Karki, Jnawali, Shrestha, Pandey, Gurung and Thapa2009; 73.63 in 2013, Dhakal et al., Reference Dhakal, Karki (Thapa), Jnawali, Subedi, Pradhan and Malla2014) might have checked livestock losses.
Although tigers are reported to attack people for several reasons (i.e. reproductive status, age, physical stress, anthropogenic disturbance; Miquelle et al., Reference Miquelle, Nikolaev, Goodrich, Litvinov, Smirnov, Suvorov, Woodroffe, Thirgood and Rabinowitz2005; Gurung et al., Reference Gurung, Smith, McDougal, Karki and Barlow2008; Goodrich et al., Reference Goodrich, Seryodkin, Miquelle and Bereznuk2011), human casualties were not associated with any of the variables we examined. The highest proportion of livestock depredation (25.35%) in a single Village Development Committee occurred in Ayodhyapuri, which has the longest boundary with the National Park (19.37 km; mean = 6.42). The absence of other correlations suggests that tiger attacks may be attributable to unexamined factors (e.g. livestock guarding status and grazing site, corral type, herd size or composition, habitat quality, distribution of settlements, density of roads, status of community forests in buffer zone, and the density of the main wild prey species of tigers, especially spotted deer, wild pigs, and sambar deer Rusa unicolor).
Although a low density of wild prey has been commonly blamed for increased human–tiger conflict (Miquelle et al., Reference Miquelle, Nikolaev, Goodrich, Litvinov, Smirnov, Suvorov, Woodroffe, Thirgood and Rabinowitz2005; Goodrich, Reference Goodrich2010), there are several possible reasons for the failure to test this hypothesis. Firstly, although carnivores do not necessarily switch their diet from wild prey to livestock, even if livestock are readily available (Odden et al., Reference Odden, Herfindal, Linnell and Andersen2008; Meriggi et al., Reference Meriggi, Brangi, Schenone, Signorelli and Milanesi2011), tigers may kill livestock whenever an opportunity arises, regardless of the availability of wild prey (Graham et al., Reference Graham, Beckerman and Thirgood2005; Soh et al., Reference Soh, Carrasco, Miquelle, Jiang, Yang and Stokes2014). In Ranthambore National Park, India, despite high densities of wild prey, livestock still accounted for 10–12% of the tiger's diet, perhaps because of the prevalence of an extensive open livestock grazing system (Soh et al., Reference Soh, Carrasco, Miquelle, Jiang, Yang and Stokes2014). However, in Bardia National Park, Nepal, more livestock depredation was reported in areas where the availability of wild prey was low (Bhattarai & Fischer, Reference Bhattarai and Fischer2014).
Although grazing in the buffer zone of Chitwan National Park is prohibited (Gurung et al., Reference Gurung, Smith, McDougal, Karki and Barlow2008; DNPWC, 2013), unauthorized livestock grazing occurs in grassland and wetland areas in the buffer zone, where livestock are more susceptible to tiger attacks. This practice, coupled with a poor livestock husbandry system (i.e. failure to use proper corrals at night, and unattended or poorly guarded grazing; RD, pers. obs.), may have affected the rates of livestock depredation. Thus, unless well-managed livestock husbandry systems are put in place, a decrease in livestock depredation may not correlate with an increase in wild prey densities. An increase in wild prey may even escalate conflict because of a potential increase in the density of predators (Suryawanshi et al., Reference Suryawanshi, Bhatnagar, Redpath and Mishra2013).
Tigers removed because of conflict were mostly male (73%), despite the fact that the overall male : female ratio was 1 : 2.7 in 2010 (Karki et al., Reference Karki, Pandav, Jnawali, Shrestha, Pradhan and Lamichhane2015). This may be because males have greater dietary requirements, larger home ranges, shorter tenure (i.e. they may be displaced from a territory by another male) and longer dispersal distances than females, and come into competition with other males (Sunquist, Reference Sunquist1981; Karanth, Reference Karanth2003). In the Indian Sundarbans the majority of straying tigers are males (68.5%; Das, Reference Das2012).
Implications for conflict mitigation and conservation
Human–tiger conflict reduction measures in Chitwan have been mostly reactive, following major incidents. Preventive measures, such as zoning, can reduce conflict by separating people and livestock from tigers in forested habitats and corridors (Goodrich, Reference Goodrich2010). Although zoning is already in place, the higher occurrence of human casualties (72.2%) in the forested areas of the Park and buffer zone underscores the need for its effective enforcement. Park authorities could use the conflict map developed here to optimize the use of their limited resources by prioritizing implementation of preventive measures (e.g. zoning enforcement and livestock husbandry improvement).
Overall, little has been done to help manage livestock to minimize human–tiger conflict. Conflict minimization measures could be categorized as those required when livestock encroach on tiger habitat (forest) and those required when tigers enter livestock sheltered areas. Discouragement of free grazing, especially in forested areas, promotion of stall feeding, improved vigilance, and keeping better-guarded, smaller herds could reduce the loss of livestock in tiger habitats. In addition, the improvement of corrals, increased vigilance at night, installing electricity supplies in villages, and the use of dogs could minimize losses from livestock sheltered areas (Dar et al., Reference Dar, Minhas, Zaman and Linkie2009; Bhattarai & Fischer, Reference Bhattarai and Fischer2014). Park authorities, in collaboration with Livestock Development Offices, could implement promotional programmes for the replacement of large herds of low-productive local breeds with smaller herds of improved breeds, to help farmers protect their stocks more efficiently and earn higher incomes (Treves & Karanth, Reference Treves and Karanth2003).
Chitwan National Park introduced a participatory tiger monitoring initiative (using camera traps) in two Village Development Committees (Gunjanagar and Divyanagar) in the buffer zone in 2012 and 2013. This initiative, which involved training local youths, has been crucial in acquiring knowledge of the presence of tigers in community forests, helping to identify potentially dangerous tigers, and providing early warning to local people (Bhupal Kandel, pers. comm.). This initiative could develop local tiger experts and, if replicated in other, higher-conflict zones (e.g. Narayani River area, Ayodhyapuri Village Development Committee), could minimize conflict and aid in tiger removal. At present, tiger management decisions in Chitwan are usually made arbitrarily (Gurung et al., Reference Gurung, Smith, McDougal, Karki and Barlow2008) and removals are executed by a Quick Response Team, prioritizing the removal of man-eating tigers (those killing > 1 people) from the buffer zone. We suggest that tiger removal should be undertaken only when necessary, with the focus being on maintaining the population in the wild (Treves & Karanth, Reference Treves and Karanth2003; Goodrich, Reference Goodrich2010). This would necessitate the development of well-defined tiger management protocols, which Chitwan National Park is currently lacking. We cannot rule out the occurrences of tiger poaching, especially at the edges of the Park, despite security measures being in place.
Compensation payments for wildlife attacks are administered by the park authorities and have been criticized (Ogra & Badola, Reference Ogra and Badola2008). Although 10% of the total possible payment is provided rapidly following an incident (in the case of death or serious injury to people), disbursement of the full payment takes months, and sometimes up to a year. The establishment of a reserve fund to accelerate payments could help minimize animosity and economic hardship. Varying the rates of compensation for livestock depredation according to where the attacks take place (e.g. forest, cattle shed) could reduce financial liability, and the promotion of an insurance scheme (especially for livestock) could be a long-term strategy to reduce the financial burden on the government and maintain sustainability. However, such measures need to be reinforced with educational activities to enhance local awareness and garner support for the conservation of tigers and other carnivores. We passed our recommendations to the appropriate authorities. Subsequently, in 2015 the compensation directive was amended, simplifying the compensation procedure to ensure faster payment, and increasing the rates of compensation paid for attacks by tigers on people and livestock. The government and private sector have also begun promoting an insurance scheme for livestock.
Acknowledgements
We thank the Rufford Small Grants Foundation (UK), Prince of Songkla University, and Thailand International Development Cooperation Agency for financial support, and the Department of National Parks and Wildlife Conservation and Chitwan National Park for granting permission for the study and sharing data. We acknowledge the support of field assistants and National Park and buffer zone officials in data collection and verification in the field, George Gale and Tenzan Eaghll for assistance with editing, and Robert Steinmetz and two anonymous reviewers for their useful comments.
Author contributions
RD conceived the project and contributed to its design, conducted field work and data collection, analysed the data, contributed materials and analysis tools, and prepared figures and tables. TS and SB contributed to project design and data analysis. JBK and MD contributed to project design. BRL collected data and prepared the map figures using ArcGIS. All authors co-wrote the article.
Biographical sketches
Rajendra Dhungana is interested in examining conflicts and the socio-ecological aspects of wildlife conservation. Tommaso Savini is interested in the behavioural ecology of mammals. Jhamak Bahadur Karki has experience in protected area management and has conducted surveys of tigers and their prey in Nepal. Maheshwar Dhakal is interested in natural resource economics and is involved in policy analysis of protected areas. Babu Ram Lamichhane is interested in GIS and analysing dietary aspects of carnivores. Sara Bumrungsri is interested in the habitat and social behaviour of mammals.


