Type 1 diabetes (T1D) is partly characterised by a higher prevalence of cardiovascular disease (CVD). Despite low density lipoprotein cholesterol (LDL-C) being a commonly treated target, apolipoprotein B (Apo B) has been shown to be a superior predictor of CVD and discordance between these two markers may predispose patients to altered risk( Reference Otvos 1 ). The distribution of LDL-C also contributes to these risks, with LDL III & IV fractions possessing greater atherogenic potential( Reference Vergès 2 ). Few studies have investigated LDL-C quality and it's discordance with Apo B in relation to the nutritional intake of patients with intensively controlled Type 1 diabetes. The aim of this study was to address this dearth of research.
Following ethical approval and informed consent 28 patients (32 % male; 68 % female) (mean age 48 ± 15) were asked to complete a food frequency questionnaire (FFQ), donate a sample of blood and allow the authors access to their medical records to determine HbA1c. The initial FFQ responses were processed using FETA software. The blood sample was analysed for LDL-C, constituent subfractions and Apo B. All data were interrogated using descriptive statistics. Dichotomous dependent variables pertaining to LDL-C and Apo B were compared using McNemar's test and correlations between dietary variables were determined with Spearman's rho test.
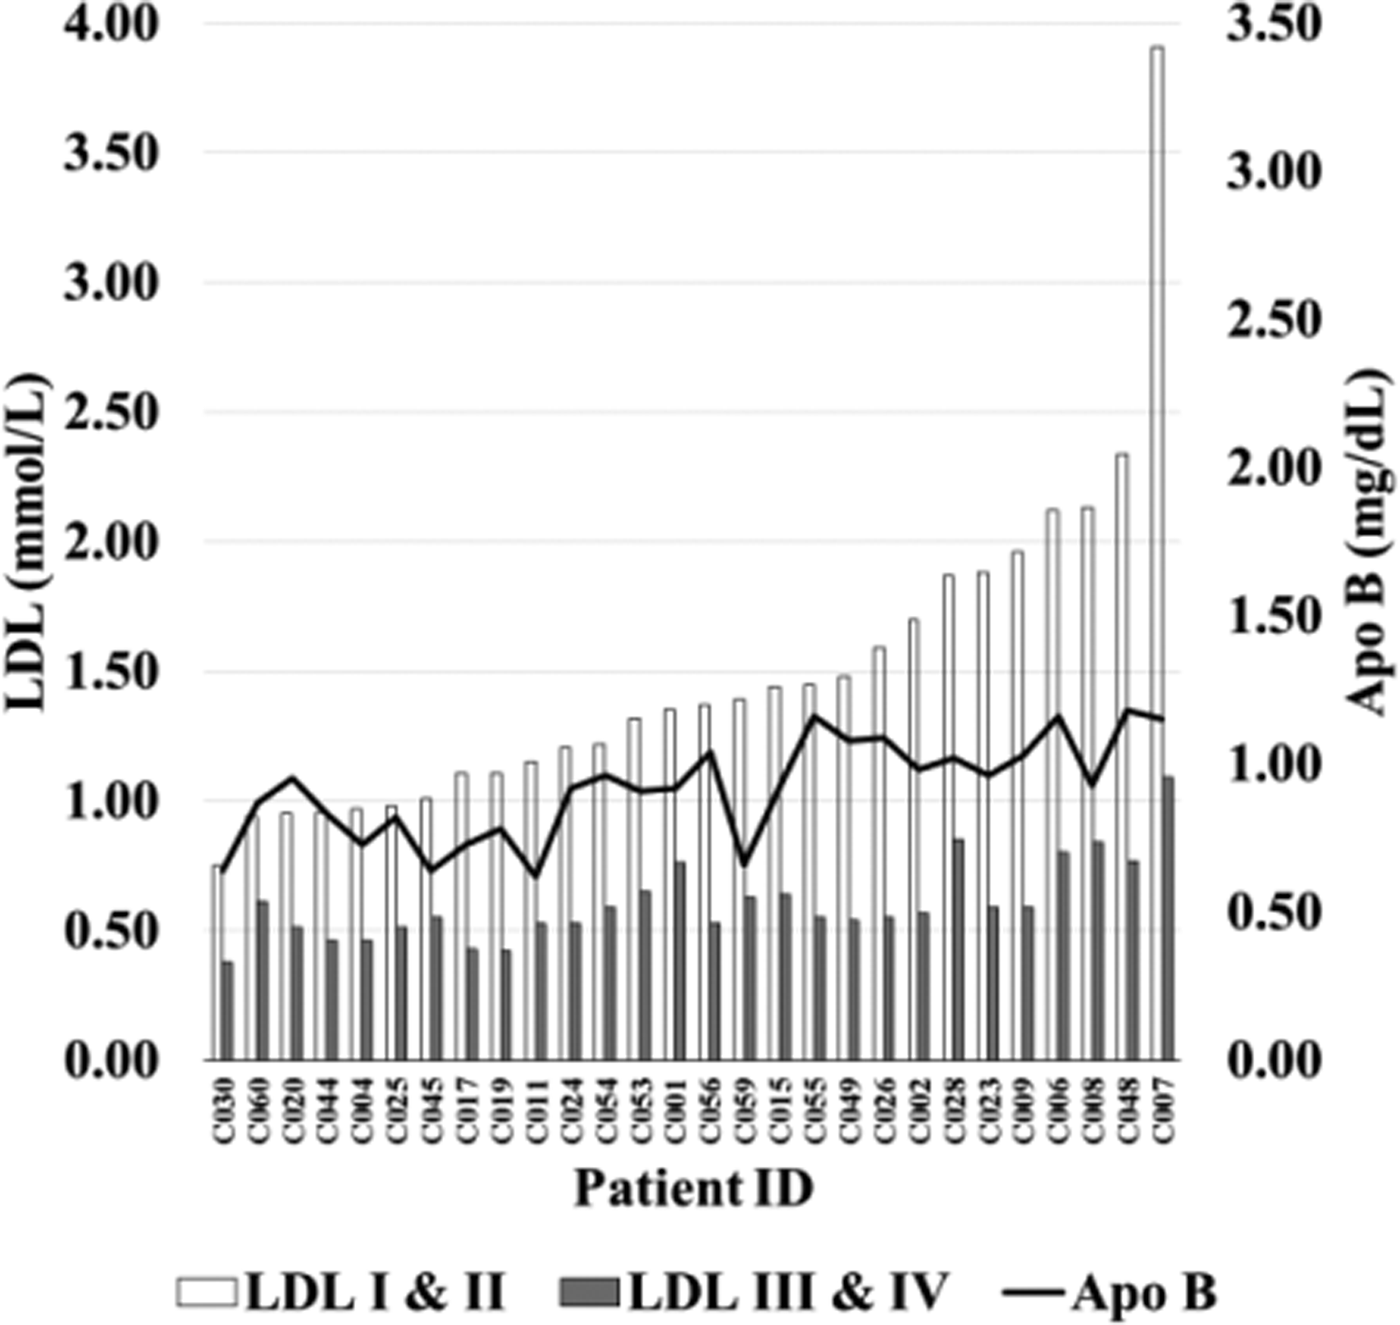
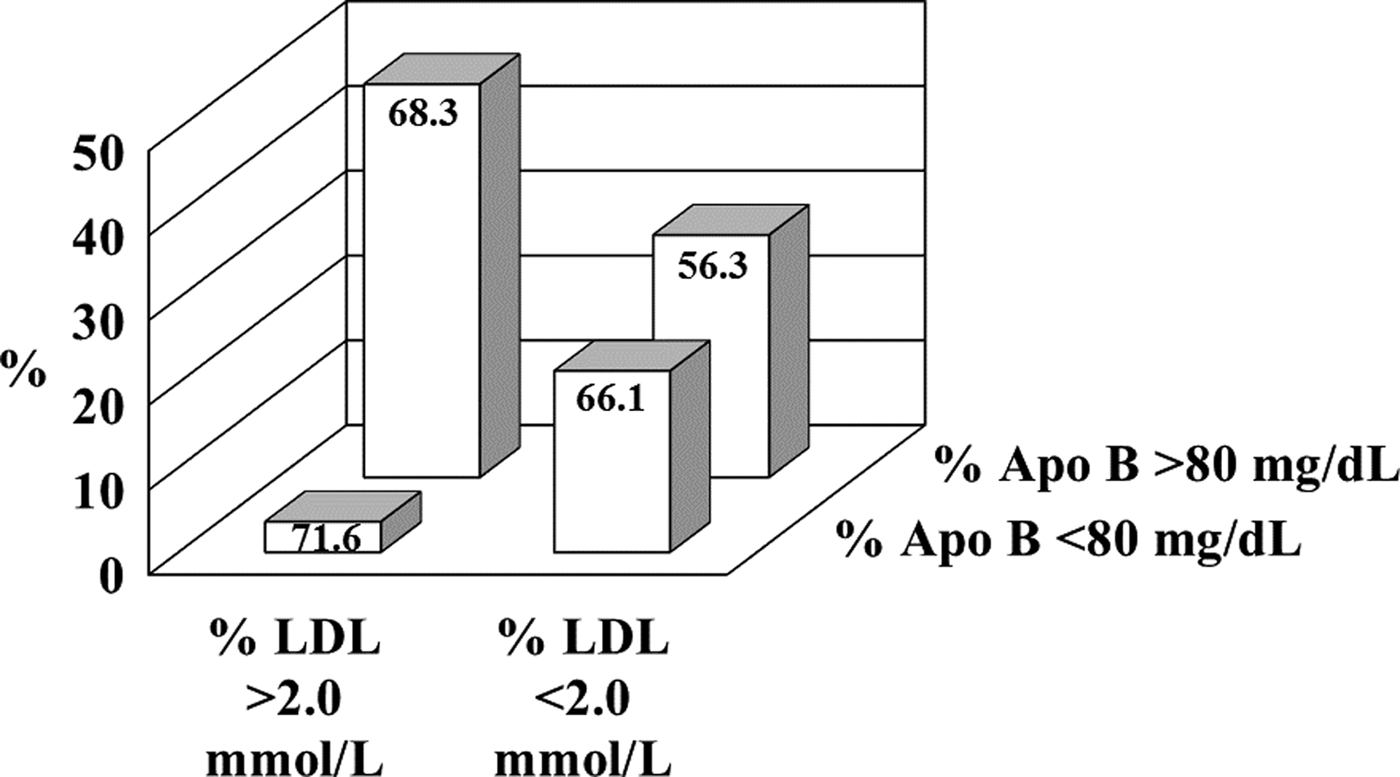
Significant differences were shown between LDL-C categories when compared to Apo B (p = 0·039) and the majority of patients (46·4 %) presented LDL-C >2·0 mmol/L and Apo B >80 mg/dL (Fig. 1). Although not discordant, these findings still suggest an increased risk according to recommendations( Reference Catapano 3 ). Closer inspection of results revealed that individuals with raised LDL-C typically had an abundance of LDL I & II fractions which may somewhat reduce this risk (Fig. 2). Spearman's correlation applied to the whole population produced no relationship between diet and LDL-C or Apo B; however, when focussing on the predominant ‘at risk’ cluster significant and strong relationships between LDL-C and total carbohydrate (R2 = 0·835; p = <0·001) and sucrose (R2 = 0·758; p = 0·003) were found. No hypoglycaemia data were collected and the authors tentatively speculate that these relationships may be a consequence of its treatment. In the light of the small sample size a further more comprehensive investigation with an appropriately powered sample would be beneficial.

Fig. 1. Patient LDL-C and Apo B in relation to recommendations (Cluster HbA1c (mmol/mol) shown on columns).

Fig. 2. Individual patient LDL subfractions d Apo B.


