


In the United States, federal, state, and local authorities have been challenged to develop and execute preparedness plans to address the potential surge of critically ill patients that could occur in future influenza pandemics. 1 This task may be especially important if the outbreaks are caused by avian influenza viruses, which may be more virulent than seasonal strains and for which no effective vaccines or antivirals may be available.Reference Osterholm 2 , Reference Fauci 3 To respond to a surge in critically ill patients, 4 operational capabilities are postulated Reference Sprung and Kesecioglu 4 , Reference Christian, Devereaux, Dichter, Geiling and Rubinson 5 : space, staff, systems, and equipment and supplies. Space includes appropriate medical facilities to provide safe critical care. Staff includes appropriately trained medical professionals to care for critically ill patients. Systems include pre-event planning activities such as forming coalitions; developing and exercising communication protocols; and providing logistics, support, and training before and during an event. Finally, equipment and supplies include access to appropriate durable and disposable critical medical equipment and supplies.Reference Christian, Devereaux, Dichter, Geiling and Rubinson 5
Many hospitals have minimal reserves of durable medical equipment such as mechanical ventilators on-site at any one time; additional units are usually rented from medical supply vendors.Reference Christian, Devereaux, Dichter, Geiling and Rubinson 5 , Reference Toner and Waldhorn 6 The US Department of Health and Human Services (HHS) and some states have or are developing stockpiles of mechanical ventilators and associated supplies such as ventilator circuits and drugs such as neuromuscular-blocking agents to address surges in critically ill patients during future influenza pandemics.Reference Christian, Devereaux, Dichter, Geiling and Rubinson 5 , Reference Esbitt 7
Reliable estimates of such critical care equipment are needed to determine government stockpiling goals for future events. Previous predictions of projected national ventilation needs are based on historical pandemics and limited by the uncertainties in reconstructing these events.Reference Zhang, Meltzer and Wortley 8 , Reference Rubinson, Hick and Hanfling 9 Examining increases in the use of mechanical ventilation during multiple seasonal influenza outbreak periods may help to identify the quantitative range of peak surge in the use of mechanical ventilators and associated operational capabilities during seasonal influenza outbreaks. Once a methodology is developed to compare the severity of seasonal to pandemic influenza outbreaks using historical information, these data may be useful to better predict future influenza pandemic preparedness activities, including determining federal ventilator stockpiling goals.
Seasonal influenza outbreaks have been associated with substantial medical utilization. Excess outpatient medical visits, hospitalizations, and admissions to intensive care units have been described with influenza outbreaks.Reference Fiore, Uyeki and Broder 10 – 13 In addition, epidemiologic studies have revealed other serious medical conditions that are not always recognized as associated with influenza infections and that may require hospitalizations and mechanical ventilator support. These conditions include, but are not limited to, secondary infections such as bacterial pneumonia, acute ischemic heart disease, and neurologic complications such as stroke, Guillain-Barré syndrome, and encephalitis.Reference Goldstein, Viboud, Charu and Lipsitch 14 – Reference Lichenstein, Magder, King and King 17 Therefore, it is important to consider a broad range of symptoms and diagnostic or procedure codes to capture retrospectively the full impact of seasonal influenza outbreaks on the utilization of the health care system, including medical facilities and equipment.
The primary objective of this investigation was to use retrospective inpatient and viral surveillance data to quantify the surge in all-cause hospitalizations associated with ventilator use during peak influenza outbreak periods (PIOP) compared to non-influenza time periods (non-ITP) throughout multiple years. A secondary objective was to examine the association between the degrees of annual surges in ventilator use with the intensity of the influenza season, as measured by hospitalizations related to medically-attended acute respiratory illnesses (MAARI). An additional secondary objective was to examine the correlation between annual surges in ventilator use during peak periods of influenza activity with the proportion of individual circulating influenza types or subtypes for each season.
Subjects And Methods
Study Population and Medical Outcome Data
The study population included all patients who were admitted to Maryland's 47 accredited hospitals. The State of Maryland, Department of Health and Mental Hygiene, Health Services Cost Review Commission (HSCRC), provided discharge billing data for all Maryland hospitals for 12 consecutive study years from July 1, 2001, through June 30, 2013. No Veterans Administration hospitals were included in the HSCRC database, as they are not under state regulation.
Anonymous data extracted from the HSCRC database included International Classification of Diseases, Ninth Revision (ICD-9) codes of interest, patient's admission date and age on admission in years (or months in children younger than 2 years of age). Other data extracted from the HSCRC database included all-cause hospital admissions for all ages with at least 1 procedure code for mechanical ventilation. ICD-9 procedural codes for continuous mechanical ventilation included 96.70, 96.71, and 96.72. All-cause mechanical ventilator use results were further broken down into 5 age groups: 1 to 23 months, 2 to 17 years, 18 to 49 years, 50 to 64 years, and older than 64 years.
Data on hospital admissions associated with MAARI diagnoses were defined and used to estimate the intensity of each influenza season in a manner previously published.Reference Lichenstein, Magder, King and King 17 – Reference King, Lichenstein and Magder 19 Diagnoses related to MAARI included 1 or more primary or subsequent ICD-9 discharge codes for upper respiratory tract infections (460.x-465.x), which incorporated acute otitis media, sinusitis, mastoiditis, acute respiratory infection, common cold, pharyngitis, and tonsillitis. Also included were codes for middle respiratory tract diagnoses or symptoms (464.x) such as laryngitis, tracheitis, or croup. Lower respiratory tract illnesses or symptoms included either symptoms related to breathing difficulty, such as stridor (786.1), shortness of breath (786.05), tachypnea (786.06), and dyspnea (786.0, 786.62), or lower respiratory tract illnesses or signs such as atelectasis (518.0), bronchitis or bronchiolitis (466.x, 490.x), pneumonia (480.x-488.x), empyema (510.x), lung abscess (513.x), wheezing (786.07), and abnormal chest sounds (786.7). Codes for fever (780.6), respiratory viral infection (0.79.1-0.79.4 and 0.79.6-0.79.9), and a specific code for influenza (487.x) were also included.
Defining the Study Intervals of Interest and Characterization of Influenza Viruses
Each study year was defined from July 1 of the first year to June 30 of the following year. Two exceptions were used for the 2009 H1N1 pandemic. The first pandemic H1N1 wave occurred in late spring and early summer of 2009 and continued into the summer of 2009. 20 For the purpose of this investigation, study year 2008-2009 was defined from July 1, 2008, to July 4, 2009, to include the peak 4 weeks of the first pandemic H1N1 wave. Study year 2009-2010 was from July 5, 2009, through June 30, 2010, and included the second major pandemic H1N1 wave.
US Health and Human Services (HHS) region 3 (ie, Delaware, District of Columbia, Maryland, Pennsylvania, Virginia, and West Virginia) influenza virus surveillance data for the 2001-2002 through 2012-2013 seasons were obtained from the Centers for Disease Control and Prevention (CDC) interactive website. 20 CDC data on weekly counts of all positive influenza tests in HHS region 3 were used to define the discrete time intervals used for the analyses of each study year.
The PIOP consisted of 4 consecutive weeks, including the peak week, with the highest number of positive influenza test results per HHS region 3 data. The influenza season (referred to here as the influenza outbreak period) included the fewest number of consecutive weeks, with 85% or more of that season's positive influenza test results reported for HHS region 3. A 2-week buffer period at the beginning and end of this influenza season interval was included to assure that this time period captured the majority of influenza activity in Maryland for each study year. Finally, the non-ITP included the remaining weeks on either side of the influenza season, beginning with the start of each study year to the beginning of the defined influenza season and from the end of the influenza season to the end of the study year (Figure 1).

Figure 1 Time Periods Used in the Analyses. Vertical bars indicate weekly Department of Health and Human Services region 3 positive influenza tests. CDC indicates Center for Disease Control, IOP, influenza outbreak period; IIOP, intense influenza outbreak period; non-ITP, non-influenza time period.
In addition, the CDC website data were used to identify the types and subtypes of influenza viruses circulating in HHS region 3. These data were used to estimate the proportion of influenza A/H3N2, A/H1N1, and B viruses that circulated in the Maryland area each study year.
Statistical Methods
Analyses were based on daily counts of key endpoints including all-cause hospital admissions associated with ventilator use as well as MAARI-related hospitalizations for all Maryland hospitals. These counts were analyzed using a Poisson regression model, allowing for overdispersion. The model included terms to allow daily expectation to vary by year and month. It also included terms to allow for higher rates during the PIOP than the non-ITP of each study year. The periods of time between the PIOP and the non-ITP were used in the regression model to adjust for times of the year that likely involved a mix of factors including influenza, other respiratory pathogens, and seasonal or environmental issues that may have influenced the outcome endpoints of interest.
The Poisson regression model was used to calculate the rate ratio (RR) of each outcome of interest for each study year's PIOP compared to the corresponding non-ITP. The RR was considered a quantitative indicator of excess rate or surge of these medical outcomes during the peak PIOP for each of the 12 study years. RRs for ventilator use and MAARI-related hospitalizations were calculated for all age groups combined and also for 5 age groups: 1 to 23 months, 2 to 17 years, 18 to 49 years, 50 to 64 years, and older than 64 years.
The correlation coefficient (CC) was calculated by comparing each year's RR for MAARI-related hospitalizations, as a proxy for influenza season intensity, to that of the same year's hospitalizations associated with ventilator use. In addition, the RRs for individual patients requiring mechanical ventilation that had or did not have concomitant MAARI-related diagnoses during the PIOP were compared to those during the non-ITP.
CCs were also calculated comparing the RR of ventilator use during the PIOP with that of the non-ITP to the proportion of individual influenza virus types and subtypes that circulated in the Maryland area for each study influenza season.
Human Subject Protection
All data regarding influenza surveillance and hospitalization were examined and analyzed without personal identifiers. This study was reviewed and approved by the Institutional Review Board of the University of Maryland at Baltimore.
Results
A total of 8 729 857 patients were admitted to all 47 Maryland hospitals from June 1, 2001, through June 30, 2013 (Table 1). Of these admissions, 255 549 (2.9%) were associated with ventilator use, while 1 018 432 (11.6%) were associated with MAARI diagnostic codes. Table 1 also shows the age breakdown for these admissions and surges (RRs) in ventilator or MAARI-related hospitalizations. For all ages and years combined, there was a 7% increase in the rate of ventilator use during the PIOP compared to the non-ITP (RR = 1.07, P < .0001) and a 20% increase (RR = 1.20, P < .0001) in MAARI-related hospitalizations during the PIOP compared to the non-ITP.
Table 1 Hospitalizations Associated With Ventilator Use or With Medically Attended Acute Respiratory Illness (MAARI) for All Study Years

Abbreviation: PIOP, peak influenza outbreak period.
a Controlling for month.
b P < .0001.
c P < .02.
d P < .01.
Table 1 also shows the impact of the influenza outbreaks on ventilator use and MAARI-related hospitalizations by pooling all 12 study years by each age group. The largest increase in ventilator use during the PIOP for all years combined was observed in children aged 1 to 23 months. However the variability of this estimate was high due to the low number of ventilators used in this age group. Of all the admissions associated with ventilator use, 68% were by patients aged 50 years and older and 44% by patients 65 years and older.
In Table 2, individual year RRs are shown for hospitalizations associated with ventilator use or MAARI-related hospitalizations for all ages combined for each year. The RRs for ventilator use were significantly elevated during the PIOP for 8 of the 12 study years (range, 0.96-1.20) and for MAARI-related hospitalizations for 9 of the 12 study years (range, 0.94-1.41). The proportion of individual circulating influenza types and subtypes for each study year is also included in this table.
Table 2 Rate Ratios (RR) of Hospitalizations Associated With Mechanical Ventilator Use or Medically Attended Acute Respiratory Illness (MAARI) for All Agesa
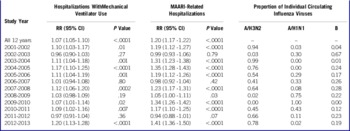
aRR comparing outcomes during peak influenza outbreak period to non-influenza season each year, controlling for calendar month.
Using the data from Table 2, we found a significant positive correlation between annual RRs for ventilator use and the concomitant RRs of MAARI-related hospitalizations (CC = 0.91, P < .0001) for all ages combined. Table 3 separated the ventilator-associated admissions from those with and without a MAARI diagnosis. Data from Table 3 demonstrated that the surge in ventilator use during the PIOP was mainly associated with a MAARI diagnosis (RR = 1.15) rather than not associated with one (RR = 1.03). The table also provides practical and unique information on mean weekly raw numbers of hospitalizations associated with mechanical ventilation during the PIOP (n = 444) and the non-ITP (n = 397) for all 12 study years combined. These numbers should be considered in the context of approximately 5.7 million Maryland residents according to 2010 US census data. 21
Table 3 Mean Weekly Numbers of Hospitalizations With Ventilator Use and Rate Ratios (RR) for All Study Years Comparing Non-ITP to PIOP
Abbreviations: MAARI, medically attended acute respiratory illness; non-ITP, noninfluenza time period; PIOP, peak influenza outbreak period.
aAdjusted for month and calendar year.
Our preceding analyses do not distinguish between the two separate waves of influenza activity that occurred during the 2008-2009 study year. The first wave was a seasonal outbreak that peaked in February 2008 and had an overall RR for hospitalizations associated with ventilator use of 0.99 (95% CI = 0.93-1.06, P = .86). The second wave was the first pandemic H1N1 outbreak that peaked in June of 2009, and the RR for hospitalizations associated with ventilator use was 1.06 (95% CI = 1.0-1.13, P = 0.06). These data indicate that the pandemic wave caused a larger increase in ventilator use compared to the seasonal wave of the same study year.
Figure 2 shows that the surges in hospitalizations associated with ventilator use occurred at nearly the same time as the peak 4 weeks of positive influenza tests (PIOP) for the study years 2003-2004 and 2004-2005. This figure visually demonstrates that surges in ventilator use are temporally related to peaks in influenza activity. Study years 2003-2004 and 2004-2005 were chosen to depict this relationship owing to their statistically significant surge in ventilator use and to the fact that influenza activity, as measured by positive tests, peaked at different times.
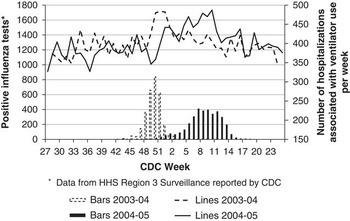
Figure 2 Weekly Department of Health and Human Services Region 3 Positive Influenza Test Results (Vertical Bars) Compared to Mean Weekly Numbers of Admissions (Lines) Associated With Ventilator Use During the 2003-2004 and 2004-2005 Influenza Seasons. CDC indicates Centers for Disease Control and Protection
Table 2 provides the proportion of circulating influenza types and subtypes that circulated in the Maryland area (HHS region 3) each year. For all ages combined, a borderline significant positive correlation was observed between the proportion of circulating influenza A/H3N2 and the corresponding years’ RR of ventilator use (CC 0.55, P = .06). Figure 3 demonstrates that this correlation reached statistical significance for Maryland residents older than 64 years of age (CC = 0.62, P = .03). A/H1N1 and B viruses were not significantly correlated with ventilator use.

Figure 3 Rate Ratio (RR) of Ventilator Use During Peak Influenza Outbreaks Compared to the Proportion of Circulating Influenza A/H3N2 Viruses in the Department of Health and Human Services Region 3 During the Same Year in Maryland Residents Older than 64 Years of Age.aCorrelation coefficient = 0.91, P < .0001.
Discussion
The findings in this study indicate an overall statistically significant surge in hospitalizations associated with mechanical ventilator use in Maryland residents during the peak 4 weeks of influenza outbreaks compared to the non-ITP. This finding is important because influenza illnesses likely represent only a fraction of the medical conditions that require the use of mechanical ventilation.Reference Wunsch, Linde-Zwirble, Angus, Hartman, Milbrandt and Kahn 22
The association of influenza infection with surges in ventilator use was suggested by 4 key findings in this study. First, an important finding was a statistically significant increase in ventilator use temporally related to peak influenza activity. Second, a statistically significant correlation was observed between increases in ventilator use and the intensity of the influenza season, as measured by increases in acute respiratory illness-related hospitalizations during peak influenza activity. Third, the surge in ventilator use during the PIOP was predominantly driven by patients who required mechanical ventilation and who also had acute respiratory illness, as defined by MAARI diagnostic codes. Fourth, a statistically significant correlation was observed between the proportions of circulating A/H3N2 viruses and ventilator use in individuals older than 64 years of age, which is the population most likely to need ventilators. This last finding supports previous reports in the literature, which demonstrate that infection with seasonal influenza A/H3N2 causes more severe illness than other influenza virus types or subtypes, especially in the elderly.Reference Thompson, Shay and Weintraub 11 , Reference Thompson, Shay and Weintraub 12 , Reference Lichenstein, Magder, King and King 17 , Reference King, Lichenstein and Magder 19
The data on ventilator use related in this study involved all-cause use. Trauma units, neurological or surgical intensive care units, and neonatal intensive care units undoubtedly use ventilators for conditions other than those related to influenza or other respiratory pathogens. However, the finding that surges in ventilated patients with MAARI-related codes were higher than for ventilated patients without MAARI-related codes during peak influenza activity supports the hypothesis that influenza infection directly plays a role in increased frequency of ventilator use.
The overall surge in the use of mechanical ventilators during peak seasonal influenza periods may not appear profound but, in fact, may be very important during pandemic influenza outbreaks, when pandemic strains are likely to induce more severe illness than occur with seasonal strains. It has been speculated that hospitals may not have available on-site all of the mechanical ventilators needed and may have to rent equipment from medical supply companies in times of high demand.Reference Christian, Devereaux, Dichter, Geiling and Rubinson 5 , Reference Toner and Waldhorn 6
To our knowledge, this study is the first to use a large data set to directly quantify the excess all-cause hospitalizations associated with ventilator use during multiple seasonal influenza peak outbreaks. Data from this study may be useful baseline data that could be incorporated into historical pandemic data to model and estimate the surge in hospitalizations associated with ventilator use for future pandemics.
However, future influenza pandemic outbreaks may involve novel influenza strains that may induce more severe illnesses than are observed with annual seasonal strains.Reference Fauci 3 In addition, the timeliness and effectiveness of influenza vaccines, the effectiveness of antiviral agents, and attempts to reduce transmission via personal protective devices may be more limited during future pandemics than during seasonal influenza outbreaks. These possibilities make decisions on stockpiling goals for critical care equipment based on seasonal outbreak information challenging.Reference Rubinson, Hick and Hanfling 9
Finally, it is important to note that stockpiling durable and disposable critical medical equipment and supplies is a necessary but not sufficient capability for pandemic influenza preparedness. Enhancing the other operational capabilities such as space, staff, and systems is an imperative part of pandemic preparedness. Experts in the field have indicated that systems are particularly important to effectively utilize stockpiled medical countermeasures such as mechanical ventilators. Systems involve comprehensive planning and training, developing and exercising crisis standards of care protocols, and perfecting logistics and communication before and during pandemics.Reference Sobieraj, Reyes and Dunemn 23 , Reference Rubinson, Hick and Curtis 24
Study Strengths and Limitations
One strength of this study is having a robust-sized data set on millions of patients of all ages admitted to all certified hospitals in the State of Maryland. Another is having data on 12 consecutive influenza seasons, including 1 pandemic H1N1 outbreak, which allowed an examination of outcomes for a range of seasonal intensities ranging from mild to moderately severe. The Poisson model used in this study had been adjusted for month and year to minimize the influence of other factors such as weather or other circulating respiratory pathogens that could cause a surge in outcomes during the winter months.
The study has 3 main limitations. First, HHS region 3 influenza virus surveillance data may not exactly match the quantity and type of influenza viruses circulating specifically in Maryland. Second, data from Maryland may not precisely reflect other states or regions because of geographic and demographic differences. Third, the small number of ventilators used in children led decreased the precision of data in this age group.
Conclusions
The findings of this study indicate that seasonal influenza infections are associated with small to moderate surges in all-cause hospitalizations associated with the use of mechanical ventilators. Pandemic influenza preparedness activities include stockpiling vital medical equipment, such as ventilators and associated supplies, to respond to future pandemic influenza outbreaks. The data from this study may help the HHS to develop increasingly refined models to estimate the need for mechanical ventilators to help prepare for future moderate to severe pandemic influenza outbreaks. 25 , 26
Disclaimer
This study was primarily unfunded, except for the purchase of data sets from the State of Maryland, Health Systems Cost Review Commission, by the Biomedical Advanced Research and Development Authority.
Acknowledgments
Robin Robinson, PhD; Melanie Choe, PhD; Chuong Huynh, PhD; Lorraine Harkavy, RN; Robert Huebner, PhD; Timothy Lant, PhD; Mary Hill-Harmon, MSPH; Richard Jaffe, PhD; Wayne Wiley, MPA; Scott Nystrom, PhD; Lewis Rubinson, MD, PhD; and Oscar Ibarra provided data acquisition and concepts on design.


