


According to the WHO, childhood obesity is one of the most serious public health challenges of the twenty-first century( 1 ). The mechanisms underlying overweight and obesity in young children are largely unknown, but low physical activity levels (PAL) are likely to be important( Reference Timmons, Naylor and Pfeiffer 2 , Reference Eriksson, Henriksson and Löf 3 ). However, investigating PAL in young children is difficult, as accurate and easy-to-use methods for assessing energy expenditure in response to physical activity during free-living conditions are scarce for this population group. Developing such methods requires the measurements of total energy expenditure (TEE) by means of the doubly labelled water method in combination with the measurements of resting energy metabolism using indirect calorimetry. Conducting such studies in young children represents a challenge. Furthermore, there is incomplete knowledge regarding how very young children differ from older children and adults with regard to the relevant aspects of exercise physiology and components of energy metabolism. A few attempts have been made to develop methods for assessing energy expenditure in response to physical activity in preschool children( Reference Montgomery, Reilly and Jackson 4 – Reference Butte, Wong and Lee 8 ); however, no attempts have been made previously for a group of children aged 3 years or less.
Activity monitors can be used to objectively assess PAL without being intrusive. For instance, a triaxial accelerometer, Tracmor, has yielded promising results in adults( Reference Bonomi, Plasqui and Goris 9 ) and in a group of 3- to 4-year-old children( Reference Sijtsma, Schierbeek and Goris 6 ). However, this device is currently not commercially available for use in young children. An alternative, the Actiheart, combines a uniaxial accelerometer with a heart rate recorder( Reference Brage, Brage and Franks 10 ). The Actiheart software calculates activity energy expenditure (AEE) for adults and older children, and studies in adults( Reference Assah, Ekelund and Brage 11 ) and young men( Reference Villars, Bergouignan and Dugas 12 ) have shown that such estimates are valid. Furthermore, in two populations of children (mean age 4·6 and 11·6 years, respectively), Butte et al. ( Reference Butte, Wong and Lee 8 , Reference Butte, Wong and Adolph 13 ) showed that the Actiheart could provide valid assessments of TEE. However, the potential of this device to capture variations in free-living AEE or TEE has not been studied in a group of children aged 3 years or less.
Available methods to assess PAL include activity questionnaires or diaries, tools that are cheap and relatively easy to use. However, they rely on self-reporting and, in many cases, also on the so-called metabolic equivalent (MET) values. These values are averages, and these averages may differ considerably among individual subjects and, therefore, methods based on MET values tend to be inaccurate for individuals( Reference Neilson, Robson and Friedenreich 14 ). Nevertheless, there may be many situations where a method based on self-reports is the only feasible option. Such reports are, of course, not possible in young children, but records of their physical activity patterns, kept by parents and other caretakers, are an obvious option. Bratteby et al. ( Reference Bratteby, Sandhagen and Fan 15 ) developed a 7 d activity diary based on MET values, which has been shown to be able to provide valid estimates of the PAL for groups of adolescents( Reference Bratteby, Sandhagen and Fan 15 ). However, this diary has not been applied in young children.
For adults, MET values published by Ainsworth et al. ( Reference Ainsworth, Haskell and Herrmann 16 – Reference Ainsworth, Haskell and Whitt 18 ) have been widely used, and MET values for children aged 6–18 years( Reference Ridley, Ainsworth and Olds 19 ) have been published recently. No corresponding compilation of MET values for younger children is available. However, Torun suggested a procedure to derive MET values for 1- to 15-year-old children( Reference Torun 20 ) using published values for lighter activities and values for adults multiplied by an age-correction factor for heavier activities( Reference Torun 20 ). Adolph et al. ( Reference Adolph, Puyau and Vohra 21 ) have also proposed MET values intended for children aged 3–5 years for seven activities. It is not known how these MET values( Reference Ainsworth, Haskell and Herrmann 16 , Reference Torun 20 , Reference Adolph, Puyau and Vohra 21 ) influence the accuracy when estimating energy expenditure from activity records in free-living young children.
In the present study, we investigated to what extent heart rate recording and movement registration, as obtained by means of the Actiheart, could capture variations in free-living TEE and AEE in healthy 1·5- and 3-year-old children. In addition, PAL values assessed using a modified version of a published activity diary( Reference Bratteby, Sandhagen and Fan 15 ) were compared with reference estimates obtained by means of the doubly labelled water method in combination with indirect calorimetry. For this evaluation, we used MET values published by Ainsworth et al. ( Reference Ainsworth, Haskell and Herrmann 16 ), Torun( Reference Torun 20 )and Adolph et al. ( Reference Adolph, Puyau and Vohra 21 ).
Subjects and methods
Participants and design
A total of 108 parent couples who participated in a previous study( Reference Eriksson, Lof and Forsum 22 ) were asked to participate in the present study with their 1·5-year-old children, and forty-five couples agreed to do so. These forty-five parent couples were again asked to participate in the study when their children were 3 years old, and thirty-three couples agreed to participate. Energy metabolism and physical activity of the children were studied on both occasions. At 1·5 years of age, one child was excluded due to poor health, and at 3 years of age, measurements were not completed for two children. Thus, forty-four and thirty-one healthy children aged 1·5 and 3 years, respectively, were included in the present study. Day care was attended by twenty-five of the forty-four children (57 %) and all the thirty-one children at 1·5 and 3 years of age, respectively. Among the parents who participated with their 1·5-year-old children, 50 % had a university degree and 40 % were classified as overweight or obese (BMI>25 kg/m2). Corresponding values for parents who participated in the study when their children were 3 years old were similar. A few of the results obtained for energy metabolism and body composition at 1·5 years of age have been published previously( Reference Eriksson, Henriksson and Löf 3 ). The present study was conducted according to the guidelines laid down in the Declaration of Helsinki, and all procedures involving human subjects were approved by the Research Ethics Committee in Linköping, Sweden. Written informed consent was obtained from all parent couples.
Protocol
The parents collected two urine samples at home and brought them to the measurement session, which was started by giving the children a dose of stable isotopes mixed with fruit juice to measure their body composition and TEE during the subsequent 2-week period. Body weight was recorded using a scale (KCC 150; Mettler-Toledo), and length/height was recorded to the nearest centimetre using a length board (1·5 years) or a stadiometer (3 years). Sleeping metabolic rate (SMR) was measured using indirect calorimetry during a mid-morning nap shortly after dosing (1·5 years) or in the evening on the day of dosing (3 years). The parents were instructed to collect urine samples on days 1, 5, 10 and 14 after dosing and to record the time of sampling. Urine samples were obtained by means of baby urine collector bags (B. Braun Medical) or cotton balls in the diaper (using a syringe to recover the urine) or using a pot. The activities of the children were recorded using our activity diary for 7 d following the day of dosing. Furthermore, bodily movements and heart rate of the children were recorded by means of the Actiheart during the 2 weeks following dosing. The children wore this device for 2 d during the first week and also for 2 d during the second week. The parents were asked to choose for each week one weekday and one weekend day when their children were not sick and had normal activity patterns. When measurements were completed, the parents delivered the urine samples, the Actiheart and the activity diary to us.
Energy expenditure
SMR was measured during sleep using a ventilated hood system (Deltatrac Metabolic Monitor; Datex Instrumentarium Corporation). O2 uptake and CO2 production were measured for ≥ 20 min, and when the recordings were stable, which occurred after approximately 10 min, recordings obtained during 12–16 min were used to calculate SMR using the Weir equation( Reference Weir 23 ).
Each child was given an accurately weighed dose of stable isotopes using 2H2O (enrichment 99·9 %) and H2 18O (enrichment 20 %): 0·14 g 2H2O and 0·35 g H2 18O per kg body weight. Urine samples were stored in glass vials with an internal aluminium-lined screw cap sealing at +4oC until sample collection, after which they were stored at − 20oC until analysis. 2H and 18O enrichments of dose and urine samples were analysed using an isotope ratio mass spectrometer fitted with a CO2/H2/H2O equilibrium device (Deltaplus XL; Thermoquest) as described previously( Reference Eriksson, Henriksson and Löf 3 ). 2H dilution space (N D) and 18O dilution space (N O) were calculated using zero-time enrichments obtained from the exponential isotope disappearance curves that provided estimates for the elimination rates for 2H and 18O, respectively. CO2 production was calculated according to the method of Davies et al. ( Reference Davies, Coward and Gregory 24 ), assuming that 25 % of the total water losses were fractionated. TEE was calculated from CO2 production using the Weir equation( Reference Weir 23 ), assuming a food quotient of 0·85( Reference Black, Prentice and Coward 25 ). Total body water was the average of N D/1·041 and N O/1·007( 26 ). N D/N O was 1·024 (sd 0·013) and 1·028 (sd 0·009) at 1·5 and 3 years of age, respectively. Fat-free mass was calculated as total body water/0·784 and total body water/0·777 at 1·5 and 3 years of age, respectively( Reference Fomon, Haschke and Ziegler 27 ). To obtain fat mass, fat-free mass was deducted from body weight. Analytical precision (in ppm) was 0·22 for 2H and 0·03 for 18O. When samples from one adult subject were analysed nine times, the following coefficients of variation were obtained: 1·2 %, TEE; 0·3 %, total body water; 0·3 % or less, k D and k O. These values were all well within the recommended criteria( 26 ). Reference PAL (PALref) was TEE/SMR. AEE was calculated as TEE minus SMR.
Actiheart
The Actiheart (Camntech Limited, http://www.camntech.com) has a uniaxial accelerometer that measures bodily movements in counts per min (cpm) and a pulse monitor that measures heart rate in beats per min (bpm). The device has two electrodes, connected by a lead, that are attached to the chest by two electrocardiography pads (2660-3; 3M Svenska AB). The Actiheart software version 4.0.11 (Camntech Limited) was used to initiate, transfer and analyse the recorded information. For each child, mean heart rate (mHR) in bpm was calculated as the sum of the recorded heart rates (in bpm) divided by the number of recorded minutes. Correspondingly, for each child, mean activity counts (mAC) in cpm were calculated as the sum of the recorded counts (in cpm) divided by the number of recorded minutes. Calculations of mAC and mHR were based on recordings obtained during valid days, i.e. days when wear time and time spent sleeping were ≥ 19 h. These criteria are the same as those used in a recent comparable study in children aged 3–4 years( Reference Sijtsma, Schierbeek and Goris 6 ). The resting heart rate of 1·5-year-olds was the average heart rate when the children were napping according to the diary. The resting heart rate of 3-year-olds was the average heart rate during periods when no activity counts were recorded and when the children, according to the diary, performed inactive sitting activities.
Activity diary
Our activity diary is a modification of a diary developed for adolescents( Reference Bratteby, Sandhagen and Fan 15 ) in which subjects enter a digit (from 1 to 9) representing the dominant activity for 15 min intervals throughout a 7 d period. In our activity diary, the parents or other caretakers were asked to enter digits ranging from 1 to 7, representing common activities for children with increasing intensity, for all 15 min intervals throughout a 7 d period. The parents were requested to select one of the following activity categories for every 15 min interval: sleeping; lying quietly; passive sitting; active sitting; standing; walking; running (Table 1). The option to divide a 15 min interval into three 5 min intervals was also given. The activity categories were assigned appropriate MET values (Table 1). As shown in Table 1, MET values published by Ainsworth et al. ( Reference Ainsworth, Haskell and Herrmann 16 ) and by Torun( Reference Torun 20 ) were used at 1·5 and 3 years of age, while MET values published by Adolph et al. were used only at 3 years of age( Reference Adolph, Puyau and Vohra 21 ). For each child, the number of recorded minutes spent on each of the activity categories during the 7 d period was calculated and multiplied by an appropriate MET value. Thereafter, for each child, these values were summed for all activity categories and then divided by the total number of recorded minutes to obtain PALAinsworth, PALTorun or PALAdolph values.
Table 1 Metabolic equivalent (MET) values published by Ainsworth et al. ( Reference Ainsworth, Haskell and Herrmann 16 ), Torun( Reference Torun 20 ) and Adolph et al. ( Reference Adolph, Puyau and Vohra 21 ) for seven activity categories used at 1·5 and 3 years of age
* Used at 1·5 and 3 years of age.
† Used at 3 years of age.
‡ Obtained as 0·50 times the Ainsworth MET value for running in accordance with Torun's method for vigorous activities( Reference Torun 20 ).
Statistical analyses
Values are given as means and standard deviations. Significant differences between mean values were identified using dependent t tests. For Actiheart results, multiple regression analysis was used to evaluate the fraction of the variation in TEE or AEE that could be explained by mHR and/or mAC, in addition to the variation explained by fat mass and fat-free mass. Fat-free mass and fat mass, rather than body weight, were chosen as independent variables, as body composition variables have been shown to explain more of the variation in TEE and AEE than did body weight alone( Reference Bonomi, Plasqui and Goris 9 , Reference Masse, Fulton and Watson 28 ). Thus, regression models with TEE or AEE as the dependent variable (y) and fat mass and fat-free mass as independent variables (x) were fitted first. Thereafter, mHR or mAC, or the combination of these two variables, were added as independent variables. Due to variations in resting heart rate, mHR may differ among individuals; therefore, we also tested regression models including both mHR and resting heart rate as independent variables. However, these models yielded results similar to those of models without resting heart rate, and thus these results are not reported. Finally, considering that body composition data may not be available always, we reran all our models described above using body weight, rather than fat-free mass and fat mass, as the independent variable. The Bland–Altman( Reference Bland and Altman 29 ) procedure was used to compare PALAinsworth, PALTorun and PALAdolph values with the PALref values. Thus, the difference (y) between PAL values, obtained using the activity diary (i.e. PALAinsworth, PALTorun or PALAdolph), and PALref values was plotted v. the average of the two estimates (x). The mean difference with 2 sd (limits of agreement) was calculated. The mean difference provides an estimate of the validity of the method for groups, while the limits of agreement give an indication regarding its validity for individuals. To test for a relationship between x and y in the Bland–Altman plot, linear regression was used. Significance (two sided) was accepted when P< 0·05. The analyses were carried out using the STATISTICA software, version 10 (STAT SOFT).
Power considerations and dimension of the study
The following considerations regarding power and sample size were made. For Actiheart evaluations, thirty children would be sufficient to detect a 100 kJ/24 h difference in AEE representing 5–10 % of the AEE (y) in response to a difference in mHR (bpm) or mAC (cpm) of 10 units (x) with a power of 0·80. Variables in this model (with assumed means and standard deviations) were fat-free mass (12 (sd 1·5) kg), fat mass (4 (sd 1) kg), mHR (120 (sd 15) bpm) and mAC (100 (sd 20) cpm). As the Bland–Altman comparison( Reference Bland and Altman 29 ) does not address a specific hypothesis, no power calculation can be made for this procedure, and it is relevant to note that the original description of this procedure( Reference Bland and Altman 29 ) is based on an example with seventeen observations. For comparison of mean values (PALAinsworth, PALTorun and PALAdolph v. PALref), we assumed that PALref was, on average, 1·50 (sd 0·15), assuming a correlation between PAL assessed using the diary (PALAinsworth, PALTorun or PALAdolph) and PALref of 0·3. Thus, thirty children would provide us with more than 80 % power to detect a 10 % difference in PAL. All power calculations applied two-sided tests and used a 5 % significance level.
Results
Participants, energy expenditure and body composition
The age, body weight, length, BMI, body composition and energy expenditure of the children who participated in the study at 1·5 and 3 years of age are given in Table 2. Wide ranges in TEE, SMR, AEE, fat-free mass and fat mass were covered at both ages. At 1·5 years of age, SMR (kJ/24 h) was significantly correlated with fat-free mass (kg) (r 0·50; P= 0·001), fat mass (kg) (r 0·42; P= 0·005) and body weight (kg) (r 0·53; P< 0·001). At 3 years of age, SMR (kJ/24 h) was correlated with body weight (kg) (r 0·48; P= 0·006) and fat-free mass (kg) (r 0·52; P= 0·003), but not with fat mass (kg) (r 0·10; P= 0·60).
Table 2 Age, body weight, length, BMI, body composition and energy expenditure of the children who participated in the study at 1·5 and 3 years of age (Mean values and standard deviations or ranges)
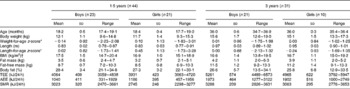
TEE, total energy expenditure measured using the doubly labelled water method; AEE, activity energy expenditure calculated as TEE minus SMR; SMR, sleeping metabolic rate measured by indirect calorimetry.
* Calculated using the reference data of Albertsson-Wikland et al. ( Reference Albertsson-Wikland, Luo and Niklasson 37 ).
† At 3 years of age, 18 % of the children were classified as overweight and none as obese( Reference Cole, Bellizzi and Flegal 40 ).
Actiheart
Actiheart outputs (mHR and mAC) at 1·5 and 3 years of age and their related variables are given in Table 3.Obviously, the number of valid days and the wear time (means and standard deviations) were very similar at 1·5 and 3 years of age.
Table 3 Number of valid days, wear time, sleep plus wear time and Actiheart outputs at 1·5 and 3 years of age (Mean values and standard deviations or ranges)
mAC, mean activity counts assessed using the Actiheart as described in the Subjects and methods section; mHR, mean heart rate assessed using the Actiheart as described in the Subjects and methods section.
***Mean value was significantly different from that at 3 years of age (P< 0·001).
† These children also participated in the study at 3 years of age.
‡ n 30 due to invalid recordings for all 4 d by means of the Actiheart for one child at 3 years of age.
§ A day was considered valid when wear time plus time spent sleeping was ≥ 19 h.
∥ At 1·5 years of age, the numbers of valid days were as follows: 1 (one child); 2 (two children); 3 (three children); 4 (thirty-eight children). At 3 years of age, the numbers of valid days were as follows: 1 (two children); 2 (three children); 3 (six children); 4 (nineteen children).
¶ Sleeping time reported by caretakers.
At 1·5 years of age, mHR was correlated with AEE (r 0·33; P= 0·029) and TEE (r 0·41; P= 0·006). The corresponding correlation values were 0·33 (P= 0·07) (AEE) and 0·37 (P= 0·042) (TEE) at 3 years of age. At either age, mAC were not correlated with AEE or TEE (r 0·17–0·21).
Table 4 summarises the results obtained when fat mass, fat-free mass, mHR and mAC were used as independent variables in multiple regression models with TEE as the dependent variable at 1·5 and 3 years of age. At 1·5 years of age, fat mass and fat-free mass together explained 48 % of the variation in TEE (P< 0·001) (model 1A). Adding mHR as another independent variable explained an additional 8 % of this variation (P= 0·006) (model 1B), while adding mAC explained no additional variation in TEE (model 1C). Furthermore, using both mHR and mAC as additional independent variables (model 1D) explained 55 % of the variation in TEE, a value similar to that (56 %) obtained for mHR alone (model 1B). At 3 years of age, fat mass and fat-free mass together explained 68 % of the variation in TEE (P< 0·001) (model 2A). When adding mHR or mAC, an additional 8 % of this variation could be explained (P= 0·004) (models 2B and 2C). Together, mHR, mAC, fat mass and fat-free mass explained 78 % of the variation in TEE (model 2D), a value similar to that (76 %) obtained when only mHR or only mAC were added (models 2B and 2C).
Table 4 Multiple regression results obtained for 1·5- and 3-year-old children when their total energy expenditure (kJ/24 h) was regressed on their fat mass, fat-free mass and Actiheart variables (mean heart rate (mHR) and mean activity counts (mAC))
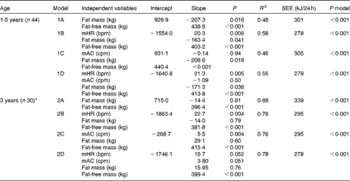
R 2, adjusted coefficient of determination for the model; SEE, standard error of estimation of the model; P model, P value of the model; bpm, beats per min; cpm, counts per min.
* n 30 due to invalid recordings for all 4 d by means of the Actiheart for one child at 3 years of age.
Corresponding results for regression models with AEE as the dependent variable are given in Table S1 (available online). Briefly, at 1·5 years of age, fat mass and fat-free mass explained only 23 % of the variation in AEE, and no additional variation (P>0·05) could be explained by adding mHR or mAC. At 3 years of age, fat mass and fat-free mass together explained 59 % of the variation in AEE, and adding mHR or mAC explained another 6 % (P= 0·03).
Results for regression models with TEE as the dependent variable and body weight together with mHR or/and mAC as independent variables at 1·5 and 3 years of age are given in Table S2 (available online). At 1·5 years of age, body weight explained 18 % of the total variation in TEE (model 5A). Adding mHR as another independent variable explained an additional 16 % of this variation (P= 0·002) (model 5B), while adding mAC explained no additional variation in TEE (model 5C). At this age, a maximum of 34 % of the total variation in TEE could be explained. At 3 years of age, body weight explained 30 % of the variation in TEE (P= 0·001) (model 6A). When adding mHR or mAC, an additional 9 or 11 %, respectively, of this variation was explained (P< 0·05) (models 6B and 6C). At this age, a maximum of 43 % of the total variation in TEE could be explained. Body weight did not explain any variation in AEE at 1·5 years of age, and thus no regression models based on body weight were fitted at this age. At 3 years of age, body weight explained 21 % of the variation in AEE (model 7A; Table S3, available online). Adding mHR as another independent variable explained an additional 7 % of this variation (model 7B; Table S3, available online), while the corresponding value when adding mAC was 10 % (model 7C; Table S3, available online). At this age, a maximum of 31 % of the total variation in AEE could be explained.
Activity diary
When the children were 1·5 years old, the parents/caretakers provided complete recordings for forty-two children, while data for 60 min were missing for two children each (0·6 % of the total time). At 3 years of age, complete recordings were obtained for all children. For thirty-four (77 %) and twenty-two (71 %) children at 1·5 and 3 years of age, respectively, the parents/caretakers chose to divide some of the 15 min intervals into three 5 min intervals. Such time covered approximately 20 % of the total recorded time at both 1·5 and 3 years of age.
Table 5 summarises the number of minutes spent daily on the seven activity categories at 1·5 and 3 years of age. We observed no significant differences between 1·5 and 3 years of age regarding the amount of time spent on activity categories 2, 5 and 6, i.e. lying, standing and walking activities. On average, the 3-year-olds slept 86 min less per d than the 1·5-year-olds. However, the 3-year-olds spent, on average, 82 and 21 min more daily on sitting and running activities, respectively.
Table 5 Time (min/d) spent on each of the seven activity categories estimated by means of the activity diary at 1·5 and 3 years of age (Mean values and standard deviations or ranges)
*** Mean value was significantly lower than that at 1·5 years of age (P< 0·001).
††† Mean value was significantly higher than that at 1·5 years of age (P= 0·007).
‡‡‡ Mean value was significantly higher than that at 1·5 years of age (P< 0·001).
§§§ Mean value was significantly higher than that at 1·5 years of age (P= 0·002).
∥ These children also participated in the study at 3 years of age.
Table 6 summarises the PALAinsworth, PALTorun, PALAdolph and PALref values for children at 1·5 and 3 years of age. At these ages, average PALAinsworth values were 1·44 and 1·59, respectively, and not significantly different from PALref values (1·39 and 1·61, respectively). At 1·5 years of age, the average PALTorun value was 1·33 and significantly (P= 0·014) lower than the corresponding PALref value. At 3 years of age, average PALTorun and PALAdolph values were 1·43 and 1·42, respectively. Both these values were significantly (P< 0·001) lower than the PALref value (1·61).
Table 6 Physical activity levels (PAL) assessed by means of the activity diary using different metabolic equivalent (MET) values in comparison with reference PAL (PALref) values at 1·5 and 3 years of age (Mean values and standard deviations or ranges)
*** Mean value was significantly different from that of PALref (P= 0·014).
††† Mean value was significantly different from that of PALref (P< 0·001).
‡ Total energy expenditure measured using the doubly labelled water method divided by the sleeping metabolic rate measured using indirect calorimetry.
§ Calculated using MET values for adults published by Ainsworth( Reference Ainsworth, Haskell and Herrmann 16 ).
∥ Calculated using MET values published by Torun( Reference Torun 20 ).
¶ Calculated using MET values published by Adolph et al. ( Reference Adolph, Puyau and Vohra 21 ).
The Bland–Altman plots for PALAinsworth and PALTorun values v. PALref values at 1·5 years of age are shown in Fig. 1(a) and (b). The limits of agreement were wide in both these cases. Furthermore, as shown in Fig. 1, the activity diary overestimated low PAL values and underestimated high PAL values for both these sets of MET values.
Fig. 1 Bland–Altman plots showing the regression of the difference (y) between the physical activity level (PAL) values, assessed using a 7 d activity diary with different sets of metabolic equivalent (MET) values, and the reference estimates (PALref), measured using a combination of the doubly labelled water method and indirect calorimetry, v. the average of the two estimates (x) in 1·5-year-old children. (a) PAL values calculated using MET values published by Ainsworth( Reference Ainsworth, Haskell and Herrmann 16 ) (PALAinsworth). PALAinsworth− PALref was 0·05 (2 sd 0·35). The regression equation was y= − 0·75x− 1·03; r − 0·38, P= 0·01. (b) PAL values calculated using MET values published by Torun( Reference Torun 20 ) (PALTorun). PALTorun− PALref was − 0·06 (2 sd 0·32). The regression equation was y= − 1·35x+1·78; r − 0·80, P< 0·001.
The Bland–Altman plots for PALAinsworth, PALTorun and PALAdolph values v. PALref values at 3 years of age are shown in Fig. 2 (a)–(c) The limits of agreement were wide in all these cases. As shown in Fig. 2(a), the activity diary underestimated low PAL values and overestimated high PAL values when using MET values published by Ainsworth. Fig. 2(b) shows that PALTorun values were lower than PALref values in twenty-eight of the thirty-one children, and Fig. 2(c) shows that the corresponding values of PALAdolph were lower in twenty-seven of the thirty-one children. Furthermore, the underestimation of PALAdolph values increased with increasing PAL values (Fig. 2(c)), and a trend (P= 0·086) for a negative relationship was also found in the corresponding Bland–Altman plot for PALTorun values (Fig. 2(b)).
Fig. 2 Bland–Altman plots showing the regression of the difference (y) between the physical activity level (PAL) values, assessed using a 7 d activity diary with different sets of metabolic equivalent (MET) values, and the reference estimates (PALref), measured using a combination of the doubly labelled water method and indirect calorimetry, v. the average of the two estimates (x) in 3-year-old children. (a) PAL values calculated using MET values published by Ainsworth( Reference Ainsworth, Haskell and Herrmann 16 ) (PALAinsworth). PALAinsworth− PALref was − 0·02 (2 sd 0·53). The regression equation was y= 0·86x− 1·40; r 0·49, P= 0·005. (b) PAL values calculated using MET values published by Torun( Reference Torun 20 ) (PALTorun). PALTorun− PALref was − 0·18 (2 sd 0·32). The regression equation was y= − 0·52x+0·615; r − 0·32, P= 0·086. (c) PAL values calculated using MET values published by Adolph( Reference Adolph, Puyau and Vohra 21 ) (PALAdolph). PALAdolph− PALref was − 0·19 (2 sd 0·30). The regression equation was y= − 0·65x+0·80; r − 0·40, P= 0·025.
Discussion
The present study was conducted in children aged 3 years or less, and such children differ from adults and older children in several aspects, which is possibly relevant when investigating how energy expenditure in response to physical activity can be assessed. In adults, it is common to correct AEE for the so-called diet-induced thermogenesis (usually 10 % of the TEE) and AEE and PAL are generally calculated using the BMR, measured after 12 h of fasting in the waking state but at complete rest. These requirements cannot be fulfilled in young children, in whom instead SMR must be measured. It is difficult to put a hungry child to sleep and thus SMR values tend to include some diet-induced thermogenesis values. Therefore, in the present study, we did not correct AEE for diet-induced thermogenesis. Furthermore, in children, measures of TEE and possibly SMR will include some energy expenditure in response to growth. For children aged 3 years or less, such energy expenditure is equivalent to only about 2 % of the TEE, on average( Reference Fomon, Haschke and Ziegler 27 , Reference Roberts and Young 30 ), but variations are likely to occur between children. Finally, movement patterns as well as exercise physiology, including relationships between body components, PAL, heart rate in response to exercise and components of energy expenditure, may not be the same in young children as in older ones or adults. Our observation that fat mass is correlated with SMR at 1·5 years of age but not at 3 years provides an example demonstrating a difference of this kind.
In the present study, we used regression analyses of heart rates and counts to evaluate the capacity of the Actiheart to capture the variation in energy expenditure in response to physical activity. This kind of data analysis is commonly applied( Reference Sijtsma, Schierbeek and Goris 6 , Reference Bonomi, Plasqui and Goris 9 , Reference Van Remoortel, Giavedoni and Raste 31 , Reference Ojiambo, Konstabel and Veidebaum 32 ), although, to the best of our knowledge, there is no consensus regarding the amount of the variation in AEE or TEE that a monitor should be required to explain in order to be useful for specific practical applications. However, it is relevant to note that for adults, Masse et al. ( Reference Masse, Fulton and Watson 28 ) considered the ability of accelerometer counts to explain 5 % of the variation in TEE above that explained by body size as ‘meaningful’. Apparently, the proportion of the variation in AEE or TEE, above that explained by body components, that a monitor can explain and its usefulness for practical applications need further studies and discussions. In particular, this is true for results obtained in young children.
In the present study, unique results were obtained regarding the capacity of heart rate recordings to provide assessments of TEE and AEE at 1·5 and 3 years of age. At both these ages, mHR explained an additional 8 % of the variation in TEE than did fat mass and fat-free mass alone. Furthermore, at 3 years of age, mHR explained an additional 6 % of the variation in AEE than did fat mass and fat-free mass. No comparable data exist for this age group; however, the present results are in good agreement with those obtained in a recent study( Reference Ojiambo, Konstabel and Veidebaum 32 ), where the addition of heart rate as an independent variable to a multiple regression model with other relevant variables increased the explained variation in both AEE and TEE by 4 % in children aged 4–10 years( Reference Ojiambo, Konstabel and Veidebaum 32 ). We find it reasonable to conclude that, during free-living conditions, mHR assessed using the Actiheart explains a significant but relatively small fraction of the variation in TEE at 1·5 and 3 years of age and in AEE at 3 years of age.
Regarding accelerometer counts, we found that, at 3 years of age, mAC explained 8 and 6 % of the variation in TEE and AEE, respectively, above that explained by fat mass and fat-free mass. For TEE, these results were in good agreement with those of a recent study( Reference Sijtsma, Schierbeek and Goris 6 ) in healthy Dutch children aged 3–4 years where variations in mAC, assessed using the triaxial accelerometer Tracmor, explained 7 % of the variation in TEE above that explained by the variation in fat-free mass. However, mAC recorded using Tracmor explained as much as 31 % of the variation in AEE above that due to body weight, sex and height( Reference Sijtsma, Schierbeek and Goris 6 ). This can be reconciled with previous studies in adults demonstrating that triaxial accelerometers capture variations in energy expenditure in response to physical activity better than uniaxial ones( Reference Van Remoortel, Giavedoni and Raste 31 , Reference Plasqui and Westerterp 33 ). Thus, as soon as Tracmor becomes available for young children, its potential to assess AEE and TEE in children aged 3 years or less should be evaluated. In summary, the present results suggest that mAC assessed using the Actiheart can explain a significant but relatively small fraction of the variation in TEE and AEE at 3 years of age.
It is worth noting that the capacity of accelerometer counts to explain variations in AEE and TEE differed slightly between the 1·5-year-olds and the 3-year-olds. Thus, mAC did not explain any additional variation in TEE or AEE in the 1·5-year-olds. We speculate that a possible explanation is that the 1·5-year-olds had an activity pattern that was different from that of the 3-year-olds, e.g. more arm movements. Such movements would not increase mAC, as they are not captured by the accelerometer in the Actiheart.
Another difference between children of the two age groups studied is that mHR did not explain any variation in AEE in the 1·5-year-olds above that explained by body composition variables, while mHR explained 6 % of this variation in the 3-year-olds. This observed difference is difficult to explain, but it may be related to changes in exercise physiology during early childhood as mentioned above.
Unexpectedly, neither at 1·5 nor at 3 years of age did the addition of both mHR and mAC to the same regression model increase the amount of variation in AEE or in TEE above that explained by fat mass and fat-free mass. This observation is in disagreement with the findings of Ojiambo et al. ( Reference Ojiambo, Konstabel and Veidebaum 32 ), who reported that a higher amount of the variation in AEE and TEE in children aged 4–10 years was explained when adding both heart rate and counts, assessed by means of a uniaxial accelerometer (ActiTrainer), to the same model.
Analyses carried out on data obtained using the Actiheart in the present study deserve some comments. At both ages, the additional amount of variation in TEE and AEE, i.e. the amount of variation explained by mHR and mAC above that explained by body weight alone, was reasonably comparable to the corresponding additional variation explained when models were based on a combination of fat mass and fat-free mass. However, models based on body weight, rather than those based on fat mass and fat-free mass, explained a smaller fraction of the total variation in TEE and AEE. This is in accordance with previous observations in adult populations( Reference Bonomi, Plasqui and Goris 9 , Reference Masse, Fulton and Watson 28 ). We report results for mAC in cpm; however, total activity counts per d (i.e. the sum of all counts divided by the number of valid days) yielded very similar results (data not shown). Finally, we were unable to obtain Actiheart recordings for 4 d from all children; however, when we repeated the analyses including only data for children with recordings for 4 days (n 38 and n 19 at 1·5 and 3 years of age, respectively), our conclusions remained the same.
In the present study, we compared the capacity of different sets of MET values to provide assessments of PAL recorded in a diary during 7 d. The diary was well accepted by parents and other caretakers, and we received almost complete recordings for all children at both ages. We found that MET values published by Ainsworth et al. ( Reference Ainsworth, Haskell and Herrmann 16 ) yielded average PAL values in reasonable agreement with reference values obtained by means of the doubly labelled water method in combination with indirect calorimetry at 1·5 as well as at 3 years of age. By contrast, average PAL values based on MET values published by Torun( Reference Torun 20 ) or Adolph et al. ( Reference Adolph, Puyau and Vohra 21 ) were too low. A possible explanation for these underestimations may be that the MET values that we used for activity category 7 (i.e. running) were too low. For this activity category, Adolph et al. assessed their MET value in children who transferred balls at a fast pace between two buckets in a small room( Reference Adolph, Puyau and Vohra 21 ), and during free-living conditions children may perform other more demanding activities. Torun's correction factors for young children were based on few observations, and his method underestimated the energy costs of vigorous activities in subjects aged 6–18 years( Reference Ridley and Olds 34 ). When we recalculated PALTorun and PALAdolph values using a higher MET value (i.e. 10) for activity category 7, the following results were obtained: 1·5 years – mean PALTorun value of 1·37; 3 years – mean PALTorun and PALAdolph values of 1·53 and 1·56, respectively. None of these values were significantly different from the corresponding PALref values, thus providing some support for our suggestion that Torun and Adolph used too low MET values for activity category 7.
As expected, no matter what MET values we used, the limits of agreement were wide, implying low accuracy for individuals. Furthermore, although the mean PALAinsworth value was in reasonable agreement with the PALref value, this estimate was biased at both ages. Misclassification of activities (duration and/or intensity) may be impossible to avoid, as the diary is based on the parents' estimates of their children's activity. However, it is worth noting that in a group of adolescents, this diary yielded unbiased PAL values( Reference Bratteby, Sandhagen and Fan 15 ). Therefore, we suggest that some of the inaccuracy for individuals may be due to our modified activity categories. Furthermore, many caretakers considered 5 min intervals easier to apply in practice. Thus, future studies should investigate whether the accuracy of our diary can be improved by modifying the included activity categories as well as by using only 5 min intervals.
At 3 years of age, two outliers were observed when comparing PALAinsworth and PALref values (Fig. 2(a)). The PALAinsworth values of these two children were 2·03 and 2·66, while their PALref values were lower, 1·37 and 1·73, respectively. When reviewing these children's diaries, no evident errors were observed and we found no reason to exclude them from the analyses. Still, most probably their parents had overestimated the time spent on vigorous activities, and this overestimation became particularly evident when calculating PALAinsworth values, as the MET value for category 7 is higher according to Ainsworth et al. ( Reference Ainsworth, Haskell and Herrmann 16 ) than according to Torun( Reference Torun 20 ) or Adolph et al. ( Reference Adolph, Puyau and Vohra 21 ). These outliers demonstrate a limitation of self-reporting and suggest that diaries should be combined with objective measures to be considered reliable.
We have reported previously( Reference Eriksson, Henriksson and Löf 3 ) that our measured SMR at 1·5 years of age was similar to the BMR predicted using equations based on weight( Reference Schofield 35 ) for girls, but significantly higher for boys (+4 %, on average), which is possibly due to limitations in the data used to establish the Schofield equations in children aged below 3 years. In the present study, the measured SMR of the 3-year-olds was, on average, 8 % lower than the corresponding BMR predicted from body weight( Reference Schofield 35 ) (P< 0·05) in both boys and girls (data not shown). This finding is in good agreement with recent results obtained in Dutch children aged 3–4 years, in whom the measured SMR was 11 % lower than the predicted BMR( Reference Sijtsma, Schierbeek and Goris 6 ). A possible explanation for the lower SMR values compared with the predicted BMR values may be that the body composition in contemporary Western children is different from that in the children used when the equations were developed. Some support was found for this suggestion, as the 3-year-olds in the present study had relatively more fat mass and less fat-free mass than the reference children in the study carried out by Fomon et al. ( Reference Fomon, Haschke and Ziegler 27 ), which would yield lower energy expenditure at rest.
The present study is the first to evaluate the capacity of methods to assess energy expenditure in response to physical activity in a group of children aged 3 years or less. A major strength is that we measured TEE and SMR using criterion methods, i.e. a combination of the doubly labelled water method and indirect calorimetry in these young children. Thanks to this design, we observed that fat mass was correlated with SMR at 1·5 years of age but not at 3 years, a unique finding that needs confirmation in future studies. Limitations include that the participating parents represented a selected group and that the sample size was small. Both these facts may limit generalisability. We cannot exclude that the parents who participated in the present study might have been more positive while filling out the diary than parents in general and that the diary's accuracy to some extent might have been influenced by the fact that the parents (as common in research) were slightly better educated than the general Swedish population (50 v. 36 % had a university degree). However, it is worth noting that the averages and variations in parental BMI were in accordance with those of the Swedish population for the appropriate sex and age( 36 ). The body size of the children in the present study was comparable to reference data( Reference Albertsson-Wikland, Luo and Niklasson 37 ), their TEE values were in agreement with comparable estimates in Western children( Reference Davies, Coward and Gregory 24 , Reference Butte, Wong and Hopkinson 38 ) and their attendance to day care was similar to that of Swedish children in general( 39 ).
The present results may be used to formulate some guidelines for situations where there is a wish to assess the amount of energy expended in response to physical activity in children aged 3 years or less. In such situations, it seems to be considerably advantageous to base such estimates on body composition variables rather than on body weight. However, even if body composition data are available, no reliable method for such assessments is, so far, available for individual children. For groups of children, using an appropriate method to assess the PAL value based on a record of the time spent on different activity categories complemented with an objective assessment of PAL (using, for example, Actiheart) may be tried.
In conclusion, we designed a diary to assess the PAL of 1·5- and 3-year-old children, which yielded mean PAL values in agreement with reference values when using MET values published by Ainsworth et al. ( Reference Ainsworth, Haskell and Herrmann 16 ). Furthermore, we found that Actiheart recordings explained a small but significant fraction of the variation in TEE at both these ages and that in AEE at 3 years of age above that explained by body composition variables. Finally, we identified topics for future research required to develop accurate and easy-to-use methods for assessing energy expenditure in response to physical activity in children aged 3 years or less.
Supplementary material
To view supplementary material for this article, please visit http://dx.doi.org/10.1017/S0007114513004406
Acknowledgements
The authors thank all the parents and children who participated in the study and Olle Eriksson for statistical support.
The present study was supported by grants from the Swedish Research Council (E. F., 15402), AFA Insurance (E. F.), the Medical Faculty of Linköping University (M. L. and E. F.), the County Council of Östergötland (M. L., E. F. and H. H.), the Crown Princess Lovisa Foundation (E. F.) and the Swedish Nutrition Foundation (H. H.). The funders had no role in the design and analysis of the study or in the writing of this article.
The authors' contributions are as follows: H. H. was responsible for data collection and contributed to the data analyses and manuscript preparation; E. F. contributed to the study design, data analyses and manuscript preparation; M. L. was responsible for the study design and contributed to the data analyses and manuscript preparation.
The authors declare that there are no conflicts of interest.


