

4.1 Introduction
Historic preservation efforts typically invite controversy, especially in high-cost cities. Advocates of preservation loudly trumpet the benefits of protecting the historic assets of a city, while critics charge that preservation freezes city neighborhoods and constrains their vital growth and development. Few observers have provided a balanced and thorough assessment of these costs and benefits, yet such an assessment is critical as city leaders make choices about which properties and neighborhoods to protect and preserve.
On the one hand, historic preservation clearly delivers benefits. The creation of historic districts may help to strengthen neighborhood identity, encourage social cohesion, and increase property values by providing certainty about future development. As Strahilevitz (Chapter 5, this volume) notes, preserving history – even a “fake” history created artificially to commemorate nonevents – has the power to generate feelings of community through a shared narrative of place-making. More fundamentally, preservation protects critical architectural and historical assets for future generations and provides a tangible link to our past. In New York City, preservation efforts have protected such architectural treasures as Grand Central Terminal and such classic nineteenth-century brownstone neighborhoods as Brooklyn Heights. We can still see the Greenwich Village townhouses where Edith Wharton, Hart Crane, and Malcolm Cowley were inspired to write and the Harlem brownstones where W. E. B. Du Bois, Paul Robeson, Count Basie, and other artists and intellectuals of the Harlem Renaissance brought to life twentieth-century African American culture. These historic assets are enjoyed not only by local residents, but also by visitors who travel to experience these historic buildings and neighborhoods.
On the other hand, historic preservation places constraints on a city’s ability to grow and develop by limiting the opportunity to construct new buildings or increase density on protected sites. Like other land use regulations, historic preservation rules impose new constraints that often halt the demolition of older buildings and limit the size and density of any newer ones. By imposing supply restrictions, the preservation process is likely to lead to higher housing prices and rents, both citywide and, quite possibly, within individual districts. By limiting the supply of rental housing through restrictions on new construction activity, it may drive overall prices up across the city. The requirements for higher-cost building materials in historic districts may translate into higher rents, creating obstacles for low- and moderate-income households to live in these neighborhoods. In the long run, these restrictions could limit the growth and economic development of cities as businesses seek out other places with lower housing costs and wages.
Decisions about which properties and neighborhoods to preserve are often politically charged, pitting preservation advocates against real estate developers. Developers lament the onerous restrictions the preservation process imposes while preservation advocates charge that the development process undervalues characteristics of the city that cannot be easily monetized in property transactions. Without a preservation process that explicitly values the historical character of neighborhoods and buildings outside of the market, these advocates worry that many places that contribute to the rich history and cultural fabric of the city will be lost to new development.
In this chapter, we argue for a more explicit and balanced assessment of the costs and benefits of preservation efforts in New York City. We focus on the establishment of historic districts, rather than individual landmarks, because these districts cover far more properties than individual landmark designations and, as a result, tend to invite more controversy. In calling for a balanced analysis of the costs and benefits, we acknowledge that many of the benefits of preservation are hard to quantify. After all, how do we put a dollar value on the existence of Grand Central Terminal or quantify the enjoyment of the streetscape of Greenwich Village by residents and visitors? But the difficulty in quantifying the full set of benefits does not mean we should avoid quantifying the costs.
To offer a balanced perspective on historic preservation, we offer new evidence on the development constraints imposed by historic preservation. We do so by calculating the amount of unbuilt floor area within historic districts and comparing the density and development of lots inside historic districts and lots in the neighborhoods immediately outside of them. In brief, we find that historic districts are built to a similar density level as the neighborhoods surrounding them, a finding that appears to suggest minimal constraints. However, we report that less new construction takes place in historic districts and that residential soft sites, defined as lots that are built to less than half of their zoned capacity, are less likely to experience redevelopment when they are located in historic districts. To create a more balanced approach to historic preservation, we argue that the planning process in New York City should consider these costs of preservation alongside the important, but less tangible benefits that preservation creates for the city. We conclude with a set of procedural suggestions for how the city can better make decisions about historic preservation in ways that balance their benefits against other planning goals.
4.2 The Landscape of Preservation in New York City
Established in 1965, the New York City Landmarks Preservation Commission (LPC) designates historic neighborhoods, properties, and scenic landmarks for protection under the Charter and the Administrative Code of the City of New York (Allison Reference Allison1996; Wood Reference Wood2007). In this capacity, the LPC is empowered to preserve historic districts that contain buildings with a unique historic or aesthetic appeal, represent one or more architectural styles in the city, and create a distinct body of urban history. While designated historic districts may include properties that do not contribute to the unique character of the neighborhood, a large majority of properties included in a historic district are supposed to contribute to the architectural, cultural, or historic character of a designated neighborhood.
Since the establishment of Brooklyn Heights as the city’s first historic district in 1965, the LPC has designated more than 100 districts across the five boroughs of New York City. By the end of 2014, with the designation of the Chester Court Historic District, the LPC had created 114 unique historic districts.1 Although these designations have occurred in communities throughout the city, they are largely concentrated in only a handful of areas. In Manhattan, historic districts are located disproportionately on the Upper East Side, the Upper West Side, and portions of the borough south of 14th Street, as shown in Figure 4.1. In Brooklyn, historic districts are concentrated largely in downtown Brooklyn and the neighborhoods surrounding Prospect Park.
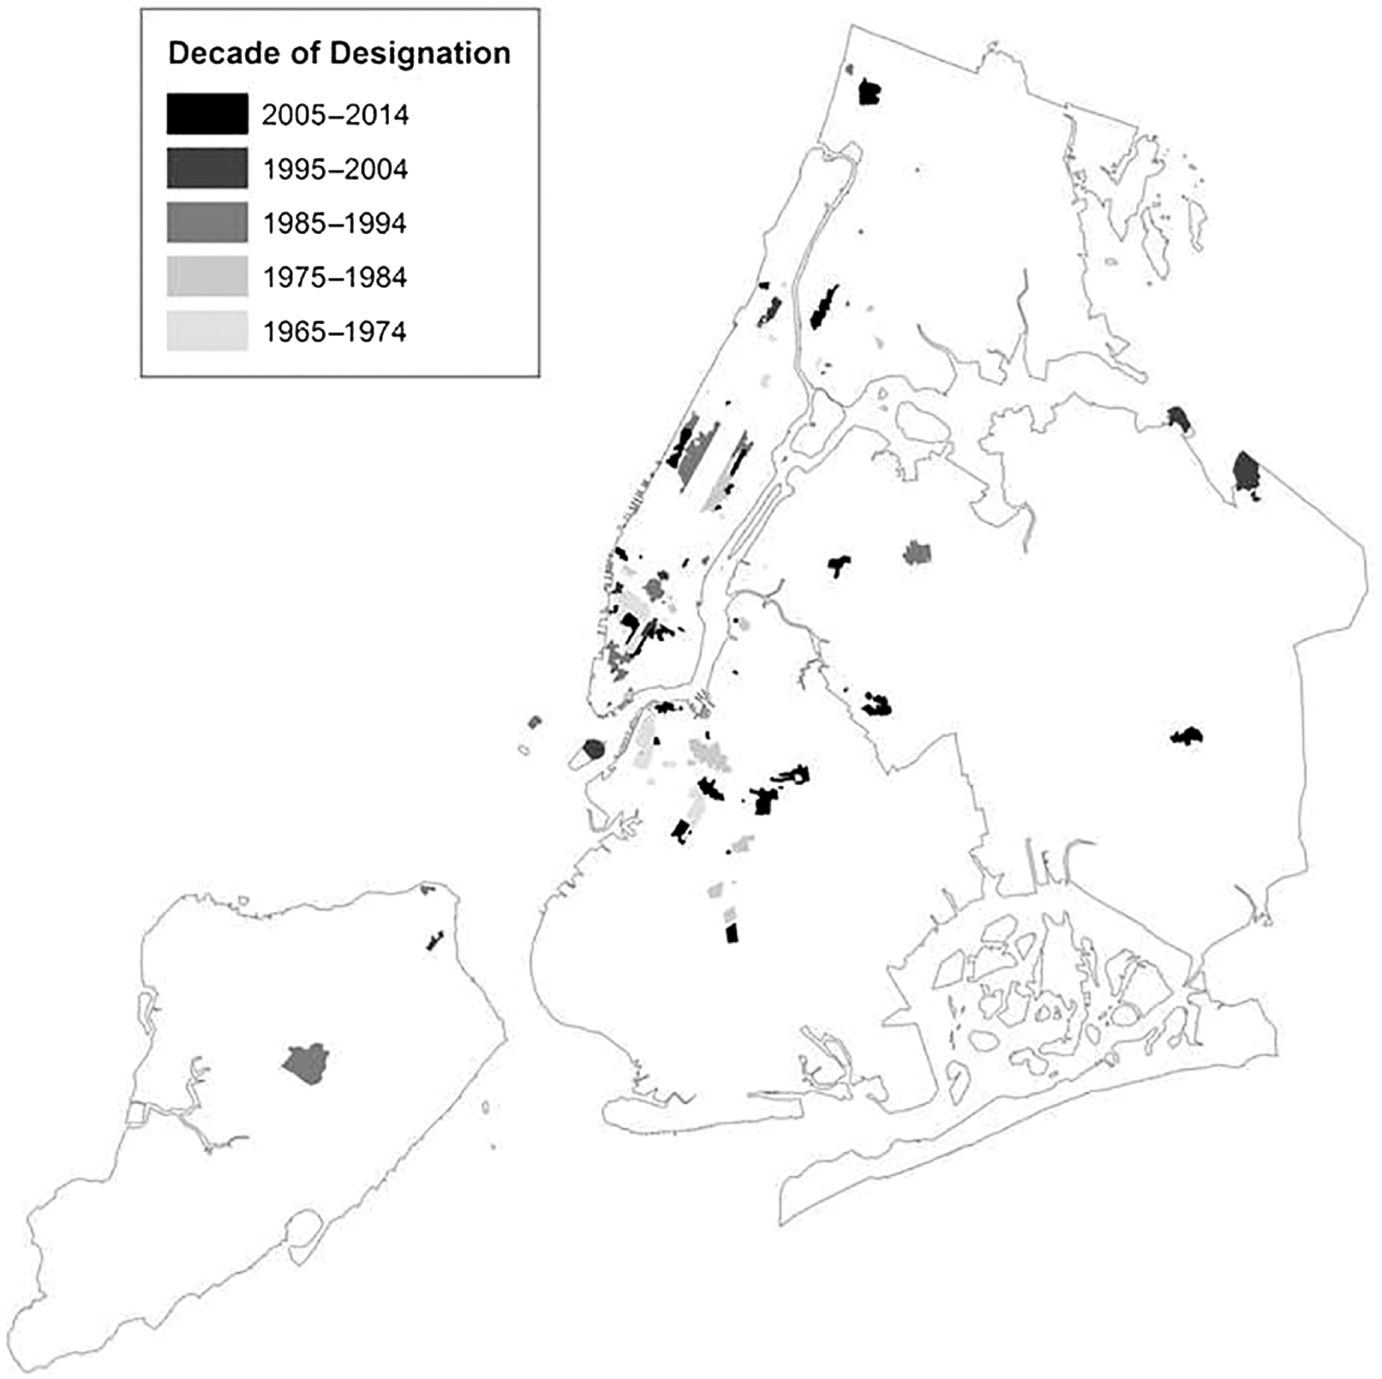
Figure 4.1 New York City Historic Districts and Extensions Added, by Decade
As the number of historic districts has grown over the past five decades, so too has the amount of land regulated by the Landmarks Preservation Commission. Figure 4.2 shows the growth in the number of lots included in historic districts over time, highlighting this growth across different mayoral administrations. The figure reveals a relatively steady pace of designation since the 1960s. By the end of 2014, there were more than 27,700 lots in historic districts in New York City. On average, district designations added 557 lots each year, though the pace of growth has varied across mayoral administrations. Mayor Wagner’s single year saw the designation of 1,279 lots, while Mayor Beame’s administration added an average of only 172 lots annually over his four years in office. While Figure 4.2 suggests a steady increase in the number of lots protected through the preservation process, it is worth noting that only 3.3 percent of lots were located in a historic district at the end of 2014. If preservation were to continue at the same pace going forward, it would take more than 700 years before the majority of the city’s lots were in designated historic districts. In Manhattan, however, it would take only another 50 years.
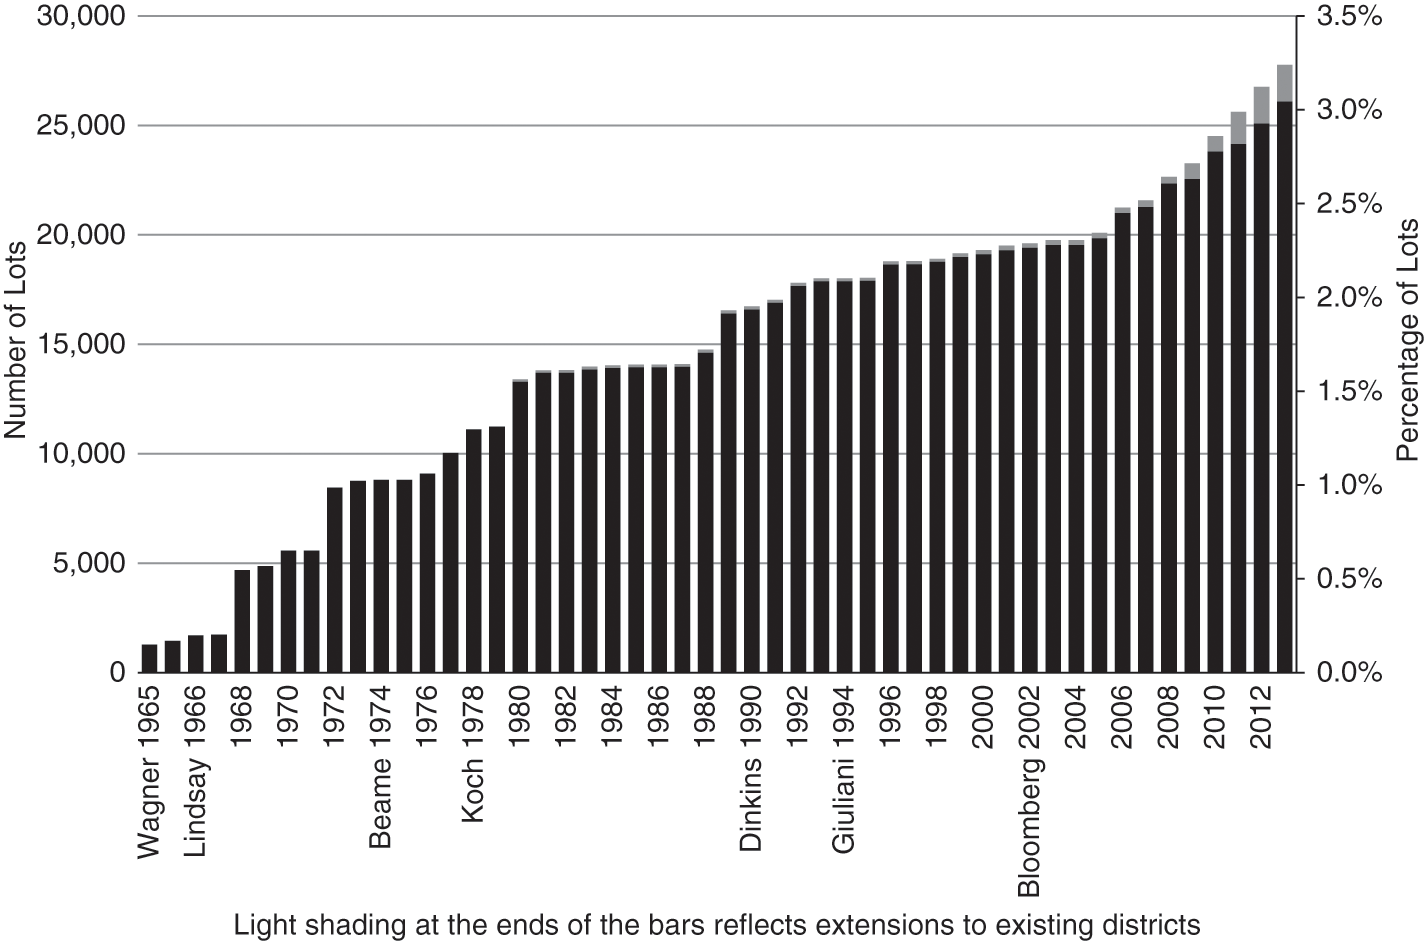
Figure 4.2 Count and Percent of City Lots in Historic District, by Year
Because lots in New York City are not uniformly sized, it is also useful to examine the proportion of total lot area included in historic districts. We report the comparisons between lots and lot area in Table 4.1. By 2014, about 3.3 percent of the lots in the city were regulated as part of a historic district. Historic districts covered about 3 percent of lot area, or slightly more than 125 million square feet of land, across New York City. These aggregate measures for New York City mask substantial variation across the five boroughs. In Manhattan, more than 25 percent of lots and nearly 15 percent of lot area were located in historic districts by 2014. These totals amounted to more than 50 million square feet of land on 10,762 lots. For critics of historic preservation worried about the impact of preservation policies on construction and development, the square footage of land regulated by the LPC in Manhattan is a worrying indication of excessive regulation in the city’s densest borough.
Table 4.1: Percent of Borough and New York City Lots and Lot Area Regulated by the Landmarks Preservation Commission, 2014
| Metric | NYC | Brooklyn | Bronx | Manhattan | Queens | Staten Island | |
|---|---|---|---|---|---|---|---|
| Historic Districts | Lots | 3.3% | 4.4% | 1.0% | 25.4% | 1.1% | 0.2% |
| Lot Area | 3.0% | 3.4% | 1.3% | 14.7% | 1.5% | 1.8% | |
| Individual + Interior Designations* | Lots | 0.1% | 0.1% | 0.1% | 1.6% | 0.0% | 0.1% |
| Lot Area | 1.4% | 1.8% | 1.9% | 5.2% | 0.1% | 1.3% | |
| LPC Designated | Lots | 3.4% | 4.5% | 1.0% | 27.0% | 1.2% | 0.3% |
| Lot Area | 4.4% | 5.2% | 3.2% | 19.9% | 1.6% | 3.1% |
Note: *The individual + interior designation row includes only designations not within historic districts.
While the table shows that 1.4 percent of lot area for New York City is covered by a lot containing an individual or interior landmark, the percentage drops to 0.6 if we restrict to the building footprint of individually designated landmark structures.
However, in the other boroughs, the LPC regulates a substantially smaller share of lots.2 Table 4.1 highlights this variation across boroughs. In Brooklyn, for example, only 4.4 percent of lots – and 3.4 percent of lot area – were regulated through historic districts by 2014. This includes approximately 37 million square feet of land located on 12,276 individual lots in the borough. In Queens, only 1.1 percent of lots and 1.5 percent of lot area were included in historic districts at the end of 2014.
4.3 Theory and Past Literature: Benefits and Costs of Historic Districts
The preservation of historic neighborhoods is likely to generate costs and benefits both for the residents of designated neighborhoods and for the city as a whole. To date, much of the research studying the impact of historic districts examines the net benefits property owners enjoy within districts, focusing specifically on housing price impacts following historic designation. Studies relying on longitudinal data to examine price changes in the wake of designation generally find that historic preservation has a negligible or even negative effect on property values (Asabere, Huffman, and Mehdian Reference Asabere, Huffman and Mehdian1994; Coulson and Leichenko Reference Coulson and Leichenko2001; Heintzelman and Altieri Reference Heintzelman and Altieri2013; Noonan and Krupka Reference Noonan and Krupka2011).3
Been and colleagues (Reference Been, Ellen, Gedal, Glaeser and McCabe2016) offer a model showing that the net effect of historic designation on the value of properties within the district is theoretically ambiguous. On the one hand, designation restricts the changes property owners can make to their buildings and largely prohibits demolition and redevelopment. As such, designation should reduce land and property values. On the other hand, designation minimizes the risk that new investments in neighborhoods will undermine the distinctive character of a historic community. As such, designation should boost property values to the extent that it preserves the historic character and architectural fabric of a neighborhood.
This model suggests that these relative costs and benefits will vary across neighborhoods. In neighborhoods where buildings are initially built to the allowable zoning cap or demand for the location is low, preservation should increase property values because owners are not giving up much in terms of development rights. However, in neighborhoods where demand is high and heights are far below the allowable zoning cap, the lost option value will be large. In those neighborhoods, we would expect property values to increase less, or even to fall, following the designation of a historic neighborhood. In addition, preservation should provide more benefit to owners if the neighboring historic homes preserved by the district rules are more aesthetically attractive.
Studying New York City, Been and colleagues (Reference Been, Ellen, Gedal, Glaeser and McCabe2016) undertake empirical work that largely confirms the predictions of their theoretical model. Designation appears to raise property values within historic districts, but only in the lower-valued boroughs outside Manhattan. Further, designation has a more positive impact on prices in neighborhoods that score higher on a measure of aesthetic appeal. Notably, properties located in the immediate neighborhood surrounding the historic district, defined by a 250-foot buffer, also experience a boost in property values following designation. These nearby homes enjoy many of the benefits of preservation, including neighborhood continuity and minimal risk of new development, without the restrictions imposed on individual property owners. Although the boundaries of existing districts are modified only occasionally to include additional lots, property owners in buffer zones may anticipate opportunities for future inclusion in an expanded historic district.
In addition to the changes to property values, historic preservation is likely to bring other long-term changes to designated neighborhoods. McCabe and Ellen (Reference McCabe and Ellen2016) report that the socioeconomic status of a neighborhood rises and the poverty rate declines after designation by the Landmarks Preservation Commission. While this process of community “upgrading” likely benefits many neighborhood residents, it may also create obstacles for low- and moderate-income renters looking for affordable housing in designated historic neighborhoods. As Phillips (Chapter 6, this volume) reminds us, physical preservation of architectural treasures, like churches, may do little to preserve the social capital in a community. In their conversion to residential units, these buildings often lose the role they played as key community institutions.
Beyond the impacts within individual neighborhoods, historic preservation efforts create benefits and costs for much broader populations, many of whom do not live in the neighborhoods protected by the preservation process. City residents and tourists alike often visit, enjoy, and learn from the architectural examples and cultural landscapes preserved through historic designation. These districts contribute to the creation of a distinctive identity for the city, promoting tourism and contributing to economic development. A set of comparative case studies argues that historic preservation has helped to fuel the economic revitalization of downtown office and retail districts and thereby helped to further broader economic development (Ryberg-Webster and Kinahan Reference Ryberg-Webster and Kinahan2014; Wojno Reference Wojno1991), although these studies tend to focus on National Historic Trust designation, rather than local designations. Designation through the National Historic Trust often comes with accompanying financial benefits that are likely to contribute to this process of economic development.
While preservation efforts may support tourism and contribute to economic growth, such benefits may come at the cost of restricting the supply of housing citywide. Critics contend that widespread historic preservation puts pressure on cities already grappling with challenges to building a sufficient supply of affordable housing (Glaeser Reference Glaeser2010). Yet, there has been little effort to quantify the impact of preservation on the citywide supply of housing, or to identify the number of housing units that could have been built absent historic preservation efforts. To the extent that historic designation restricts the supply of housing within districts, it will also restrict the overall supply of housing in a city unless other areas outside of the district are upzoned to compensate for the lost development capacity. Although regulating a small number of lots through the historic preservation process is unlikely to dramatically reduce the overall supply, as the number of lots included in historic districts increases, concerns about supply restrictions become more valid. In cities with both a robust preservation process and a tight housing market, restrictions imposed by historic designation could put upward pressure on housing prices and rents, ultimately limiting economic growth, heightening economic segregation, and contributing to concerns about housing affordability.
4.4 Historic Preservation, Growth, and Development
Critics of historic preservation policies often express concern about the regulatory burdens imposed by efforts to protect historic neighborhoods. In protecting historically significant neighborhoods from changes to the historic character of a community, the preservation process may also limit opportunities for continued growth and development across the city. Critics contend that preservation policies restrict the buildable capacity of neighborhoods, eliminate opportunities for new construction, and inhibit the redevelopment of residential soft sites. If so, then historic preservation policies may contribute to the crisis of affordable housing by constraining opportunities to increase density or build additional housing.
There has been little empirical research to formally analyze the degree to which historic districts constrain development. Given that designation is clearly not random, estimating the impact of historic districts is challenging. For example, historic districts are more likely to be established in areas with older homes. It is possible that historic districts are proposed in neighborhoods that don’t already have other zoning constraints, or that these zoning constraints are more likely to be adopted in areas without historic buildings. Even though we do not claim to precisely identify the impact of historic districts, we seek to better understand the relationship between preservation and development by comparing the density levels, buildable capacity, and construction activity on lots inside and outside of historic districts in New York City.
We begin by comparing the built density of lots located inside these districts with lots located outside of them, including the fraction of allowable density used. Next, we consider new construction and alteration activity on individual lots. By comparing lots located in historic districts to other nearby lots in the community, we quantify the extent to which these lots attract less new construction activity. Finally, we examine whether residential soft sites, or lots built to less than half of their zoned capacity, are less likely to be redeveloped inside of historic districts. Soft sites create a unique opportunity for residential redevelopment, and our analysis investigates whether historic preservation affects the likelihood of this redevelopment.
Because historic districts tend to be concentrated in particular neighborhoods in the city, simple comparisons of density and development intensity between lots located inside of historic districts and those outside of them are likely to be misleading. These comparisons may simply capture differences between the high-density neighborhoods in lower Manhattan and downtown Brooklyn, where historic districts are concentrated, and other parts of the city. To provide a more accurate comparison, we instead compare lots inside historic districts to those lots outside of the district that are still located in the same general neighborhood, as measured by community districts. Community districts are sub-borough areas that include between 50,000 and 250,000 residents. By the end of 2014, 32 of the city’s 59 community districts housed at least one historic district. Each of these community districts also contained many unregulated parcels.4
Throughout the analysis, we estimate regressions for several measures, including lot density and development ratios. We include a dummy variable that identifies whether a parcel is located in a historic district, as well as community district fixed effects. With these fixed effects, the coefficient on the historic district indicator identifies whether, on average, the characteristics of lots located inside historic districts differ from those of lots located outside those districts, but still in the same general neighborhood.
4.4.A Sample
Throughout the analysis, we rely on shape-files provided by the New York City Landmark Preservation Commission. As of March 2015, these files identify the lots located within historic districts. We overlay MapPLUTO shape-files from the New York City Department of City Planning with the historic district maps to determine the land area of each lot covered by a historic district. Lots with less than 100 square feet of coverage by a historic district were not included within a historic district for purposes of our analysis. We exclude lots with a land use category of “09,” known as “Open Space and Outdoor Recreation,” as well as other lots classified as parks. We also exclude Ellis Island, Liberty Island, airports, large underwater lots, and lots with no calculated lot area.
We use the Zoning Resolution of the City of New York and the primary zoning district information on MapPLUTO 2007 to assign maximum residential and nonresidential floor area ratios (FAR) to each lot (and assigned FAR based on majority lot area coverage in the instances of a split zoning lot) as of 2007. Adjustments are made to the maximum floor area to account for special district regulations and as-of-right zoning bonuses (e.g., Inclusionary Housing Program and plaza bonuses).
For the regression analyses summarized in Table 4.2, we begin with a sample of 851,059 lots.5 From there, we exclude 1,154 New York City Housing Authority (NYCHA) lots, 1,272 lots located in transfer districts, and 1,164 lots with individual or exterior landmarks. For the analysis of permitted floor area ratio, the final sample is 847,469 lots. For the remaining analyses in Table 4.2, we exclude lots designated as a historic district after 2004 because we are testing for differences in development patterns between 2004 and 2014 for parcels within and outside of historic districts as of 2004. This brings our sample to 838,963 lots. The sample used for the analysis of residential soft sites, which we report in Table 4.3, starts with lots as of 2007, makes the same exclusions, and is then restricted to 194,360 residential lots classified as soft sites in 2007.
Table 4.2: Differences between a Historic District Lot and a Non-historic District Lot
| In New York City | In the Same Community District | |
|---|---|---|
| In the Share of Permitted Floor Area Used (2014) | 12.30 percentage points | 7.15 percentage points |
| In the Share of Lots with New Construction Activity (2004–2014) | ‒ 3.28 percentage points | ‒ 2.91 percentage points |
| In the Share of Lots with an Alt 1 Permit (2004–2014) | 4.03 percentage points | 0.48 percentage points (not significant) |
Table 4.3: Probability of 2007 Residential Soft Site Receiving a New Building, 2008–2014
| Lot Characteristics, as of 2007 | (1) New Building, 2008–2014 | (2) New Building, 2008–14 |
|---|---|---|
| In Historic District | −0.0357*** | −0.0303*** |
| (0.00498) | (0.00559) | |
| Building Age | 7.65e-05* | |
| (4.20e-05) | ||
| Vacant Lot | 0.0489*** | |
| (0.00821) | ||
| Built FAR | −0.0260*** | |
| (0.00344) | ||
| % Allowable Residential Area Used | −0.0468*** | |
| (0.00433) | ||
| Constant | 0.0339*** | 0.0479*** |
| (0.0000991) | (0.00494) | |
| Observations | 194,360 | 194,360 |
| R-squared | 0.009 | 0.043 |
| Community District Fixed Effects | X | X |
Robust standard errors in parentheses.
*** p < 0.01, ** p < 0.05, * p < 0.1
4.4.B Allowable and Built Density
We begin by simply comparing the built density levels of lots inside and outside of historic districts. As of 2014, we find that lots within historic districts were built to the same density as lots that were outside of these districts, but located in the same community district. Our first pass, then, suggests that historic districts might not do much to constrain density levels.
Rather than considering the built density of lots, however, an arguably better test is whether properties located in historic districts use less of their allowable zoning capacity than other nearby properties. Although this finding would not prove that lots in historic districts would be built to higher density absent their designation, it would suggest a constraint on the development process resulting from historic preservation. To identify the proportion of development capacity used on a lot, we divide the built floor area by the maximum floor area allowed on the lot.
The first row of Table 4.2 shows the difference in the share of permitted floor area used by lots inside and outside of historic districts. On average, we find that lots located inside historic districts utilize 12 percentage points more of their permitted floor area than other lots around the city. Citywide, the average lot within a historic district uses 59 percent of the permitted floor area. By comparison, the average lot outside of a historic district uses only 47 percent of permitted floor area. When we estimate our regressions with community district fixed effects, we find that this basic difference holds within community districts, but that the gap between lots located in historic districts and those outside of them shrinks: the initial gap of 12 percentage points from the citywide comparisons shrinks to just 7 percentage points when we make comparisons within the same community district. Both differences are statistically significant at the 5 percent level.
In short, as of 2014, our analysis reveals that owners of parcels in historic districts used more of their formal development rights than owners of other properties.6 In part, this is because historic districts are protecting properties that were built prior to the 1961 Zoning Resolution, which reduced allowable density levels throughout the city (New York City Department of City Planning). In historic districts, 98 percent of buildings were built before 1961 and nearly 9 percent of those pre-1961 parcels were built to density levels that current zoning would not allow. But going forward, the more relevant questions concern the likelihood that lots will be redeveloped in the future and that the development rights that technically exist in historic districts will be used. Thus, analyzing actual development activity within historic districts arguably offers a better test of the constraints imposed by historic preservation.
4.4.C New Construction and Alteration Activity
To analyze new construction, we examine whether lots located in historic districts by the start of 2004 were less likely to see new construction activity between 2004 and 2014 than other lots. The second row of Table 4.2 shows that lots in historic districts were, on average, just over three percentage points less likely to see new construction than other lots around the city. When we estimate a regression of new construction activity including community district fixed effects, we see that lots located inside historic districts were slightly less than three percentage points less likely to experience new construction compared to lots outside those districts but located in the same community district. These differences are both statistically significant. There are some notable outliers to this citywide average. For example, in the Tribeca North Historic District, 10 percent of lots saw new construction activity during this 10-year period. On the other hand, more than half of districts – 52 in total – reported no new construction activity between 2004 and 2014.
Finally, the third row of Table 4.2 shows differences in the share of lots that received alteration permits approving building renovations. We focus on Alteration 1 permits, which include a change in the Certificate of Occupancy. When we compare citywide differences, the results show that lots in historic districts were more likely to receive alteration permits than lots not regulated by the LPC. However, this difference goes away (or loses statistical significance) when we estimate a regression to account for differences across community districts. In other words, historic districts were no more or less likely to receive alteration permits than other nearby lots.
While these analyses show that lots inside of historic districts are less likely to see new construction than other nearby lots, these findings do not control for the likelihood of redevelopment or new construction before historic district designation. It is possible that historic districts are designated in areas where little new construction would take place even absent the designation. In previous research, we find that although new construction is less common on sites within historic areas than on other sites, even before they are designated as districts, the district designation widens the gap (Been et al. Reference Been, Ellen, Gedal, Glaeser and McCabe2016). In other words, following designation, sites within historic districts are significantly less likely to see new construction than they were before designation, even after controlling for development trends in the surrounding neighborhood.
4.4.D The Development of Residential Soft Sites
Finally, we consider the development of residential soft sites, or lots built to less than half of their permitted development capacity under current zoning regulations.7 Because these sites are substantially underbuilt relative to the allowable density under existing zoning regulations, they are prime locations for redevelopment. In this section, we explore whether such residential soft sites are less likely to be redeveloped when they are located within historic districts.
Across New York City, 19 percent of lots located in historic districts were soft sites in 2007 compared to 22 percent of lots located outside of those districts.8 To test whether these sites are less likely to be redeveloped when they are located in historic districts, we estimate a regression of the probability that a 2007 soft site was redeveloped, or a new building was constructed on it, between 2008 and 2014.9 We control for several features of the lot, including whether the site is vacant, the share of allowable density used, and the age and size of any existing building. With these controls, we can test whether buildings of a similar size, age, and allowable zoning capacity were less likely to be redeveloped when they were located in a historic district. We also include community district fixed effects to control for the local neighborhood.10 Our key independent variable is whether the parcel is located in a historic district as of 2007.11 Our analysis is reported in Table 4.3.
Consistent with our expectations, we find that vacant lots are substantially more likely to be redeveloped than lots with existing buildings. Lots with structures built more recently, as well as those with larger buildings and buildings that use up more of their allowable development rights, are less likely see new construction. Critical for our analysis, we find that after controlling for these factors, soft sites located inside a historic district are significantly less likely to experience new construction than those located outside of a historic district. The owners of soft sites are less likely to redevelop their lots when they are located in historic districts.
While in the short run, these differences are not likely to radically alter the course of development, in the longer run, they might. Historic districts have locked up quite a bit of floor area in New York City, or at least made it more difficult to develop. In 2014, we estimate, roughly 119 million square feet of allowable residential floor space was unused on privately owned lots in historic districts, based on built density and currently allowable floor area ratios. This translates into roughly 119,000 housing units. To be sure, these units would not immediately (or necessarily) be built absent historic district designation, and there may be other zoning constraints present that make it impossible to build to the maximum allowable floor area ratio. Historic districts constrain density only to the extent that development is unconstrained by other regulatory tools. However, our results show that this “allowable” residential square footage would be more likely to be built in the absence of designation.
4.4.E The Cost of Supply Restrictions
Our analysis reveals that while lots in historic districts are not built less densely than other lots today, they are likely to see less new construction, and therefore add less density, in the future. Such supply restrictions have several implications. First, we expect these restrictions to increase prices and rents. In neighborhoods designated as historic districts, Been and colleagues (Reference Been, Ellen, Gedal, Glaeser and McCabe2016) report localized property value increases following the designation of historic districts. These price changes are concentrated in neighborhoods in the outer boroughs where the lost option to redevelop is high. However, the establishment of historic districts is also likely to constrain overall development in the city, especially as additional districts are added.
It is difficult to quantify this more generalized impact of preservation on citywide prices. Identifying a citywide counterfactual – for example, a similarly high-cost city without preservation efforts – is impossible. And while we expect preservation efforts to contribute to skyrocketing prices by restricting the supply of housing, we expect these supply constraints are not among the most important explanation for rising prices and rent inflation across New York City. Many other factors contribute to rising prices and rents in the city, including the strong economy of the city, the enduring popularity of New York as a place to do business, the limited supply of land, and the many other restrictions on building activity in the city (Salama et al. Reference Salama, Schill and Springer2005). Beyond concerns about increasing prices and rents, it is possible that these supply restrictions could limit overall economic growth in the city. Workers may demand higher wages to afford the cost of living in the city, and businesses untethered to the economy of New York City may choose to leave the city for places with cheaper housing and an ample supply of workers.
Finally, supply restrictions that result from historic preservation are likely to exacerbate patterns of economic segregation in urban neighborhoods. In the decades following historic designation, neighborhoods experience increased polarization as poverty rates decline and neighborhood incomes climb within districts (McCabe and Ellen Reference McCabe and Ellen2016). It appears that the supply restrictions imposed by historic preservation are attracting high-income households who value the amenities of historic neighborhoods and are willing to pay a premium to live in these aesthetically appealing, high-status neighborhoods.
These patterns of economic segregation are increasingly evident in neighborhoods regulated through the historic preservation process. By 2012, the composition of neighborhood residents living in New York’s historic districts was substantially different than the composition of residents outside of them. In Figure 4.3, we compare the average household income in census tracts with at least half of their lots located in a historic district to tracts with fewer than half of their lots in historic districts and tracts located completely outside of those districts. The average household income in census tracts comprised mostly of lots within a historic district was $160,192 – more than twice the income of neighborhoods entirely outside of districts.12 These differences, which are driven by Manhattan and Brooklyn, result from both initial differences between neighborhoods and the actual impact of historic preservation.
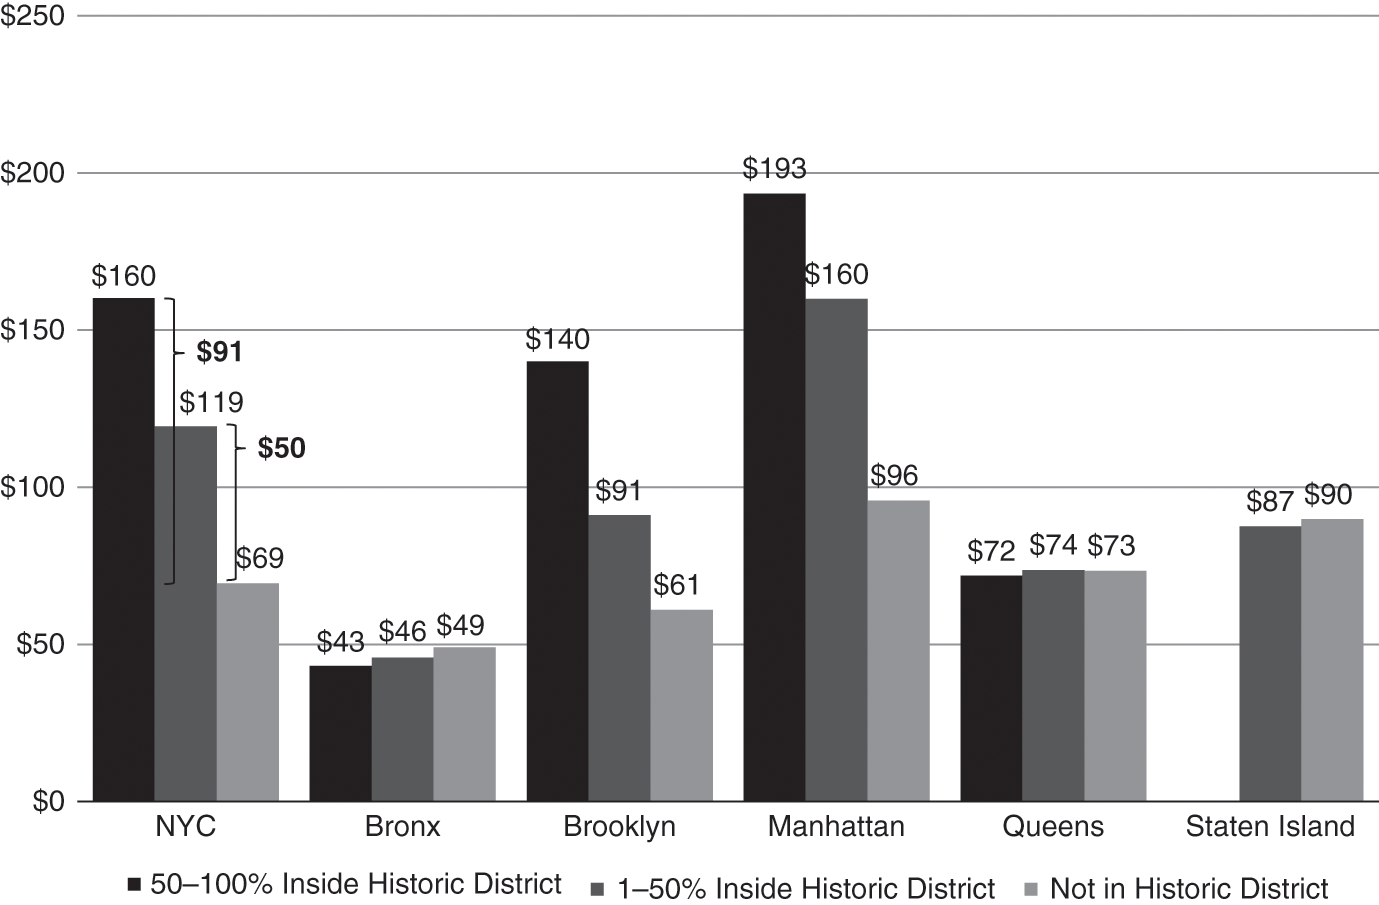
Figure 4.3 Average Household Income (in Thousands) for Census Tracts by Historic District Coverage, 2012
Beyond these variations in average income, we find other substantial differences between the population living within historic districts and the comparable population living within the same community but outside the district boundaries. The poverty rates in census tracts made up mostly of historic districts are significantly lower than the rates in nearby tracts within the same community district, and the share of the population with college degrees is substantially higher.
4.5 Policy Responses
By offering a more nuanced account of the costs and benefits of historic preservation, this chapter invites a rethinking of the preservation process in New York City. To be clear, we are not questioning the designation of any existing historic districts, nor are we advocating for the active preservation community in New York City to curtail their efforts to protect the historic fabric of the city. The Landmarks Preservation Commission, in collaboration with countless advocates and allies, has preserved many historically important buildings and neighborhoods, contributing to the richness of the city that attracts visitors and residents alike. Instead, our analyses are intended to highlight that historic preservation does not come without costs. Preservation limits opportunities for redevelopment and, in doing so, constrains the supply of housing in the city.
Currently, the process for designating historic districts in New York City does not allow for deliberate consideration of the full range of costs associated with designation. Because the Landmarks Preservation Commission is tasked with preserving the rich historic assets of the city, it does so with limited consultation from other agencies. The Department of City Planning and the City Council are formally brought into the process only after approval from the Landmarks Preservation Commission. As such, the current process does not allow for a rigorous balancing of the goals of preservation against other planning goals, including efforts to develop affordable housing. Although officials from the Landmarks Preservation Commission present the district at a public hearing at the City Planning Commission following LPC approval, the City Planning Commission has no power to amend the proposal before it goes to the City Council. Indeed, although the Commission can recommend modifications to the proposal (e.g., the removal of particular properties), in practice, it typically just forwards the approved district along to the City Council.
Similarly, the City Council reviews LPC designations, but the process is an administrative rather than a legislative action. As a result, the Council is constrained in its ability to reject or modify historic designations, as it can only make decisions based on the administrative record and cannot take other considerations into account. In practice, the City Council has approved all proposed districts with only minimal changes.
Several reforms could allow policy makers to weigh a broader set of benefits and costs. First, New York City’s preservation decision-making process could be restructured. In some cities, like Baltimore and Chicago, historic preservation officials sit within the city planning agency, allowing for greater coordination and consideration of broader planning goals in historic preservation decisions. Similarly, in Washington, DC, the Historic Preservation Review Board (HPRB) – the city’s comparable agency to New York City’s Landmarks Preservation Commission – is incorporated into the Office of Planning, ensuring that the goals of historic preservation are considered within the planning process. The mayor of Washington, DC, also appoints a special agent for historic preservation to help adjudicate conflicts about development in historic districts, including conflicts about whether the demolition of buildings within historic districts can be permissible on a case-by-case basis to strengthen other goals of the planning process. The agent can decide if the city should issue a building permit for projects deemed of “special merit,” or if the failure to do so would result in “unreasonable economic hardship to the owner.” This process creates the opportunity for an independent assessment that weighs the benefits of preservation against other goals of the city-planning process. While there is no guarantee that such an agent will be balanced in his or her assessment, this process at least offers the potential for an additional independent voice in this politically charged process.
While it is hard to imagine adopting these approaches in New York City, given the size and history of the Landmarks Preservation Commission, it is worth considering other ways for the designation process to meaningfully consider potential adverse impacts. One alternative would be to create a process that requires formal comment from the City Planning Commission prior to an LPC vote of designation. This would bring the City Planning Commission’s expertise on zoning, development patterns, and broader planning goals into the designation process. Indeed, city law could require that the Department of City Planning issue a report describing the effects of historic designation on residential development. These reports could include a “Housing Impact Statement” that would estimate the number of potential housing units (or residential square footage) that could no longer be built as-of-right following the designation of a proposed district. This calculation is surely imperfect; for example, it merely suggests the amount of residential square footage that is locked in or hindered given current zoning. Still, with this information, the City Council could be better armed to weigh the benefits of preserving historic assets against a more complete assessment of the costs of preservation. Public disclosure of the supply restrictions that the preservation process imposes would create a more balanced process that considers the costs of historic designation alongside the many benefits.
Once the debate surrounding a historic district designation includes consideration of the impact on housing supply, there might be greater pressure for the City Council to seek mitigation measures for the adverse impact. A mitigation could include an effort to upzone nearby areas to preserve the total amount of residential capacity. City officials might also consider supporting the creation of affordable housing in newly designated historic districts to mitigate the potential effects on localized housing prices and rents.
In addition, New York City’s historic district regulatory framework could permit as-of-right development activity on vacant sites and noncontributing buildings within historic districts. While anecdotally, the LPC attempts to keep such sites outside of historic districts when sites are on the periphery of a proposed district, there are many instances where vacant and noncontributing structures are included. The uncertainty regarding development on those lots increases the risk and cost associated with investing in new housing within historic districts.
The city might also reconsider the review process for noncontributing buildings within historic districts. New York City could follow Washington, DC, and Philadelphia’s example and specifically identify which structures are noncontributing in order to provide greater certainty regarding redevelopment opportunities of noncontributing sites. While the owner of a vacant lot knows that her lot can be developed within a historic district pending design review by the LPC, an owner of what appears to be a noncontributing building does not currently have certainty that the LPC will permit redevelopment.13 Policy could be modified so that designation reports explicitly identify noncontributing structures and permit owners to demolish such structures without any further LPC review. While the design of a new building would still be subject to LPC review through the Certificate of Appropriateness approval process, owners would have greater certainty about the potential for redevelopment. This might facilitate increased investment in new construction within historic districts.
To go one step further, New York City law could be amended to provide for an as-of-right framework for new construction on vacant and noncontributing sites. While the Certificate of Appropriateness approval process for new construction currently requires public review and a Commission-level review, one could imagine a designation report detailing design guidelines for new construction on developable sites. As long as a developer met clear design guidelines as certified through a ministerial LPC staff-level review, the Department of Buildings would issue permits for new construction. If a developer sought to construct a building with an alternative design, the developer would still have the ability to go through the typical Certificate of Appropriateness review process.
4.6 Conclusions
In New York City, the Landmarks Preservation Commission plays a critical role in preserving the unique history of the city through the designation of historic neighborhoods and individual landmarks. Protecting the architectural integrity and cultural significance of urban neighborhoods offers an array of benefits to residents of designated neighborhoods and the city as a whole. The iconic buildings of New York help to attract millions of tourists each year, and the streetscapes of neighborhoods like Harlem, Greenwich Village, and Brooklyn Heights attract highly skilled workers who contribute to the economy of New York City. The designation process keeps alive the unique and rich history of the city. Although many of these benefits are difficult to quantify, they should not be undervalued in any assessment of the place of preservation.
But while affirming the benefits of preservation, this chapter serves as a reminder that historic preservation, like other land use regulations, imposes costs by restricting development. To be sure, historic preservation is just one of many regulations that limits opportunities for redevelopment and new construction. Indeed, our findings suggest that lots in historic districts are built at comparable densities to those of others nearby, in part because historic districts generally protect buildings that were developed at a time when the city’s zoning code was more lenient.
However, our analysis suggests that the creation of historic districts is likely to constrain the development and supply of housing in the future. Residential soft sites located in historic districts are less likely to see redevelopment activity compared to nearby soft sites outside of the district. More generally, lots located in historic districts experience less new construction relative to nearby lots that are not regulated by the Landmarks Preservation Commission. And significantly, this gap in construction activity is heightened after historic districts are designated. These findings suggest that historic preservation is likely to restrict the supply of housing going forward. These costs of preservation must be balanced against the benefits of preserving the historic assets of the city. An integrated process that incorporates preservation goals into the broader planning process would ensure that the costs and benefits of historic preservation are more adequately assessed in New York City.
Authors’ Note
We would like to thank Eric Stern for his excellent research assistance with this chapter.
Land’s permanence is also what makes land unique. Every spot on earth has a past and an enduring future, and those attributes spark human curiosity about any given spot’s significance. This dynamic plays out when people are considering where to live, where to shop, where to work, or where to spend their leisure time. And history is frequently a selling point.
For example, at a picturesque country club in Sterling, Virginia, a solemn stone marker commemorates the scores of Civil War soldiers who died at a Potomac River crossing. A lovely plaque, installed on a riverside boulder, reminds golfers and passersby that “Many great American soldiers, both of the North and South, died at this spot. … The casualties were so great that the water would turn red and thus became known as ‘The River of Blood.’”
There is one small problem with the River of Blood monument. There is no historical evidence suggesting that any soldiers were killed at the spot in question. The closest known Civil War battle occurred 11 miles away. The River of Blood tale appears to have been concocted by the country club’s namesake, who insisted that “numerous historians” had told either him or his people (accounts varied during a single conversation with a reporter) that the golf course was built at the site of a river-crossing conflict. So the dubious plaque remains, near the fifteenth tee at the Trump National Golf Club (Fandos Reference Fandos2015).
A natural first instinct upon hearing of this apparent fabrication is recoil. There is something troublesome about an inauthentic stone marker and the tale underlying it. Perhaps a false marker like this one leaves people confused about history they ought to understand or makes people mistrust the historical memorials at sites of genuine bloodshed. What motive would someone have to lie about such a thing? It isn’t obvious that consumers demand golfing opportunities where the players must avoid the river in order to spare themselves guilt over desecrating a battlefield, to say nothing of a one-stroke penalty.
And yet, of all the lies Donald Trump has told, this seems a rather harmless one. There were certainly plenty of Civil War soldiers who did die near the Potomac, even if none of them fell anywhere close to the fourteenth green. Perhaps the stone marker piques the curiosity of some caddies, and sparks their own research into the war. Or it causes a golfer to reflect on the life of a great, great grandfather, who really did die during America’s bloodiest conflict.
This story about the River of Blood implicates a broader question. Is authentic history, in the hands of imperfect human institutions, superior to the kind of fake history commemorated at the Trump National Golf Club? With reluctance, the author has tentatively concluded that the answer is “not by much.” When society presents authentic historical facts to present generations, especially in a manner tied to historical markers in physical space, it often does so in a manner that is so selective, so simplified, or so beholden to contemporary preferences that its value over contrived history appears to be marginal. At the same time, the costs of historical preservation can be quite significant. Societies that prompt private property owners to preserve their property in a particular way either substantially constrain what owners can do or devote substantial financial resources (via tax incentives, typically) to inducing forms of past-preservation in which many owners would not otherwise engage. Contrived history is cheap and voluntary. “Genuine” history is expensive and often needs to be compelled. Against that backdrop, this chapter will reconsider an implicit premise in American constitutional law that is now decades old – the idea that there is a strong state interest to compel the preservation of historic property.
Along the way, this chapter will also examine previously ignored aspects of fake history and historic preservation. Real estate developers who embrace contrived history can send powerful signals to would-be residents about who is welcome in a particular community. Choices about how to construct a community’s mythology may influence who decides to settle there. A new community in Florida has embraced Trump-style fake history with gusto, albeit with an occasional admission of the narrative’s fictitious nature. That same community also happens to be one of the most racially segregated places in the United States. This correlation is perhaps not coincidental. And to the extent that the segregation arises by design, the success of that strategy in Florida should alert us to the possibility that more traditional forms of historic preservation, which selectively highlight some aspects of a built environment’s past while ignoring other parts of a community’s history, can also promote residential homogeneity.
Comparing the phenomenon of fake history to traditional historical preservation efforts in cities may help us understand previously underemphasized implications of historic preservation regulation and fair housing laws. Part 1 of this chapter begins with a case study of The Villages, the Florida community in question. Drawing on scholarship from geography and other fields, it shows how the tendency to concoct, embellish, or distort a community’s history is widespread and exists in a great many cultures. Part 2 then examines the costs and benefits of historic preservation requirements in the United States, and Part 3 reviews the Supreme Court’s landmark decisions in Berman v. Parker and Penn Central Transportation Co. v. New York City.
5.1 Fake History in The Villages and Elsewhere
The Villages, Florida, is an interesting residential community from a social scientific perspective. Four things stand out about The Villages. First, in percentage terms, it is the fastest-growing metropolitan area in the United States (Fishleder et al. Reference Fishleder, Schonfeld, Corvin, Tyler and VandeWeerd2016). Second, it is evidently the largest age-restricted community in the United States (Ness Reference Ness2013). Third, The Villages is strikingly homogenous with respect not only to age but to other demographic dimensions as well. Although it is located in a very diverse state, less than one percent of its residents are African American and barely more than one percent of its residents are Latino (Fishleder et al. Reference Fishleder, Schonfeld, Corvin, Tyler and VandeWeerd2016; U.S. Census Bureau Villages CPD 2016). The nearest large city, Orlando, is an hour’s drive from The Villages, and its population was 28 percent African American and 25 percent Latino in the 2010 census (U.S. Census Bureau Orlando City CPD). The Villages is therefore one of the whitest parts of the United States. Several other large retirement communities in the United States are also overwhelmingly Caucasian, but not to the extent of The Villages.1 Finally, The Villages sports thousands of clubs for residents and an abundance of social capital.
The Villages is a collection of numerous gated communities, each with its own swimming pool and community center. Nearly all of the homes in The Villages are single-story, with a collection of ranch-style, single-family homes and townhouses. Home prices typically range from the $200,000s to the $600,000s. The Villages population in 2010 had an adult labor force participation rate of just 15 percent, according to the Census Bureau, suggesting nearly universal retirement. Economic life in The Villages is organized around three pedestrian- and golf-cart-friendly “downtowns,” each of which has its own movie theater, bars, restaurants, and shops, all catering to the community’s elderly residents. These downtowns are not gated and attract some residents from outside the development. Restaurants tend to be very busy at 5:30 p.m. and largely empty by 7:30. Music is piped into the downtowns from omnipresent speakers, occasionally interrupted by news bulletins from Fox News. Republican presidential candidates run very well ahead of their Democratic counterparts.
The Villages began, rather ignominiously, in 1982, when Harold Schwartz purchased a mobile home park in a rural part of Florida between Orlando and Ocala (Bartling Reference Bartling, DeHaene and De Cauter2008). During the 1990s, Schwartz took advantage of a Florida-specific institution called the Community Development District, which permitted large-scale real estate developers to form their own quasi-municipal governments that could levy taxes and issue tax-favored bonds to raise money for community infrastructure (Bartling Reference Bartling2007). Schwartz and his son, Gary Morse, then acquired large swaths of land surrounding his mobile home park, land previously occupied by watermelon farmers and ranchers, with plans to quickly grow the population from nothing to 100,000 people by 2020. The Villages’ development proceeded ahead of schedule; its population actually reached 110,000 people by 2014 (Olorunnipa Reference Olorunnipa2014).
Given its very recent formation, the extreme racial homogeneity found among The Villages’ population is stunning. Some municipalities that are similarly overwhelmingly Caucasian, like Mentor, Ohio, have been in existence since the eighteenth century. Over generations, patterns of racial segregation can persist and can affect the residential location choices of subsequent potential homebuyers. Neighborhoods known to be overwhelmingly white signal African American buyers to exclude themselves (Boddie Reference Boddie2010). But The Villages was founded in a very diverse part of the country during an era in which the Fair Housing Act was already on the books. So the mechanisms by which this extreme racial homogeneity arose are less blatant.
The Villages is largely a company town. The Morse family initially owned all the residential and commercial real estate, as well as all 42(!) of the golf courses, and other recreational amenities. The development generated $9.9 billion in revenue from 1986 to 2014, enabling the Morses to amass a $2.9 billion family fortune (Olorunnipa Reference Olorunnipa2014). Morse-owned entities contracted with one another, often obligating The Villages homeowners to pay assessments that covered the costs of the golf courses and other amenities (Bartling Reference Bartling2007).
A visitor to any of The Villages’ three downtowns will quickly notice their distinctive retro theming. Mediterranean architecture pervades Spanish Springs, Lake Sumter Landing is designed to look like a Florida beach town set alongside a large, manmade lake, and Brownwood brings to mind an Old West cattle town out of West Texas or Arizona. No structures in any of the downtowns clash with the towns’ respective themes, and the developers went to great lengths to evoke a particular era, mood, and place in each of the downtowns. There is not a single example of modern architecture to be found, and yet all the downtowns are essentially new. Nor are there any residences in the downtowns. Those single-story homes are all a car or golf-cart ride away, providing residents with the sorts of low-density residential suburban sprawl that they became accustomed to before moving to Florida and the sorts of walkable commercial spaces that new urbanists favor (Rybczynski Reference Rybczynski2010).
Fake history is omnipresent throughout The Villages’ downtowns. The Villages’ developer “hired a design firm [Forrec] with experience working for Universal Studios to invent this make-believe town, including its history, customs, and traditions” (Blechman Reference Blechman2008). Newly constructed buildings sport fake “Established 1792” signs. There are phony disused railroad tracks with an old caboose in the Lake Sumter Landing town center, and faded (but not too faded) “ghost advertisements” for old movies or for the saddle sellers of yore who purportedly occupied a building now occupied by a different commercial tenant. Plaques in front of numerous downtown buildings weave complex tales of adventure, successes, setbacks, and betrayals, introducing numerous fictitious town founders and other characters. There are 56 fake history plaques scattered through the three downtowns, with 16 in Brownwood, 8 in Spanish Springs, and 32 in Lake Sumter Landing.2 The widely read local newspaper has featured quizzes that test residents about the community’s fake history (The Villages Daily Sun 2016).
Perhaps the developers’ most self-referential bit of fake history is a recently installed text at “Paddock Square,” the social hub of the newest downtown in Brownwood, where music is performed nightly. An impressive bronze plaque tells the story of the place:
The central plaza of Brownwood is now known as Paddock Square. Once slated for demolition, its historic value was championed by a group of visionary citizens in the 1950s. Today it contains remnants of the earliest roots of the town from its days as a cow camp used by legendary Cracker K. O. Atlas. The original Atlas dog-trot cabin has been relocated here, within the perimeter of what was once the original corral of the Atlas Ranch. Numerous buildings from the earliest days of the settlement, including K. O. Atlas’s barn and bunkhouse, still surround Paddock Square.
The grandstands were built in the 1880s to accommodate crowds who came to Paddock Square to attend rodeos staged by William G. Brown after he purchased the Atlas Ranch in 1879. Subsequent city leaders found these raucous gatherings too disruptive to downtown business and later moved the popular events downwind of the town center. The grandstands were left intact and used as seating for civic and theatrical events well into the next century.
Brownwood and Paddock Square opened to the public in 2012 (Gonzalez Reference Gonzalez2013). The land on which Paddock Square was built was most likely a watermelon farm in the 1880s and the 1950s (Blechman Reference Blechman2008). Another noteworthy plaque refers to an Ebenezer Matthews, whose “dislike of young people was a well-known fact in the community” and who became the target of various practical jokes by local high school students as a consequence. Although Matthews is in that sense the patron saint of a community with no resident children, the historical origins of The Villages’ prohibition of child residents is explained on none of the downtowns’ 56 plaques.
Notwithstanding the developers’ efforts to erase and replace it, the “real” history of the land The Villages now occupies is interesting. As Amanda Brian points out, there was indeed a cattle industry in nineteenth-century Florida (Reference Brian2014). At the conclusion of the Seminole Wars, native tribes were forcibly removed from their ancestral lands to make way for white cattlemen. The bloody Seminole Wars raged on for decades, and these wars would have provided an interesting backdrop for an alternative fake history of the Villages. Yet the Seminoles and other indigenous Floridians go completely unmentioned in all of the 56 fake history plaques that grace Spanish Springs, Lake Sumter Landing, and Brownwood.3 Indeed, among all of these plaques, two plaques reference possibly Latino residents4 – both of these involve the same nuclear family (the Sanchez family) – and no plaques feature apparent references to any other individuals who weren’t of European ancestry.5 The fictitious story told in The Villages is therefore an overwhelmingly European American narrative, and it would not be surprising if stories about The Villages’ past function as “exclusionary vibes” that influence the residential composition of The Villages’ present (Strahilevitz Reference Strahilevitz2011). Under this strategy, The Villages’ architecture, fake history, marketing choices, and initial population uses language and imagery to establish a focal point that attracts white homeowners and repels nonwhite homebuyers. It quickly becomes known as a place where homeowners seeking racial homogeneity can find one another. Traces of African Americans’ historic presence in The Villages have been wiped out too. Included within The Villages is an African American Baptist cemetery that predates the community’s status as an age-restricted community. Strategically placed hedges and bamboo plantings render it invisible from the neighboring homes (Brian Reference Brian2014).
There are plausibly larger factors at play too. Older Americans are whiter than younger Americans, and among seniors whites are more likely to be able to afford homes in retirement communities that are beyond the reach of seniors without substantial savings. Beyond that, dozens of golf clubs are part of The Villages, and all homeowners pay for access to most of these clubs via their monthly assessments. (Residents wishing to play on a handful of “championship” courses have to pay an additional membership fee.) Given that for much of The Villages’ residents’ lives golf was the most racially segregated mass participation sport in the United States, one would expect that The Villages would be particularly appealing to Caucasians and particularly unappealing to African American and Latino retirees. Prospective Caucasian homeowners would be more likely to purchase homes in The Villages than African Americans, and even Caucasian buyers who play no golf might be willing to play a premium to live among the overwhelmingly white residents who are attracted to mandatory membership golf communities. “Exclusionary amenities,” like exclusionary vibes, thus seem pervasive in The Villages, and they may well trigger the same segregation-promoting dynamics. An exclusionary amenity is a costly club good that is embedded in a residential community where all residents must pay for it. Willingness to pay for that amenity becomes a proxy for race or other demographic factors (Strahilevitz Reference Strahilevitz2011). It is plausible that The Villages’ exclusionary vibes and exclusionary amenities reinforce each other, though identifying the causal relationships and magnitudes is a tall order.
That said, something else important seems pervasive in The Villages too: happiness. In a health survey sent by academic researchers to all identified residents of the community, one that generated a very high 37.4 percent response rate, residents of The Villages expressed extraordinary satisfaction with their lives in the community. Fully 90.8 percent of The Villages’ residents surveyed rated their satisfaction with life in The Villages as an 8, 9, or 10 on a 10-point scale (Fishleder et al. Reference Fishleder, Schonfeld, Corvin, Tyler and VandeWeerd2016). Although any comparison to a baseline will raise problems about representative income levels, senior citizens nationally are much less likely to report such high levels of satisfaction (Strine et al. Reference Strine, Chapman, Balluz, Moriarty and Mokdad2008).
While residents’ high satisfaction in a racially homogenous community is in many respects unfortunate, racial segregation among seniors is probably less harmful to society than racial segregation among younger Americans.6 Residents of The Villages lack school-aged children, so segregation there isn’t contributing to school segregation. And residents are mostly involved in economic life only as consumers, so the segregated nature of their local social networks probably does not prevent people of color from enjoying access to employment-related economic opportunities. The racial segregation of Americans in their twenties, thirties, forties, and fifties is more pernicious.
To be sure, The Villages’ fake history itself is unlikely to play a large role in explaining why its residents express such high levels of satisfaction with their surroundings. At least in the short term, the racial homogeneity of The Villages could be itself an alternative explanation for aspects of the community like its high levels of generalized trust and social cohesion (Putnam Reference Putnam2007). Yet the available data are hard to square with the proposition that presenting community residents with a contrived and phony version of the history of a place significantly undermines residents’ subjective well-being. And data from other researchers suggest that some survey respondents prefer fake historical architecture to modernist contemporary architecture, though there are legitimate questions about the external validity of this data (Levi Reference Levi2005).
Given this satisfaction, it is worth asking why The Villages’ model has not been replicated more widely. Indeed, perhaps it is only a matter of time until residential life modeled on theme park visits becomes the norm. Given the success and consumer appeal of The Villages, it is easy to imagine real estate developers embracing fictitious, built-environment narratives in a manner that is more expensive (because of licensing fees) but has ready-made cultural resonance. Millennial retirees might want to live in a retirement community that looks precisely like Hogsmeade or King’s Landing. In such a community, the residents are likely to know the built environment’s “historical” narrative well, to care about it, and to view it as central to the community’s identity. Can Lancaster, Pennsylvania’s, or Akron, Ohio’s residents say the same thing?
The discussion so far has taken Villagers’ preferences for granted, but it is worth noting, at least in passing, that audiences where this chapter has been presented inevitably want to understand or critique their embrace of fake history. These audiences regard what is happening in The Villages as creepy, though the basis for their intuitions vary widely. Perhaps the concern is that fiction has so thoroughly and self-consciously displaced fact – maybe residents embrace this concocted history to assuage subconscious guilt about their having left communities in which they were rooted as adults. Alternatively, maybe what’s jarring is that the community seems to be one where “play” has become a full-time pursuit for the residents, crowding out other important values associated with ordinary life (Hurka and Tasioulas Reference Hurka and Tasioulas2007). It could be instead that by trying to create a planned version of a community that grew and changed organically the community is subtly but powerfully missing important aspects that make it human (Jacobs Reference Jacobs1961). Or maybe the clear racial and evident political homogeneity in The Villages produces a kind of echo chamber among residents that may adversely affect political discourse among a population who vote in very large numbers. Finally, the strategies used in The Villages resemble those employed by authoritarian regimes, which sometimes go to great lengths to present their citizens with a narrative about the built environment’s past that serves the contemporary aims of the leadership class (Johnson Reference Johnson2016).
On the other hand, to Villages residents, the ability to play in a community that caters to their needs, that is designed specifically for people like them (with golf cart paths, ample public restrooms downtown, easily readable signs, and restaurants that open early for dinner), that doesn’t regard their aging as embarrassing, and that provides them the opportunity to focus on consumption after a lifetime of working, parenting, and saving seems appealing. Residents might pointedly ask what gives us the right to judge them and the way they have chosen to retire. They have paid their dues, and perhaps when we reach their life stage, we will want something similar.
All of this discussion raises some hard questions that will be pursued in the remainder of this chapter. First, is there inevitably such a thing as “genuine history” that we can contrast with The Villages’ contrived history? And relatedly, do we have reason to believe that fake history is more likely to promote the troubling forms of segregation that have arisen in The Villages? Finally, and subversively, what if Villages-style fake history is a perfectly adequate (but much more affordable) substitute for “genuine” history? That is, if satisfying some abstract preference for authenticity entails limiting how current owners can use and modify their property by requiring owners to comply ex ante with a zoning or covenants scheme that requires conformity with a broadly applicable theme, are the limits justifiable? Preserving old buildings can be a very costly endeavor, particularly when hazardous substances like lead paint or asbestos were used in its initial construction. In some extreme cases, governments force building owners to maintain structures that are not economically viable (J. C. & Associates 2001). Is the game worth the candle?
5.2 Is All History Fake History?
There is a school of thought that questions whether the presentation of a community’s genuine history is a realistic possibility in human society. David Lowenthal is most famous for the claim that “the past is a foreign country.” In Lowenthal’s view, so many of the objects contemporary society preserves represent a distorted picture of life in the past. Worse, the story is often distorted in the present precisely so that the narrative can be placed in the service of contemporary needs and wants (Reference Lowenthal1999). Ada Louise Huxtable called historic preservation a “semantic trap,” something different only in degree from fantastical communities like Disneyland or Seaside, Florida (Reference Huxtable1997). Ethnographic studies of revitalization efforts, such as Jeremy Wells’ assessment of historic preservation efforts on Anderson, South Carolina’s Main Street, identify a common theme of local stakeholders embracing efforts to create a kind of “spontaneous fantasy,” with the local architecture reflecting an aspirational account of what life on the main thoroughfare should have been like during the town’s earlier days (Reference Wells2010).
As we survey the way that historical sites and buildings are preserved, the arbitrariness of what successor generations decide to emphasize, ignore, embellish, and conceal stands in sharp relief (Lowenthal Reference Lowenthal1998a). Nineteenth-century Americans bemoaned the fact that the precise spot where the Pilgrims disembarked in 1620 was lost to time, so they found a rock that looked like it could have been “Plymouth Rock” and moved it to the harbor under a classical canopy commemorating its importance (Lowenthal Reference Lowenthal1998a). Tourists wishing to see the Alamo between 1960 and 2010 might have stopped at the original in downtown San Antonio, Texas, or they may have preferred the reproduction, built in Brackettville, Texas, as the set for a John Wayne movie about the Alamo and maintained as a tourist site for the next five decades (Huxtable Reference Huxtable1997). Sam Houston’s Greek revival home in Texas has been transformed by subsequent generations into a “rough-hewn log cabin which Houston himself would have disdained,” but which tourists deem more consistent with their mind’s-eye vision of Houston’s home (Lowenthal Reference Lowenthal1998a). Hannibal, Missouri, has state historical markers commemorating not only spots where the real Mark Twain lived, but also locations where the fake characters from his books supposedly had their adventures (Daly Reference Daly2010). Similar “landmarks” exist in Romeo and Juliet’s Verona (Telegraph 2012). Tour guides in the Old City of Jerusalem take nuns on a Via Dolorosa that isn’t Christ’s path on the way to the crucifixion, but is rather a “more interesting” (and maybe more appealing?) path to follow (Lowenthal Reference Lowenthal1998a). Colonial Williamsburg for decades had no references whatsoever to slavery, and its outhouses used to be freshly painted in bright colors – historically inaccurate, for sure, but far easier on the eyes (Barthel Reference Barthel1990; Handler and Gable Reference Handler and Gable1997).
Amidst these unreliable narratives, shifting standards of what ought to be preserved prevail. Most of the older European societies whose edifices current generations are now spending enormous resources to preserve cared little for ancient structures, and some of them wouldn’t have given much thought to the idea that the past and present were meaningfully different. In the 1500s, St. Peter’s Basilica was razed and then rebuilt, a development that was (as best we can tell) uncontroversial, even for a building of such historic importance (Lowenthal Reference Lowenthal1998b). And with so many readers having walked through the current version, do we have grounds to complain?
The question of which golden era to commemorate is one that arises across cultures. Americans’ nostalgic sense of New England’s small towns is more an artifact of the nineteenth century than the seventeenth. After the Civil War, a pure, agrarian, and communitarian New England helped show that the prevailing side in the conflict was always destined to emerge victorious. And later in the nineteenth century, as immigration threatened colonial revivalists’ understanding of the American identity, the “fictions of New England resisted fact in order to stabilize the socially uncertain present” (Wortham-Galvin Reference Wortham-Galvin2010). The fact that the landscape of nineteenth-century New England did not match the vision that revivalists wanted to encounter meant that New England’s landscape needed to be remade. And similar questions about which “golden era” should be preserved play out in historic preservation debates in Europe. As Lowenthal explains:
Consider Rouen Cathedral, whose sixteenth-century timber spire gave way in 1822 to a cast-iron replacement unable to bear its own weight. A new spire is now needed. Should it honour the original or the historical continuity embodied in the fraud of a nonweightbearing load?
There is no correct answer to the question. The controversy is political rather than historical. And in most preservation disputes similar issues arise.
Lowenthal does not embrace the postmodernist claim that fake history and genuine history are indistinguishable; neither should we. The Gettysburg Memorial commemorates a spot where thousands of Americans really did die, and those deaths mattered then and now. History we learn in democratic societies typically contains heavier doses of fact than fiction. The typical problem is not that historical narratives are concocted; rather it’s that when the preservation domain is scarce land, facts are preserved selectively and the value choices underlying that selection are often obscured.
Yet it is becoming increasingly apparent that, as arguably our greatest living architect has put it, “preservation is overtaking us” (Koolhaas Reference Koolhaas2004).7 We are preserving so much, and so much of what we preserve is banal, that we cannot afford to maintain and inventory everything. For cities like Venice or Bruges or Deadwood, the opportunity cost of preservation is plausibly worth bearing. These locations are centers of tourism whose glory days are a distant memory, and tourist traffic aside, they are on the periphery of economic life. But with 27 percent of the buildings in Manhattan already landmarked and with the borough on pace to landmark the majority of its buildings by 2066 (Ellen and McCabe, Chapter 4, this volume), there is a danger that preservationist instincts fed by loss aversion impulses crowd out the dynamism that created the wealth that funded the buildings with which society now seems unwilling to part (Strahilevitz Reference Strahilevitz2005). To ameliorate these problems, a society might bind itself to protect no more than a fixed percentage of structures in the city, whereby in the absence of new construction, the landmarking of a new property would require the removal of another property from the landmarks registry (Glaeser Reference Glaeser2011).
With respect to the built environment, political factors as well as historical and architectural importance influence what gets preserved and what doesn’t (Noonan and Krupka Reference Noonan and Krupka2010). As a result, there is inevitably selectivity in local government decisions about which structures should be subject to compulsory preservation. When buildings are protected because of who lived there rather than anything having to do with the structure itself, then political choices and social values inevitably drive decision making. Add in the mix of economic factors concerning what structures are preserved or torn down by their owners, and the foreignness of the past is thrown into even sharper relief. On this view, historic preservation (like decisions about the construction of monuments, questions of who to honor on stamps and currency and airports and freeways, and controversies over the contents of state-mandated history textbooks) becomes a battlefield for purely symbolic politics that are zero-sum because of the scarcity of commemorative opportunities.
In light of these problems, perhaps it would be much better to preserve buildings at random, to serve authenticity and fairness interests, and to leave space for future creativity. That would be a strategy for implementing Rem Koolhaas’s thought experiment in Beijing, where he contemplated preserving “everything in a very democratic, dispassionate way – highways, … monuments, bad things, good things, ugly things, mediocre things – and therefore really maintain[ing] an authentic condition” (Reference Koolhaas2004). If public choices about what is worth preserving are usually flawed, then removing the element of choice may be one way to proceed. The city might decide to require the preservation of a fixed number of blocks that were constructed by a particular generation, but leave the designation of those blocks to chance.
This point can be amplified once we realize that the same sorts of intentional narrative omissions on display in The Villages – the hedges planted around the African American cemetery, the near absence of nonwhite names from the community’s fictitious list of founders and settlers, the erasure of the area’s Native American past – are equally present in communities celebrating their more genuine histories. Stephen Clowney’s fascinating study of Lexington, Kentucky, shows the city and powerful private actors doing much the same kind of editing, with the result being a built environment that glorifies the actions of historical white figures and conceals the role of African Americans who loomed large in local history (Reference Clowney2013). As Clowney points out, privately funded monuments to the Confederacy adorn the city’s central gathering place, repelling contemporary African Americans. Thoroughbred Park, a new municipal park proposed in 1989 to commemorate Lexington’s horse-racing history, occupied space between an affluent white part of the city and a less affluent black neighborhood. As Clowney tells it, both neighborhoods would be visible from the park and have easy access to the park unless something was done.
Local business interests argued, sometimes forcefully, that the view was not conducive to Lexington’s redevelopment efforts and, as a result, the large rolling hillside of Thoroughbred Park was built. The mound was “literally built for the park to effectively hide the African American residential district from view.” For anyone approaching downtown from the interstate highway, Lexington’s black neighborhood – and black bodies – remain firmly out of sight, tucked neatly behind the grassy partition. An editorial in the local paper succinctly captured the dynamic; “Though aesthetically pleasing, the park is historically false. … The park not only ignores the black neighborhood, but also screens it from view. It is a whitewash. It is telling that almost every African American … instantly recognizes this racial effect.”
Though Clowney’s case study focuses on Lexington, he marshals evidence that similar strategies are employed “throughout the South” to provide current residents and visitors with “deliberately misleading interpretations of history [that] conspire to ingrain ideas about racial hierarchy, cement conclusions about racial difference, and send messages that African Americans are not full members of the polity” (Reference Clowney2013).
The selectivity of historic preservation and commemoration operates in more trivial ways as well. Consider the conveniently selective focus of preservationists. Communities of old smelled awful (Howes and Lalonde Reference Howes and Lalonde1991). Mud and grit and horse manure and unpleasant body odors were omnipresent. Yet, to the best of my knowledge, there is no constituency for olfactory authenticity in preserved cities. Preservationists want to wander among old buildings and see what previous generations saw. But they do not want to smell what previous generations smelled, nor to feel what previous generations felt. Historic structures should be air conditioned, after all. Nor do contemporary preservationists wish to experience the elevators of old, which were death traps (Bernard Reference Bernard2014). The version of historic preservation that public tastes demand is a highly sanitized fantasy about the past. “Most of the remote past is wholly gone or unrecognizably transformed” (Lowenthal Reference Lowenthal1999).
None of this analysis indicates that the preservation decisions that emerge from this process are inevitably going to be bad ones. While there is much to criticize in Lexington’s approach, Clowney notes that Birmingham, Alabama, began to preserve its history in a more inclusive way after African Americans began to comprise the majority of voters there (Reference Clowney2013). Robert Weyeneth describes efforts throughout the South to include sites associated with racial segregation on the National Register of Historic Places so that future generations will understand better through the built environment what life under Jim Crow was like for blacks and whites (Weyeneth Reference Weyeneth2005). Political processes are not always biased or broken. But the dominant tendencies among preservationists are evident. And those tendencies help make the case for a radical approach built on randomization.
In assessing the social welfare effects of historic preservation, property values are a sensible place to begin, though by no means a completely satisfying analytical approach. Most of the benefits of historic preservation will be felt locally. Historic preservation typically will be a local amenity. That is, if people benefit from having historic structures and neighborhoods preserved, then they will pay more to live proximate to those structures (Malani Reference Malani2008). To be sure, tourists and workers who commute from elsewhere may benefit from historic preservation too, but to the extent that they do, we should expect to see a corresponding increase in the property values of hotel buildings or office towers. If real estate markets are functioning well and buyers and sellers are rational, then the long-term costs and benefits of historic preservation should be capitalized into property values. Markets leave out some considerations, such as existence value, and these externalities render real estate values an excellent though imperfect proxy for the social welfare effects of preservation. Property values also become a poor proxy when the market rewards real estate developers for catering to the preferences of white homeowners who prefer racially homogenous neighborhoods.
With those important caveats stated, what does the empirical literature tell us about the effects of historic preservation mandates on local property values? Digging into the reputable social science, there does not appear to be an absolute consensus in the economic literature as to the effects of historic preservation regulations. Case studies focused on medium-sized cities like Lincoln, Nebraska, Baton Rouge, Louisiana, and Johnson City, Tennessee, tend to find small, positive effects on property values (Chen Reference Chen2013; Thompson, Rosenbaum, and Schmitz Reference Thompson, Rosenbaum and Schmitz2011; Zahirovic-Herbert and Chatterjee Reference Zahirovic-Herbert and Chatterjee2012). That said, the most sophisticated work tends to be dubious of the purported economic benefits and concerned about the resulting demographic turnover, especially in densely populated areas. Coulson and Leichenko’s study of Fort Worth, Texas, found that historic preservation did not affect the residential composition of landmarked neighborhoods (Coulson and Leichenko Reference Coulson and Leichenko2004), but the same authors’ work on Abilene, Texas, found that historic preservation regulations did raise property values within the landmarked district (Coulson and Leichenko Reference Coulson and Leichenko2001). By contrast, McCabe and Ellen found significant neighborhood composition effects in New York City, where the creation of a historic district was associated with subsequent increases in the socioeconomic status of the district’s residents, compared to residents of otherwise comparable neighborhoods. Evidence that historic preservation decisions affect the racial composition of New York neighborhoods was weaker and not statistically significant (McCabe and Ellen Reference McCabe and Ellen2016).
Studies of major metropolitan areas are generally more pessimistic about the economic desirability of historic preservation laws. Heintzelman and Altieri’s study of historic preservation regulations in the Boston metropolitan area found associations between landmarking and reduced property values, though the magnitude of the effect is small with all controls, around 1 percent (Heintzelman and Altieri Reference Heintzelman and Altieri2013). An impressive study that employs repeat sales hedonic fixed effects analysis, the Heintzelman and Altieri paper does a better job of dealing with endogeneity than many of the other localized studies. Similarly, another study of historic preservation in Chicago employed a small but unusual dataset that included measures of structure quality (Noonan and Krupka Reference Noonan and Krupka2011). The authors find that landmark designation has no positive effect on property values after city property tax benefits phased out completely. Research that relies on natural experiments, such as the Nazis’ leveling parts of Rotterdam, which left historic preservation regulations in place only in the parts that hadn’t been destroyed, also tends to be pessimistic about the economic effects of historic preservation regulations (Koster, Van Ommeren, and Reitveld Reference Koster, van Ommeren and Reitveld2012).
The gold-standard paper on the effects of historic preservation uses the largest market, has the largest dataset involving the most land transactions over the longest period of time, and employs the most careful controls (Been et al. Reference Been, Ellen, Gedal, Glaeser and McCabe2016). The authors expected that the creation of a historic district would generate cross-cutting effects because such regulations can enhance beauty and open space in a neighborhood while limiting redevelopment rights. Consistent with this plausible hypothesis, Been and coauthors find that the effects of historic preservation regulations are negative to negligible in parts of New York where there is significant economic pressure to pursue higher densities (i.e., Manhattan). Outside of Manhattan, the effects on property values are positive – “they rise by about 1.4 percent per year relative to nearby properties.”
A survey of the literature on the economics of historic preservation suggests the following (tentative) conclusions, then. The effects of historic preservation on neighborhood composition appear mixed, although there is some credible evidence to suggest that these regulations are associated with gentrification of neighborhoods. In areas of significant land scarcity, such as urban centers, there is little credible evidence that historic preservation regulations systematically enhance property values. Most of the rigorous evidence in fact suggests that such regulations cause property values to decline. Historic preservation restrictions on land do seem to enhance property values in lower-density areas where there is little economic pressure to redevelop property and where such regulations can promote an aesthetically appealing form of homogeneity in the streetscape that might be difficult to achieve through purely voluntary coordination among property owners.
To be sure, property values do not capture all of the potential benefits and costs of historic preservation. Such preservation, when successful, can provide current generations with guidance about how past challenges were addressed, provide present generations with an escape from their current confines, or establish continuity with the past. On the other hand, preserving the past may stifle present generations’ creativity by failing to free up scarce space for future landmarks. The past can become an orthodoxy from which one deviates only at her peril.
5.3 The Law
In American law, it is rather clear that cities and states have a legitimate interest in promoting the preservation of historic structures, even at the expense of property values. Paradoxically, the Supreme Court case in which the right to force the continuation of existing uses is most clearly established is Berman v. Parker, where the proposal at issue was a slum-clearance plan designed to wipe out existing uses so that a neighborhood in Washington, DC, could start afresh. As of 1950, the area slated for redevelopment in Washington was characterized in the following terms by the Court:
In 1950 the Planning Commission prepared and published a comprehensive plan for the District. Surveys revealed that in Area B, 64.3% of the dwellings were beyond repair, 18.4% needed major repairs, only 17.3% were satisfactory; 57.8% of the dwellings had outside toilets, 60.3% had no baths, 29.3% lacked electricity, 82.2% had no wash basins or laundry tubs, 83.8% lacked central heating. In the judgment of the District’s Director of Health it was necessary to redevelop Area B in the interests of public health. The population of Area B amounted to 5,012 persons, of whom 97.5% were Negroes.
To contemporary readers, the introduction of the demographic information is unnerving. It is as though the most emphatic proof of the existing built environment’s low value is the type of people who live there. In any event, in the view of the Planning Commission, Area B was characterized by an obsolete layout and a bundle of structures that was injurious to public health. In the Supreme Court’s view, Congress and the District had the authority to condemn both blighted and non-blighted properties within Area B.
The fact that Berman’s Department Store was, as the government conceded, not remotely blighted was irrelevant. As Justice Douglas wrote on behalf of a unanimous Court:
Miserable and disreputable housing conditions may do more than spread disease and crime and immorality. They may also suffocate the spirit by reducing the people who live there to the status of cattle. They may indeed make living an almost insufferable burden. They may also be an ugly sore, a blight on the community which robs it of charm, which makes it a place from which men turn. The misery of housing may despoil a community as an open sewer may ruin a river.
We do not sit to determine whether a particular housing project is or is not desirable. The concept of the public welfare is broad and inclusive. The values it represents are spiritual as well as physical, aesthetic as well as monetary. It is within the power of the legislature to determine that the community should be beautiful as well as healthy, spacious as well as clean, well-balanced as well as carefully patrolled. … If those who govern the District of Columbia decide that the Nation’s Capital should be beautiful as well as sanitary, there is nothing in the Fifth Amendment that stands in the way.
In this key passage, the Court articulates a broad justification for the police power. City beautification is a legitimate state interest, one that justifies overcoming the objections of an owner of a fine building who seeks to resist its condemnation by virtue of proximity to less sturdy neighboring structures. And with respect to Berman’s arguments against being the victim of a collective punishment, the Court concluded that tearing down only problematic structures would do too little to prevent the neighborhood from becoming a slum again in the future, thanks to the dearth of parks, the absence of sunlight, and other deficiencies. Only a new neighborhood layout could break the “cycle of decay.” In short, Berman’s section of Washington, DC, to Douglas, called out for government to play the role of the Luftwaffe in Rotterdam, enabling the neighborhood to start from scratch.
Twenty-four years later, the question of the state’s interest in promoting aesthetics in a community was taken for granted, though the emphasis was now on resisting modernization. The Penn Central Transportation Company, which owned Grand Central Station in New York, sued the City of New York over the application of the city’s landmark preservation law to Grand Central (Penn Central 1978). Under that law, New York had blocked Penn Central from constructing atop Grand Central a skyscraper that would have enhanced the economic value of the parcel. Although Penn Central conceded that the landmarks preservation law fell within the city’s police power, and therefore was legitimate, it argued that the Constitution compelled the city to compensate Penn Central for the diminutions in its property value resulting from the landmarks law. The legitimacy of the law’s purpose was not in dispute, but the second and third paragraphs of the Court’s opinion delve into the justification for historic preservation in detail.
Over the past 50 years, all 50 States and over 500 municipalities have enacted laws to encourage or require the preservation of buildings and areas with historic or aesthetic importance. …
New York City … adopted its Landmarks Preservation Law in 1965. … The city acted from the conviction that “the standing of [New York City] as a world-wide tourist center and world capital of business, culture and government” would be threatened if legislation were not enacted to protect historic landmarks and neighborhoods from precipitate decisions to destroy or fundamentally alter their character. The city believed that comprehensive measures to safeguard desirable features of the existing urban fabric would benefit its citizens in a variety of ways, e.g., fostering “civic pride in the beauty and noble accomplishments of the past”; protecting and enhancing “the city’s attractions to tourists and visitors”; “support[ing] and stimul[ating] business and industry”; “strengthen[ing] the economy of the city”; and promoting “the use of historic districts, landmarks, interior landmarks and scenic landmarks for the education, pleasure and welfare of the people of the city.”
Notice that within the span of a quarter century, the emphasis of city planners had changed from replacing the obsolete to preserving the irreplaceable. To be sure, most visitors to Grand Central regard the structure as one possessing very significant architectural merit. Contemporary Washingtonian policy makers in the 1950s did not feel any commensurate fondness for the neighborhood that was slated for destruction in Berman v. Parker, a discrepancy likely tied to both the quality of the structures and the perceived qualities of the people who used those structures.
The plaintiff in Penn Central did make one broad argument against the enterprise of historic preservation. It argued that the imposition of historic preservation requirements on it but not on other landowners was arbitrary, but the Court quickly brushed aside this argument:
Equally without merit is the related argument that the decision to designate a structure as a landmark “is inevitably arbitrary or at least subjective, because it is basically a matter of taste,” Reply Brief for Appellants 22, thus unavoidably singling out individual landowners for disparate and unfair treatment. The argument has a particularly hollow ring in this case. For appellants … do not even now suggest that the Commission’s decisions concerning the Terminal were in any sense arbitrary or unprincipled. … [Q]uite simply, there is no basis whatsoever for a conclusion that courts will have any greater difficulty identifying arbitrary or discriminatory action in the context of landmark regulation than in the context of classic zoning or indeed in any other context.
Upon reflection, the Court’s response to Penn Central’s argument is something of a non sequitur. The company was positing that landmark designations are inherently arbitrary. The Court said by way of reply that Penn Central did not argue that the decision to designate the station as a landmark was itself arbitrary. The response seems self-contradictory. The broader argument of inevitable arbitrariness logically entails the specific argument applied to Penn Central’s land. In the decades that followed, lower courts followed Penn Central’s lead in brushing aside questions about the discriminatory enforcement of historic preservation laws (e.g., Mount St. Scholastica 2007; Van Horn 2001). A more thoughtful (and candid) response would have suggested that landmark designation decisions are merely somewhat arbitrary – factors like neighborhood clout and voter preferences play a significant role, but so does perceived architectural merit. Or maybe the real problem is that landmark designations aren’t sufficiently arbitrary.
Putting Berman and Penn Central side by side displays some of the tension that arises in historic preservation cases, though it does not show that the doctrines are contradictory. A competent government can beautify its cityscape by compelling the preservation of pleasing structures and by compelling the removal and replacement of displeasing structures. In that sense, Berman and Penn Central fit together coherently. But the tension arises once we begin to see the subjectivity of contemporary societal judgments about what is worth preserving and what is worth destroying. This was the argument of Penn Central’s that the Court was too quick to dismiss.
To preservationists, soaring and expensive structures that are used and beloved by elites ought to be preserved, even if they become economically obsolete in their present form. But modest structures in overwhelmingly minority neighborhoods ought to be bulldozed in the name of progress. Combining the power to compel preservation with the power to compel destruction makes the government a mighty editor of the past. Systematically, when society sweeps away the latter kind of building and forces the preservation of the former, it curates the built environment in a manner that deceives future generations about what life was like in an earlier era. Compare the 27 percent of Manhattan that is landmarked to the 0.3 percent of Staten Island that is landmarked. (Ellen and McCabe, Chapter 4, this volume). What if future generations – perish the thought – decide that the lives of contemporary Staten Islanders were as worthy of commemoration as the lives of Manhattanites? From this perspective, the history that gets presented to the living becomes a history nearly as fake as what’s on display in The Villages (Lowenthal Reference Lowenthal1999). When society tries to preserve and protect aesthetic greatness, it simultaneously designates winners and losers, and those political dynamics will distort the clarity of aesthetic decision making. (Recall Justice Douglas’s connection between the quality of a neighborhood’s buildings and the perceived quality of its residents.)
Equally troubling is the possibility that these curated choices about what history to preserve subtly signal current generations with information about who is welcome and who is not. In recent years, legal scholars have begun studying the important question of how regulations of the built environment, decisions about infrastructure placement in particular, can contribute to residential segregation (Schindler Reference Schindler2015). Historic preservation can and evidently does send exclusionary vibes too. But we lack an adequate understanding of the mechanisms by which it operates and the degree to which factors grounded in psychology, as opposed to pocketbook economics, explain household location choices.
As a doctrinal matter, it would appear that the evidence canvassed in Part 2 of this chapter is sufficiently mixed to authorize the continued compulsory regulation of historic structures. The best evidence suggests that historic preservation regulations do more economic harm than good in densely packed parts of the country, but they appear to be beneficial in some places, and the possibility that they may be beneficial in a given neighborhood is adequate under the law’s very deferential existing standard. Moreover, a city like New York might conclude that notwithstanding the net economic harms associated with some preservation, these costs are worth bearing for the sake of continuity values that are difficult to price. There may even be good Burkean reasons for preserving things that have stood the test of time – their durability might bear witness to their value in ways that present generations do not fully recognize. At the same time, there is essentially no empirical assessment of the kind of alternative to historic preservation that The Villages represents. Historic preservation may look worse (or, depending on one’s values, better) when it is compared to fake history than when it is compared to a city unmoored from both fictitious and less-fictitious pasts. And if we can imagine an inclusive version of fake history – a narrative that embraces pluralism and difference – the integration-promoting possibilities of fake history become apparent.
That said, the relationship between historic preservation regulations, fake history, and residential homogeneity sketched earlier suggests that a less deferential assessment of these strategies may be appropriate. Both historic preservation and the kind of uniformly scripted narrative on display in The Villages aim for an aesthetic homogeneity that may engender demographic homogeneity by design. When the buildings all look alike, the people living in those buildings tend to look alike too. Some of the premises taken for granted by the courts since Penn Central may fail to withstand a more searching form of judicial scrutiny.
5.4 Conclusion
The Villages’ developers have gone to great lengths to develop a phony historical narrative for their fast-growing community, one that is embraced not only in retro-architecture, but with a detailed and fictitious account of the built environment’s past. In so doing, they have swept away any mention of the actual history of the land and replaced it with a stylized narrative designed to appeal to today’s elderly homebuyers. There is something disconcerting about the inauthenticity of The Villages.
Yet, upon reflection, it is possible that the faux history of The Villages is not all that different from the version of history presented to the public as a result of historic preservation regulations in major American cities. There too, aspects of the built environment’s history are systematically ignored. Structures inhabited by the poor and by minorities tend to be replaced as soon as market forces dictate changes. Structures inhabited by elites tend to be preserved regardless of what the market demands. The result is a lasting signal about whose history is valued, whose lives mattered, and what historical events constitute successes and failures. The version of our past that Americans encounter via historic preservation regulations is at once sanitized, political, and designed to appeal to contemporary preferences. To the extent that society wants to preserve artifacts from past built environments, preserving structures at random has real advantages over our present approach.
Scholars of land use have paid too little attention to the relationship between the design of the built environment and the characteristics of the people who show up to populate it. The extraordinary and depressing racial homogeneity of The Villages, despite its very recent origins and presence in a very racially diverse part of the United States, suggests that the combination of exclusionary vibes and exclusionary amenities in age-restricted communities can be potent even in an era of Fair Housing Act enforcement. Seeing what has happened in The Villages might reveal a fast-forward version of what has happened more slowly and with less extreme results elsewhere, where an existing population dampens the salience of the signals sent by the built environment. Though we cannot isolate the effects of any particular homogeneity-promoting strategy in The Villages, the cumulative effect of multiple strategies is striking and disturbing. It would not be crazy for legal institutions to consider whether some of the techniques that might promote racial homogeneity in The Villages ought to be prohibited or at least curtailed. Indeed, it is tempting to contemplate the inclusionary possibilities of a varied approach to fake history. Imagine Lin-Manuel Miranda as a real estate developer.
Finally, the extent to which residents of The Villages have embraced the community’s false history is a topic worthy of further qualitative research. The version of history presented to the world through preservation laws is never authentic. A fairer metric is to ask whether the history on display resonates within the community. If American homeowners turn out to like entirely phony history nearly as well as selectively curated history, then a hard question arises as to whether it is appropriate to impose significant financial burdens on a subset of property owners in the name of telling the story of a community in a particular, misleading way. Fake history may be inferior to real but selective history, but it is also a great deal cheaper, and the narrative can be constructed entirely by market forces. In revisiting the question of whether a legitimate societal interest remains in compulsory historic preservation, it is helpful to ask ourselves: “compared to what?” To answer that question, an examination of The Villages social experiment may prove illuminating.
Author’s Note
The author thanks Lee Anne Fennell, Aziz Huq, Daniel Kelly, Ben Keys, Alison LaCroix, Richard McAdams, Martha Nussbaum, Eduardo M. Peñalver, Michael Pollack, Eric Posner, John Rappaport, Julie Roin, John Tasioulas, and Laura Weinrib for comments on earlier drafts, and workshop participants at the University of Chicago Law School and the Harvard Graduate School of Design, especially Sarah Schindler, Susan Nigra Snyder, and George Thomas, for helpful conversations, Taylor Coles for skilled research assistance, and the Russell J. Parsons and Carl S. Lloyd Faculty Funds for research support.
Limestone. Granite. Stained glass. Ornamental gold. Richly polished wood. All are found in the beautiful historic churches in America’s cities. But the church is more than liturgical space. The church welcomes immigrants (often with services in their native tongues), engages in outreach by feeding the poor, and serves as a political mobilizing workspace. In short, it becomes one with the community. However, as church membership and attendance slide downward (coupled with demographic shifts of parishioners moving out of the neighborhood), these once graceful structures are increasingly underutilized, under-maintained, and potentially abandoned.
First African Baptist Church in Philadelphia serves as a powerful example of this trend. Founded in 1809 (the building was erected in 1906), it was once the home of the country’s oldest African American congregation. Years of deferred maintenance (estimated at $5 million) and a shrinking congregation (from 1,000 to 100) led to its closing. The building was sold for $1 million to a developer on Christmas Eve 2015. The neighborhood, South Philadelphia, has been called a “white hot real estate market.” The area has become a part of the city’s millennial renaissance, with luxury apartments and high-end condos with garages and decks that offer views of the city skyline (Simmons 2016). An ad for another church around the corner from First African that has been acquired by developers reads: “Development opportunity in hot neighborhood bustling with new construction and vibrant community.” A proposed new use for the former First African Baptist Church is residential condominiums.
This spate of redevelopment rides the coattails of a new population surge in the central neighborhoods of America’s cities. People are moving back into the central city and bringing a demand for housing with them. A phenomena sweeping through cities is the conversion of churches to residential use (either condominiums or rentals). For the city, this constitutes a victory on several fronts. Abandoned (and previously tax-exempt) property is put to use. New residents spark new business development. Tax revenues are enhanced. For the neighborhood, though, the sale of a church represents not just a demise of worship space, it is also the loss of a communal anchor. Death of the church severs the thread that ran through the neighborhood – the thread of community.
This chapter examines the trend of church conversions into residential use from several perspectives. It will begin with a review of the historical foundations of the role of churches in neighborhood life in the United States. Although the religious significance served as a magnet, the nonreligious activities act as glue. A key fact, though, is that the churches are, generally, right in the middle of residential areas. From a zoning perspective, this has engendered legal challenges as the churches increasingly engaged in nonreligious activity. The auxiliary uses that make a church more than a religious structure also challenge the zoning exemptions that permit churches to exist in residential neighborhoods.
In order to capture the magnitude of this potential conversion market, the demographics of church attendance and church real estate will be reviewed. The northeastern and north-central United States figure prominently in this discussion because this area has not only decreasing church attendance, but concomitantly has a high concentration of older gothic church structures that are architecturally stunning but expensive to maintain. I concentrate on mainline Protestant (Episcopal, Lutheran, Methodist, and Presbyterian) and Catholic churches because these are the denominations where one is most likely to find concentrations of large church buildings that are attractive for redevelopment.
All of this is happening against the backdrop of a central city renewal. Between 2010 and 2013, city growth outpaced suburban growth (Frey Reference Frey2014). People, especially the millennials, are flocking to the city for the ease of walkability and social interaction (Leinberger and Doherty 2011). Church conversions are most often architecturally stunning and therefore quite appealing to a younger/more affluent buyer. In many instances, church conversions are taking place in transitional neighborhoods, which leads to consideration of gentrification and changes in community identity.
These streams of inquiry will be brought together to examine what happens when a church is converted into another use. Although there are instances of reusing a shuttered church as a school or community center, when a neighborhood church is converted to luxury apartments and/or condominiums, the clash of gentrification rings loudly. Because many of the churches have significance far beyond the bricks and mortar, community voices are raised in opposition. Unlike the “fake history” recounted by Lior Strahilevitz (Chapter 5, this volume), the history of the church in these neighborhoods is quite real. The interplay of historical significance (if not outright historical preservation), community spirit, and local governments’ desire for growth combine in a unique fashion.
Role of the Church in Neighborhood Life
Religious services constitute only a fraction of a church’s impact in the neighborhood. A church often serves as a social service and community anchor. Churches can be institutional agents that impact the communal trajectory of the neighborhood (McRoberts Reference McRoberts2003, 123). One scholar noted that the breadth of community impact spans the gamut from health care to political power to physical nourishment (Day Reference Day2014, 61).1
As waves of foreign immigrants swept into U.S. cities, the church created (or, in many cases, recreated) a common language, heritage, and social structure for the migrants. African American migrants moving from the South into Northern cities experienced the same assimilation pattern into neighborhood churches (McRoberts Reference McRoberts2003, 105). Religious beliefs and the physical structures that house that belief serve as “ballast for immigrants as they struggle to adapt to their new homeland” (Hirschman Reference Hirschman2004, 1211). In a city that is a sea of “other,” the immigrant church serves as not only a spiritual refuge, but also a social one. One scholar has noted that in many immigrant churches, although there may be a common ethnicity, language, and place of origin, the communal functions the church provided are shared by those who do not necessarily share the same religious values (Ley Reference Ley2008, 2062). Whether it be English language instruction, job services, food support, or just plain socialization, the immigrant church plays a pivotal role. Continuing into today, the church serves as a place of refuge and assimilation for immigrants. Even after the first immigrants move away, the church welcomes the next wave (Ley Reference Ley2008, 2070).
Research has also highlighted the importance of the neighborhood church in the area of public health. Because there is collective identity and an established support system, church congregations are ideal forums for public health initiatives through behavioral outcomes (Eng et al. 1985, 82). Through models such as Parish nurses, the church can promote wellness by “holistically addressing the physical, emotional and spiritual needs of congregational community members” (Miskelly Reference Miskelly1995, 1). One pointed example is the work that churches have done in promoting HIV/AIDS testing by providing not just the opportunity to test, but also community support for making the decision (Day Reference Day2014, 80).
As far back as W. E. B. Du Bois, scholars have highlighted the social and political power of the church within the community (Du Bois Reference Du Bois1903). Because of the social capital and linkages forged in the congregation, churches are often a pivotal player in political activism. As intermediaries between the state and the individual (Greenberg Reference Greenberg2000, 380), the social networks in the congregation serve as fertile grounds for political discourse. Interestingly, attendance at church is not the catalyst for political activism. Political activism is linked to the church actually encouraging its congregants to become politically active (Brown and Brown Reference Brown and Brown2003, 634).
The church’s role in the neighborhood often extends beyond its congregation. In a study by the Partners for Sacred Places organization, a stunning 81 percent of the beneficiaries of church-based social services were not members of the congregation (Sacred Places 2008, 11). Quantifying the “halo effect” of church activity in economic terms has begun. Preliminary results indicate that the 12 congregations in the Partners for Sacred Places study contributed $52 million to the common good each year (Day Reference Day2014, 68).
In recent times, the social interaction of the church and the neighborhood has grown in both size and institutionalization. After a period of increased social service spending by government between 1994 and 2002, spending on social services dropped almost 16 percent between 2002 and 2007 (Gais 2009, 13). The Great Recession exacerbated this downward trend. The social services provided in the churches are not in addition to government-provided social services – often they are substitutes for decreasing government-provided services. Churches have taken up the slack left by the government’s exit. Several studies show that between 87–92 percent of churches support at least one social program (Wuthnow Reference Wuthnow2006, 28–32). As of 2011, 59 percent of Catholic parishes reported performing social services for their communities (Gray 2011, 2). In fact, the increased involvement of churches was an explicit government policy of the federal government when George W. Bush established the Office of Faith-Based and Community Initiatives in 2002 (Wuthnow Reference Wuthnow2006, 14).2 Whether congregations are categorized as “caring communities” (with a set of shared values, beliefs, understandings, traditions, and norms) or “service organizations” (with arms-length, or contractual understandings) (64 et seq.), they serve as the social safety net for many people. While the religious services of a church may signify its existential existence, its ancillary activities tie it to the social fabric of the neighborhood.
Zoning Law and Religious Use
One reason that the church is such a powerful community-building institution is that it often sits squarely in the residential neighborhood. While religious exemptions to residential use through special use permits are common, the question becomes much more difficult as churches branch out to use their structures for more than religious services. Ancillary uses such as daycares, meeting spaces, and soup kitchens may fulfill the missionary commitment of the church, but often fly in the face of existing zoning regulation. The legal question to be answered is whether these ancillary activities are deemed part of religious practice (thus permitted under zoning regulation) or outside religious use (thus not permitted under zoning regulation). Stated another way: can the government restrict ancillary activities without infringing on religious practice? The jurisprudential route to this answer has been circuitous as the courts and lawmakers look for a way to balance the freedom of religion with the government’s need for consistency and neighborhood stability.
In 2000, Congress passed the Religious Land Use and Institutionalized Persons Act (The Religious Land Use and Institutionalized Persons Act, 42 U.S.C. § 2000cc (“RLUIPA”)), with the stated goal of protecting religious freedoms in a way that is compatible with municipal objectives. The legislation was enacted to meet the need for special safeguards of religious worship in the United States. Germane to the present discussion, RLUIPA focuses on the treatment of “land use of religious institutions as ‘religious exercise’” (Adams Reference Adams2002, 2364; 42 U.S.C. §§ 2000cc, 2000cc-5), and extends the use of the property as eligible for the same rights and protections as other forms of religious practice (Adams Reference Adams2002, 2364).3
RLUIPA provides that no government may enact a land use regulation that “imposes a substantial burden on the religious exercise of a person, including a religious assembly or institution, unless the government demonstrates that imposition of the burden on that person, assembly, or institution is in furtherance of a compelling governmental interest; and is the least restrictive means of furthering that compelling governmental interest.” Further, RLUIPA defines religious exercise as: “any exercise of religion, whether or not compelled by, or central to, a system of religious belief. The use, building, or conversion of real property for the purpose of religious exercise shall be considered to be religious exercise of the person or entity that uses or intends to use the property for that purpose” (42 U.S.C. § 2000cc-5).4
RLUIPA “calls for responsible religious freedom and responsible government: the statute protects churches that are attentive to neighbors and community, and affirms municipalities that address adverse impacts of religious land use with controls that are direct, carefully tailored, and evenhandedly applied” (Carmella Reference Carmella2009, 488–90). This well-choreographed dance between local municipalities and the religious institutions within their boundaries contributes to the social capital of society, allowing these institutions to provide for their communities while at the same time enacting zoning provisions that promote the safety and welfare of the community (Carmella Reference Carmella2009, 488).
In the years before RLUIPA, the law was murkier; courts were reluctant to interfere with local zoning laws. Courts, as well as cities and their inhabitants, had become used to the tight controls and monitored growth of zoning codes, wary of the instability that might ensue with less stringent land use controls (Carmella Reference Carmella2009, 494; Sunstein Reference Sunstein1989, 473).5 Courts saw zoning ordinances as a stabilizing force in communities and were reluctant to shake things up, preferring instead to see the benefits and stability of anticipated land use patterns that the zoning ordinances provide (Carmella Reference Carmella2009, 496–97). The courts’ opinions, particularly in reviewing religious land use and auxiliary uses, varied greatly depending on a number of factors, including the location of the church and the specificity of local ordinances (Galvan Reference Galvan2006, 219).
Recognizing the importance of auxiliary uses to a church, the court sometimes ruled in favor of claimants even if the practice was not fundamental to the religion. In St. Johns Evangelical Lutheran Church v. City of Hoboken, for instance, the city of Hoboken tried to close a homeless shelter that provided meals and a place to sleep for dozens of individuals (479 A.2d 935, 939 (1983); Stout Reference Stout2011, 465). The church argued that offering sanctuary was a tradition firmly entrenched in its history and that closing the shelter would put many people at risk. While it was clear that imminent harm would result if the church were forced to cease its operations as a homeless shelter, the court acknowledged that the city’s concerns for following health and safety protocols should also be addressed. The New Jersey Superior Court found that it would be a “travesty of justice and compassion” for the city to prevent the church from operating a homeless shelter. The court reasoned that providing for the poor was a principal use of the church, protected from the reach of the city’s zoning power (St. Johns v. City of Hoboken, 479 A.2d 935, 939 (1983)). In an effort to comply with health and safety standards, the church agreed that it would reduce the number of occupants to 20 and was then permitted to carry on its operations (939).
RLUIPA clarified the protection of what constitutes the free exercise of religion. Religious practice is many things to many people. It can range from actual prayer in an organized fashion within the walls of a church to daycare or social services that the church provides, or even educational or recreational activities. This breadth of possible over-inclusive activity has been cited by one court as possibly including “parking lots and playgrounds, convents, rectories, and monasteries … day care centers, drug rehabilitation centers, and softball fields” (Warner v. Phuoc Long Buddhist Temple of CT, Inc., 2010 WL 4352716, citing Rathkopf and Rathkopf Reference Rathkopf and Rathkopf1978, 20–53). Too broad a reading would allow RLUIPA to cover all auxiliary uses, permit these uses to function outside of regular land use regulation, and perhaps grant religious landowners an immunity of sorts from local ordinances (Galvan Reference Galvan2006, 209). One commentator has questioned whether RLUIPA allows churches too much lenience to the detriment of the community (Hamilton Reference Hamilton2012, 959).
RLUIPA broadly defines religious exercise as any exercise of religion, whether or not it be central to religious belief; the building in which these things take place is an extension of that exercise (RLUIPA. 42 U.S.C. § 2000cc), thereby removing the necessity of analyzing whether a particular use is integral to an individual’s or organization’s religious exercise (Midrash Sephardi, Inc. v. Town of Surfside, 366 F.3d 1214 (11th Cir. 2004)). The rationale behind accessory uses is to allow religious organizations to carry out the principal use, to “operate fully with the necessary and appropriate accessory uses allowed” (Saxer Reference Ross Saxer2008, 596). This expansive view would pull in any use of the property if the church can tie that use to furtherance of its religious mission. The social services and community endeavors of a church are safeguarded simply because of this linkage to religion.
There are limitations, however. The fact that an accessory use is employed by a religious entity does not automatically guarantee it protection as a religious exercise (Saxer Reference Ross Saxer2008, 619). In Westchester Day School v. Village of Mamaroneck (386 F.3d 183, 189 (2d Cir. 2004)), for instance, the district court granted summary judgment in favor of a religious school whose application to make improvements to its building had been denied. The district court did not address the issue of whether the expansion of the school was for religious purposes. Rather, the court reasoned that the project was religious in nature because the school was a religious school attended by students who wished to further their religious education and was therefore protected from local land use ordinances under RLUIPA (189). On appeal, the 2nd Circuit argued that under this logic, if two schools applied for the expansion of their gymnasium with the only difference being that one was a religious school, the zoning board would not be allowed to reject the application of the religious institution (189). The circuit court vacated the decision and remanded the case back to the district court to review, among other issues, whether the scope of RLUIPA manages to protect the free exercise of religion without conferring special benefits to religion.6
This requirement of furtherance of religious practice in order to withstand scrutiny under RLUIPA will be vital in answering the question of how to replace social services provided by a church that is now a residential structure. It will not simply be an exercise of moving the services to a different location in the same neighborhood because the loss of religious exemption means that the use will most likely violate zoning regulation. As will be discussed, infra, the loss of community benefit without direct method of replacement differentiates the conversion of a church from other instances of development.
Church Closings
Many of the churches established during the great migration to U.S. cities are standing as empty edifices with high maintenance bills and few parishioners to pay those bills. It is important to note that the conversions to condos are not causing the closing of churches. Cities such as Pittsburgh, Detroit, Philadelphia, Chicago, and Boston all suffered large population losses in the last half of the twentieth century. These urban churches have fallen victim not just to the changing demographics of urban America, but were also dealt a knockout blow of dwindling church attendance.7
As one scholar who studies Catholic demographic trends points out, there are beautiful religious structures in New York and Philadelphia and Cleveland – all the urban areas that have seen decreases in population (Wang Reference Wang2015). She goes on to note that as population decreases, the people in the pews are elderly and are not being replaced by younger generations. In response to these and other pressures, churches are closing at a good clip. However, church closings are not evenly distributed. For example, during an earlier round of church closings by the Catholic Archdiocese in Philadelphia, there were charges that the church was abandoning the inner city (Rzeznik Reference Rzeznik2009, 73–90). Indeed the Archdiocese of Detroit learned the importance of narrative in the late 1980s when it received harsh criticism by citing “white flight” as the underlying reasons for the closings (Bridger and Maines Reference Bridger and Maines1998). The massive physical size of most of the churches constrains incremental downsizing. Once the decision to close is made, the entire structure becomes abandoned.
Nationally, Roman Catholic churches date, on average, from 1920, with the majority having been built between the 1940s and 1950s (Gray 2011). The number of parishes peaked around 1990 with 19,620 churches. Some of these churches closed, some merged. Many consolidated services so that many parishes share services with other parishes. According to the CARA, the center specializing in social science research about the Catholic Church, about a third begin a multi-parish arrangement during the period 1995–2004 and another third from 2005 or later so that 67 percent of parishes began sharing services from around the year 1995 through the present (Gray 2011).
The 2000s saw a drop in the number of Catholic churches to 1965 levels. Catholic parishes numbered about 19,000 in 2000. By 2010, the number was fewer than 17,800 (Gray 2011). The decline can be seen in specific cities. In Detroit, for instance, the Archdiocese of Detroit saw the largest number of closings in 1989, with 26 churches closed that year, many of them ethnically oriented congregations that once served the local Polish and German communities (Archdiocese of Detroit 2016). Among the reasons for the decline in Detroit parishioners was the construction of a major highway that required the demolition of 500 homes, leaving parishes without parishioners, and contributing to the decline in church attendance (Bukowczyk Reference Bukowczyk1984). In one Detroit neighborhood, the area never recovered from civil unrest in 1967 and churches merged until finally the remaining church building was sold to a developer (Detroiturbex.com 2016).
The Archdiocese of New York instituted dramatic cuts in 2015 with 40 parish closings and 59 mergers (Archdiocese of New York 2015). The number of parishes in the Archdiocese of Chicago shrank considerably in 1990, with 32 closings (Archdiocese of Chicago, Archives and Records Center). In 2004, the Archdiocese of Boston announced sweeping closures and mergers. The pain was not evenly spread. Sixteen of the 66 closed or merged parishes were in the city of Boston. In the entire diocese, the number of urban churches was reduced by 27 percent (Boston.com 2016).
The loss was felt not only in the Catholic Church, but in other denominations, as well. The Presbyterian Ministry saw its highest number of closings in 2012 (Presbyterian Church Summaries of Statistics – Comparative Statistics; www.pcusa.org). The church dropped from 10,466 churches nationally in 2011 to 9,829 in 2014. The bishop explained that the closings “were necessary … because of shortages of cash, worshippers and priests,” and were “mostly in inner-city neighborhoods and inner-ring suburbs” (O’Malley Reference O’Malley2010). The Lutheran Church saw a steady rate of closings nationally between 2000 and 2014, with an average of 36 churches closing each year.8 In 2002, the Episcopalian Church had 7,305 parishes nationally. By 2013, that number had shrunk to 6,622 (Episcopal Church 2013).9
Demographic Changes in America’s Central Cities
Church closings were predicated not just by a decrease in church membership, but also by population loss. Many of these churches stood in neighborhoods that suffered through massive population hemorrhages. However, although church attendance has yet to see a significant resurgence, it is a new day of population gains in many U.S. cities. After decades of persistent population loss, it appears that American urban centers have turned the corner. The first decade of the millennium followed the demographic pattern of the preceding 50 years of suburbs growing faster than cities. However, from 2010 to 2013, the growth pattern reversed. In fact, in these three years, cities gained more people than they did in the entire preceding decade (Frey Reference Frey2014). In contradistinction to stories in the popular press, Baby Boomers are not driving this urban population growth (Bahrampour Reference Bahrampour2013; Keates Reference Keates2013). This urban renaissance is driven by millennials (Couture 2015). Cities such as Buffalo, Cleveland, New Orleans, and Pittsburgh (all population losers over the previous 50 years) saw a significant increase in their young, college-educated population (Miller 2014). Central Philadelphia (extending to South Philadelphia and Fishtown) has grown so much over the past 15 years that it now ranks second only to Midtown Manhattan when it comes to people living in the heart of a city (Philly 2015). Changing lifestyle preferences (walkability/public transportation,10 the “hip” factor), coupled with the deindustrialization of the cities, are drivers of the millennial attraction to living in central cities (Brinig 2014, 160; Glaeser 2006).11 One real estate industry spokesman went so far as to assert that “The Millennial generation is the key to a sustained real estate recovery” (RealtyTrac 2014).
The central city “recovery” comes at a time when magnificent churches are undergoing deconsecration, renovation, and conversion. No exact data draw a direct line, but the increased supply of condominiums is feeding the demand of new urban dwellers. Church conversions present an interesting offering often in areas that are more affordable as they undergo demographic transition.
Church Conversions to Condos – Some Examples
From an architectural perspective, an abandoned church is a breathtaking opportunity for adaptive reuse. In fact, churches have been converted to artist studios, community centers, and even brew pubs! However, these uses invite others into the neighborhood without permanence. The focus on reuse as residential use (apartment or condominium) requires us to address the issue on a deeper level as the use introduces not just a change within the walls of the structure, but also a change in the composition of the neighborhood. Paradoxically, it is easier to convert a church to a condominium or apartment because, as noted earlier, they generally are located in a residential neighborhood and therefore the new use usually does not require a rezoning effort.
St. Anthony’s of Padua Roman Catholic Church was built in 1889 to serve the Gray’s Ferry neighborhood in Philadelphia. The church served as a neighborhood anchor for 113 years. Its path was in line with the now well-worn story. Where the once thriving parish had 2,000 families and five priests, it dwindled to 175 families and one priest. The church closed in 1999, and another denomination (Greater St. Matthew Baptist Church) bought the property in 1999. However, mounting maintenance costs and lack of parking sealed its fate and that congregation moved out in 2014. Neighbors met with the developer to try to convince him to use the space as a community center, but were told that only use as housing could find financing. In the end, the neighbors were consoled by the fact that the structure could not be demolished due to its historical certification so that, although the use would be housing, the building’s façade would remain. It was sold to a developer that converted it to apartments. Gray’s Ferry (and the whole area known as Graduate Hospital or Center City West) is quickly gentrifying. In one study, the Graduate Hospital area had the largest gains in home price–income ratio in all of Philadelphia between 2000 and 2014 (Pew Trust 2016). According to the real estate website Trulia.com, the median sales price of a home in the Graduate Hospital community was $338,000 in September 2010, peaked at $435,000 in 2014, and stood at about $405,000 in September 2015. The median rent for the area has risen from $1,800 in April 2015 to about $2,075 in 2016. Christened “Sanctuary Lofts,” the apartments are leasing for $1,200–$1,650/month.
Holy Trinity German Catholic Church in Boston’s South End, like other churches, was much more than a physical structure. Holy Trinity was the only German Catholic Church in Boston in the 1800s, and new immigrants joined the church to hear Mass in their native language (Holy Trinity 2016). The present structure was dedicated in 1877 (Holy Cross 2016). In recent years, it also served as base of operations for a day program for homeless adults and a center for at-risk youth, a regular concert series, and social justice ministries. The Boston Archdiocese closed the building in 2008 and deconsecrated it in 2012, citing declining attendance and increased maintenance costs (Keith Reference Keith2014). Holy Trinity parishioners formed a preservation group in October 2013 and lobbied for the church to remain open. They proposed to assume all the maintenance costs of Holy Trinity Church in return for the Archdiocese authorizing one Mass there per year. That proposal was rejected (Boston Catholic Insider 2014). When the Archdiocese of Boston sold Holy Trinity to New Boston Ventures for $7 million in 2014, the archbishop stipulated that the use of a relegated church may be “profane but not sordid.”12 Vacant for nearly five years, it will come to life again – not as a church, but as high-priced condominiums. The South End real estate market is bursting with development amid the current hot real estate market (D. Adams Reference Adams2015a). Now christened “The Lucas,” the former church has been transformed into a luxury condominium building with 33 units that come with a price tag of mid-$600,000 to $4,000,000 (Pohle Reference Pohle2016).
Weaving New Neighbors in Place of Religion
When the new occupants of the former church move in, they bring new sensibilities to the neighborhood. Familiar refrains of gentrification ring true, but in these instances, the newcomers represent more than an addition – they represent a loss. Whether it is a community center, a food pantry, or a safe space for at-risk youth, the community loses valuable social capital in the conversion of the church in a way that other development does not engender. Just as Brinig and Garnett (Reference Brinig and Garnett2014) contend about Catholic schools, the social capital churches generate make them effective community institutions and their loss brings tangible detriment to the neighborhood. In certain respects, conversion of a church sidesteps many of the displacement arguments put forth by scholars and policy makers who oppose gentrification (Lees, Slater, and Wyly Reference Lees, Slater and Wyly2008, 196). No one is forced to move; no existing housing is torn down or gutted.13 This may serve to make the repair of social capital easier. Building of social capital is another way of promoting trust building between the new and the existing neighbors. Just as Matthew Desmond notes (Chapter 7, this volume), trust in your neighbors is crucial. Trust and norms of civic cooperation are essential to well-functioning neighborhoods (Knack 1997, 1283). I suggest, in the same vein as Hankins and Walter, that we should strive for gentrification harnessed for the good of the neighborhood (Hankins and Walter Reference Hankins and Walter2012, 1519).
To realize the full picture, the reuse of a church must be approached with a more inclusive notion of value. Like any real estate transaction, valuation of church property for development relies on cap rates and discounted cash flows. But there is more to fold into the calculation. For instance, many of the negotiations over converting a church can center on the building itself, especially if the building is of historical significance. Whether this designation is precisely linked to higher value (a topic discussed in several chapters of this volume), smart developers recognize the amenity value of the physical structure of the church (whether or not it is historically certified) and monetize that value into the purchase price (D. Adams Reference Adams2015b).14 I submit another component of the value is the social capital generated by the ancillary activities of the church. This capital can be described as both collective efficacy15 and actual social services. The loss of this social capital should not be borne by the community. To recoup that loss, a fee attributable to replacement value must be established and borne by either the developer or the church.
The easy solution would be to require replacement of the lost social services within the renovated structure as a condition for any development. This is an imperfect solution for two reasons: first of all, it does not capture the lost community cohesion. Second, due to the zoning issues detailed, supra, this is not a feasible alternative for legal reasons. In this instance, zoning works to the detriment of the existing neighborhood, as the value of the social services vanish upon redevelopment. Although there is no way for the new development to replace the religious services of the former church, the social services and other amenities can be shifted to other service providers in the neighborhood. I can suggest two ways to ameliorate the effect of loss of social services when a church is closed. Both require an imposition of a fee, but differ in who pays the fee: the church (seller) or the developer (buyer). The fee is shifted either backward to the seller in the form of a reduced purchase price or forward to the developer, who will most likely pass it on to the homebuyer in the form of increased price (Rosenberg Reference Rosenberg2006, 213).
One alternative shifts the payment of the fee to the seller (i.e., a reduction in the net sale price). In this scenario, a portion of the sale price is put into a set-aside or escrow by the seller. The amount of the set-aside would be a rough approximation of the cost to replace the social services provided by the church. This amount would be donated to the church’s social service provider for use by other churches in the neighborhood or close proximity. This method has the advantage of placing the burden of internalizing the externalities on the party whose action causes them to occur. When the diocese (or other canonical body) decides to close a church, an inventory and cost of social and community services that take place in the building should be calculated. Upon sale, an amount sufficient to continue the activity at another location will be held back from the purchase price in the same manner as other escrow accounts (such as environmental escrow accounts).
The other alternative is to require the developer to contribute a fee to social service agencies to offset the impact of the loss of social services in the church. Akin to the Percent for Art fee in Philadelphia16 or the fee imposed on hotel conversions in San Francisco17 this method would be less tied to the community, but more easily assessed than a fee to the diocese. Whether this fee is shifted to the ultimate buyer in the form of a high price or paid by the developer in lower profit is open for debate (Ihlanfeldt and Shaughnessy Reference Ihlanfeldt and Shaughnessy2004). There is even evidence of “overshifting” where the homebuyer’s cost includes a multiple of the fee (Rosenberg Reference Rosenberg2006, 12). The important point is that the costs of the externalities of development are accounted for in the transaction and are not borne by the third-party members of the community.
Impact fees (or exactions) have had a long and somewhat contentious relationship with development. A fee for redeveloping a former church is a monetary imposition that would potentially be subject to heightened “exactions” scrutiny after the court’s ruling in Koontz v. St. Johns River Water Management District (570 U.S. ___, 133 S. Ct. 2586 (2013); see also Fennell and Peñalver Reference Fennell and Peñalver2013, 335). Cynically, exactions can be described as extortion – the city holds a building permit hostage for ransom. However, they provide an efficient means to internalize externalities of development. Although some thought Nollan v. Calif. Coastal Comm’n. (483 U.S. 825 (1987)) and Dolan v. City of Tigard (512 U.S. 374 (1994) – the two decisions that set out the “nexus” and “proportionality” requirements for exactions – would slow (or even stop) municipalities from utilizing impact fees, the report of their death was greatly exaggerated.18 The full impact of the recent decision in Koontz remains to be seen. Land use law commentators are split as to whether Koontz was the “worst takings decision ever” (Echeverria Reference Echeverria2014, 1), or a “straightforward application” of Nollan and Dolan (Martin Reference Martin2014, 39). Nevertheless, with an amenable state statute, a reasonable degree of nexus and rough proportionality, impact fees remain popularly used today to fund street widening, green space provisions, and more.19
Returning to the question of how to replace the loss of community services when a church is converted, the notion of an impact fee can be applied. However, in this case, instead of the municipality receiving the fee, it would be directed to an approved social service agency or other approved not-for-profit whose work can replace the loss in social services or community amenity. In light of the flourishing network of community-based organizations and faith-based social service agencies performing more and more of the social work done in America’s urban centers, a fee for the impact of lost social services can be easily tied to a continuation of those services by another provider.20
In either of the proposed schemes, current neighborhood residents will benefit as they see that part of the purchase price is expressly dedicated to preservation of the social fabric that is now being rewoven. New residents will recognize that moving into a former church is more than a residential decision, thus hopefully sowing the seeds of neighborhood interaction from the very beginning. Community does not have to be lost when a church is converted. Through deliberate action to retain the humanitarian and social impact initiatives, it can find new life to the benefit of all.
Author’s Note
I would like to thank the Kreisman Initiative and the conference organizers for putting together a wonderful series of presentations. It allowed the participants (and the readers of this volume) to view housing through a kaleidoscope of perspectives, all coming back to the common theme of how law and public policy directly impact how and where we live. Thanks for outstanding research assistance goes to Jennifer Barzeski and Sam Waldorf.
If neighborhood perceptions can drive selection into and out of certain areas, influence the concentration of social problems, exacerbate negative health outcomes, and steer urban policy, then identifying factors that influence those perceptions is crucial to understanding city life and developing effective urban policy. What shapes how we see city streets? Research has shown that perceptions of disorder are influenced less by outright signs of decay and neglect – e.g., litter, broken windows, graffiti, public nuisances, crime – than by the kinds of people who inhabit a neighborhood. As it was at the turn of the century, when Du Bois (Reference Du Bois[1899] 1996) was writing about Philadelphia, and as it was at midcentury, when Jacobs (Reference Jacobs1961) was writing about New York, race infuses our evaluations of urban neighborhoods. Sampson demonstrates that nonblack residents are more likely to leave the city if they live in neighborhoods where blacks have a growing presence (Reference Sampson2012, 300). Quillian and Pager show that city dwellers’ perceptions of crime are positively associated with the percentage of young black men in their neighborhood, controlling for crime levels and other neighborhood factors (Reference Quillian and Pager2001).
Race casts a long shadow over neighborhood perceptions. What else does? Here, urbanists are surprisingly quiet; and their silence leaves us particularly unprepared to understand the views of residents in racially segregated neighborhoods, where the vast majority of Americans live. Most surprisingly, researchers have neglected to appreciate how housing dynamics shape neighborhood perceptions. When Du Bois (Reference Du Bois[1899] 1996, ch. 15) set out to write about “the environment” of black Philadelphians, he began by analyzing “houses and rent.” Only after reviewing the cost, quality, and spatial organization of housing in the ghetto did he broaden to “sections and wards.” Du Bois recognized that the house and the neighborhood were intimately linked. But this insight was largely lost on the Chicago School, whose scholars came to view neighborhoods as “moral regions” or sites of residential attainment, a preoccupation that neglected the fact that neighborhoods were also markets and largely owned, in the case of the inner city, by landlords who do not live within their borders. As the neighborhood became a core object of social-scientific analysis, the house faded from view. Despite the efflorescence of research on neighborhood effects (Sampson et al. Reference Sampson, Morenoff and Gannon-Rowley2002; Sharkey and Faber Reference Sharkey and Faber2014), we still know relatively little about the role housing dynamics play in shaping the characteristics and perceptions of city blocks.
To understand the link between housing and neighborhood dynamics, this chapter investigates how three housing dynamics – (1) residents’ reasons for moving; (2) their strategies for finding housing; and (3) the quality of their dwelling – influence neighborhood perceptions. Drawing on a novel survey of renters in Milwaukee, it finds that city dwellers who relocated to their neighborhood after an eviction, who found their apartment through a nonprofit or government agency, and who experienced long-lasting housing problems harbored lower evaluations of their neighborhoods. These findings indicate that any theory of the neighborhood will be incomplete without accounting for the influence of housing dynamics.
Forced into a Neighborhood
Social scientists have long remarked that low-income families experience high rates of residential instability without explaining why this is so. Recent research, however, has revealed the high prevalence of eviction in the lives of renters, demonstrating that poor families move so much simply because they are forced to (Desmond, Gershenson, and Kiviat Reference Desmond, Gershenson and Kiviat2015). Over the past decade, low-income families have watched their incomes stagnate while their housing costs have soared. Meanwhile, only one in four families who qualify for housing assistance receives it. These transformations have led to a rapid increase in severely rent-burdened households – according to the American Housing Survey, roughly half of poor renting families spend at least half of their income on housing (Eggers and Moumen Reference Eggers and Moumen2010) – and eviction has become a common occurrence in the lives of low-income families. In Milwaukee, the setting of this study, one in eight renter households experiences an involuntary move every two years (Desmond and Shollenberger Reference Desmond and Shollenberger2015). Nationwide, renters in more than 2.8 million homes believe they will be evicted soon (Desmond Reference Desmond2015).
While middle-class families may exert a good deal of control and intentionality over their mobility decisions, poor families often are forced from their homes.1 In the harried aftermath of eviction, finding subsequent housing consumes renters’ time and attention. Because many landlords reject recently evicted applicants, displaced families often apply to dozens of apartments before being accepted to one, their housing search stretching on for months (Desmond Reference Desmond2016a). When they finally do find subsequent housing, it is often substandard and located in disadvantaged neighborhoods (Desmond et al. Reference Desmond, Gershenson and Kiviat2015; Desmond and Shollenberger Reference Desmond and Shollenberger2015). But when the alternative is homelessness, the priority of finding shelter takes precedence, even if it means moving into a run-down apartment on a dangerous block. As one mother I met during fieldwork put it to her children after their eviction: “We take whatever we can get” (Desmond Reference Desmond2016a).
It is one thing to enter a neighborhood voluntarily; it is quite another to relocate in the exhausting and stressful aftermath of an eviction. Yet no study has investigated the relationship between the circumstances by which families select into a neighborhood and their perceptions of that neighborhood. If many families settle for a place after their eviction, taking “whatever they can get,” we might expect them to have lower evaluations of their neighborhood than those who moved under less trying circumstances. This leads to the following hypothesis:
Hyp. 1. Renters whose previous move was forced will express less favorable views of their neighborhood than renters who entered the neighborhood through more voluntary means.
Finding a Neighborhood
Besides overlooking why families move, conventional accounts of neighborhood selection also tend to ignore how families move (though see Farley Reference Farley1996; Krysan Reference Krysan2008): the multiple ways they locate subsequent housing. “More often,” write Ludwig and collaborators, “we do not know exactly what is driving the [neighborhood] selection process, and we should worry that selection could occur in part on the basis of factors that are not well understood or easily measured” (Reference Ludwig, Liebman, Kling, Duncan, Katz, Kessler and Sanbonmatsu2008, 176). But we can study directly “what is driving the selection process,” treating neighborhood selection as an important topic of inquiry in its own right (Sharkey Reference Sharkey2013). “In examining the sources and social consequences of residential sorting,” Sampson has argued, “we need to conceptualize neighborhood selection not merely as an individual-level confounder or as a ‘nuisance’ that arises independent of social context. Instead, neighborhood selection is part of a process of stratification that situates individual decisions within an ordered, yet constantly changing, residential landscape” (Reference Sampson2008, 217).
The relocation strategies of urban renters may be meaningfully diverse. Some may undertake a search independently, scanning the newspaper, local media sources, or the Internet for housing options. Others may use state, municipal, or nonprofit social-service agencies. Still others may rely on network ties, relocating to neighborhoods because a family member or friend told them about a unit coming available or referred them to a landlord (Rossi Reference Rossi[1955] 1980, 207–10). Could the ways renters find housing influence their neighborhood perceptions?
There is a qualitative difference between finding an apartment through your own efforts or those of your social network and moving into a place found or assigned by a third-party agency, such as the Public Housing Authority. It is the difference between placing yourself and being placed in a neighborhood. In the former instance, renters may have spent more time, money (e.g., application fees), and social capital during their housing search, which may kindle a psychological desire to reap returns on their efforts. Should the neighborhood be unsafe or otherwise distressed, renters who found housing alone or through their social connections have no one to blame other than themselves or their close ties, while renters who found housing through a nonprofit or government agency can blame a third party. These considerations lead to the following hypothesis:
Hyp. 2. Renters who located housing themselves or by relying on social networks will express more favorable views of their neighborhood than renters who found housing through a government or nonprofit agency.
Seeing Your Neighborhood through Cracked Windows
Besides paying attention to the circumstances of city dwellers’ previous moves, and the ways they located subsequent housing, I also consider the condition of a family’s house. Housing quality in the United States has increased significantly over the past decades (Schwartz Reference Schwartz2010). However, some low-income families still live in degrading and dangerous housing conditions. According to the American Housing Survey, 1.2 million renter-occupied units had severe physical problems in 2011 (Desmond Reference Desmond2016a).
For many city dwellers, most of their time spent in a neighborhood is spent in their homes. Poor housing conditions could influence residents’ neighborhood perceptions in at least two ways. First, such conditions could dim their perceptions of the world in general. Studies have linked housing problems to poor mental health outcomes, including depressive symptoms, anxiety, and neurological disorders (Evans, Wells, and Moch Reference Evans, Wells and Moch2003; Shaw Reference Shaw2004); and quasi-experimental evidence suggests that housing improvements can improve mental health outcomes (Curl et al. Reference Curl, Kearns, Mason, Egan, Tannahill and Ellaway2015). Negative mental health outcomes could be a mechanism through which poor housing conditions deflate residents’ perceptions of their neighborhood.
Second, city dwellers with poor housing conditions may spend less time in their homes and thus may be more regularly exposed to neighborhood disorder and crime simply by virtue of heightened neighborhood usage. One way to cope with sinking bathtubs, stopped-up plumbing, and no heat is by spending as little time in your home as possible. As one resident of a low-income trailer park in Milwaukee told me: “My trailer is a hotel. … I sleep there, and that’s about it. I wake up in the morning and leave and go to bed at night, and that’s it.” Housing problems are concentrated in disadvantaged neighborhoods (Desmond Reference Desmond2016a). Residents of those neighborhoods who flee poor housing conditions may find themselves confronting a different set of problems in the form of public disorder or violence. These paired considerations lead to the following hypothesis:
Hyp. 3. Renters living with poor housing conditions will express less favorable views of their neighborhood than renters who live in higher-quality housing.
Data
To test these three hypotheses, this study draws on the Milwaukee Area Renters Study (MARS), an original survey comprised of more than 250 unique questions asked of 1,086 tenants in Milwaukee’s private housing sector (Desmond Reference Desmond2016b).2 From 2009 to 2011, households were selected into MARS through multi-stage stratified sampling. Blocks were randomly selected from strata so as to create a sample generalizable to Milwaukee’s rental population. This sampling strategy drew from 168 of 591 unique block groups, representing 28 percent of Milwaukee block groups. When a block was selected into the sample, interviewers visited every renter-occupied household in it, saturating the targeted areas. To bolster response rate and data quality, surveys were administered in person in English and Spanish by professional interviewers at tenants’ place of residence. For each household, interviewers surveyed an adult leaseholder or, should a leaseholder be unavailable, an adult knowledgeable about household financial matters. According to the most conservative calculation (AAPOR Rate 1), MARS has an 83.4 percent response rate.
After data collection, custom design weights were calculated to reflect the inverse of selection probability, facilitated by a Lahiri (Reference Lahiri1951) procedure, based on the demographic characteristics of Milwaukee’s rental population and adjusted to MARS’s sample size. The Lahiri procedure allows the sampler to select probability samples (with a probability proportional to size) and to compute the selection probabilities for the resulting sample. Selection probabilities are then used to calculate the design weights for the overall sample. I use custom weights when presenting descriptive statistics.
The characteristics of Milwaukee’s residents (Pager Reference Pager2007) and rental market (U.S. Department of Housing and Urban Development 2009) are comparable to those of many U.S. cities. Most low-income city dwellers neither own their homes nor live in public housing (Desmond Reference Desmond2015; Schwartz Reference Schwartz2010). MARS’s focus on the private rental market, then, reflects the experiences of the vast majority of low-income families.3 That said, it is important to bear in mind that the MARS sample excludes homeowners, and the extent to which these findings apply to other cities remains to be seen.
Main Outcome Variables
This study relies on two measures of neighborhood perception: the degree to which renters trust their neighbors and the amount of concentrated suffering renters believe to be within their neighborhood.
Perceived Trust. Cultivating social capital and collective efficacy on the local level depends in large part on the degree to which neighbors find one another trustworthy. Studies have shown that social trust not only serves as the foundation for civic engagement and reciprocal exchanges that help families make ends meet (Putnam Reference Putnam2001; Sampson Reference Sampson2012); it also is linked to individual health outcomes and other indicators of well-being (Kawachi et al. Reference Kawachi, Kennedy, Lochner and Prothrow-Stith1997). Accordingly, I measured renters’ neighborhood perceptions through the question: “How much do you trust people in your neighborhood?” Responses were recorded on a five-point scale ranging from “not at all” to “a great deal.” For ease of interpretation, neighborhood trust is reported as a binary variable. Renters were considered to trust their neighbors if they reported trusting people in their neighborhood “quite a bit” or “a great deal.”
Perceived Suffering. I also observed the degree to which renters believe social problems were found in their neighborhood (Sampson Reference Sampson2012). Each respondent was asked: “While you have been living in this neighborhood, have any of your neighbors ever: (1) been evicted; (2) been in prison; (3) been in an abusive relationship; (4) been addicted to drugs; (5) had their children taken away by social services; or (6) had a close family member or friend murdered?” This measure allowed me to observe what kind of neighborhood renters believed themselves to be living in: one relatively free of hardship, violence, and vice or one brimming over with disadvantage. I treat this measure as a count variable (score 0–6).
Explanatory Variables
Forced Moves. To assess if renters’ neighborhood perceptions were influenced by the nature of their previous move – the housing-related circumstances that brought them to their current neighborhood – I examined if that move was induced by eviction, foreclosure, or building condemnation (Desmond and Shollenberger Reference Desmond and Shollenberger2015). These are moves that were involuntary or forced, initiated by landlords or city officials (e.g., code inspectors), and involved situations where tenants had no choice other than to relocate. Forced moves are distinct not only from voluntary moves, intentional and uncoercive relocations often carried out to gain residential advantage, but also from responsive moves, motivated by housing or neighborhood conditions such as rent hikes, a deterioration in housing quality, or escalating neighborhood violence. Because retrospective data are most reliable when limited to a recent recall period (Beckett et al. Reference Beckett, DaVanzo, Sastry, Panis and Peterson2001), I only recorded involuntary moves that occurred within two years prior to the survey. Doing so had the added benefit of conservatively biasing the estimated effect of eviction toward zero, since renters who had lived in their neighborhood for more than two years and whose previous move was involuntary were not classified as recently evicted.
Housing Search Strategies. I observed how tenants found their current residence through the question: “How did you find this place? Was it through: (a) a friend; (b) a family member; (c) a [nonprofit] agency; (d) a newspaper, Redbook, Bluebook;4 (e) a ‘for rent’ sign; (f) the Internet; (g) the Housing Authority; (h) some other way?” I organized responses into three categories: network-based searches that relied on kin, friends, or other social ties; agency-based searches that relied on the Housing Authority or nonprofit organizations; and individual searches in which tenants located housing themselves by relying on print media or the Internet, or by calling on “for rent” signs. Nearly all renters in our sample (97 percent) found housing exclusively through one of these types of searches.5 Although renters may have searched for housing in multiple ways, this measure records the technique that led them to the dwelling they inhabited at the time of the survey.
Housing Problems. To measure housing quality, renters were asked if they had experienced any of the following problems in their current residence in the year prior to being interviewed: at least three days with (a) a broken stove or other appliance; (b) a broken window; (c) a broken exterior door or lock; (d) mice, rats, or other pests; or (e) exposed wires or other electrical problems; or at least 24 hours with (f) no heat; (g) no running water; or (h) stopped up plumbing. Responses were summed.
Controls
All models control for a number of demographic attributes related to neighborhood perception, including respondents’ race and ethnicity, gender, and age (Hartnagel Reference Hartnagel1979; Quillian and Pager Reference Quillian and Pager2001). I also observed respondents’ highest level of education, a stable measure of socioeconomic status (Sampson Reference Sampson2012; Soss and Jacobs Reference Soss and Jacobs2009). I accounted for family status by observing if each respondent lived with minor children and was the only adult in the household. Living alone or with children could influence one’s views of their community (Kimbro and Schachter Reference Kimbro and Schachter2011; Klinenberg Reference Klinenberg2012).
Renters who experienced recent setbacks might also harbor more negative views of their community. Accordingly, I observed if renters lost their job or experienced relationship dissolution within the previous two years. Although cost-burdened renters need not experience a major setback to invite eviction, accounting for recent job losses and breakups allowed me to observe the relationship between involuntary moves and neighborhood perceptions, conditioning on other recent shocks that could also color renters’ views.
Next, I controlled for several factors related to respondents’ time and experiences in their neighborhood. Long-standing residents might view their community in a different light than new arrivals (Highton Reference Highton2000). Accordingly, I observed how long each respondent had lived in her or his neighborhood. In a similar vein, I controlled for the distance (in miles) between renters’ current and previous addresses. Moving long distances, such as relocating from across the city or another city entirely, could influence one’s views of their current community in stronger ways than moving short distances. Additionally, because renters’ neighborhood experiences and perceptions are steered by their relationships with people in their community (Glynn Reference Glynn1986; Stack Reference Stack1974), I observed how many of a respondent’s “closest family members/friends” lived in her or his neighborhood.
The address of each MARS respondent was geo-coded using ArcGIS and an associated road network database. I then assigned each residence to a census block group, my neighborhood metric. In Milwaukee, the population of the average block group was 1,135 in 2010. Each block group was then linked to aggregate data from the 2010 U.S. Census and crime records from the Milwaukee Police Department. I controlled for neighborhood poverty rate: the percentage of people in a census block group below the poverty line. This is a straightforward measure of concentrated disadvantage (Sampson Reference Sampson2012; Wilson Reference Wilson1987). As discussed later, results are robust to other community-level measures, including a neighborhood disadvantage composite variable.
To account for missing data prior to estimation, I conducted multiple imputation (m = 10). Values for missing data were estimated using regression equations that relied on all in-sample variables as predictors (Allison Reference Allison2002). Where appropriate, logit, ordinal logit, and negative binomial models were used, depending on the type of imputed variable. By and large, MARS has very little missing data. The average variable in our sample was missing only 1.2 percent of observations. Findings hold across imputed and non-imputed datasets. Summary statistics for all variables are presented in Table 7.1.
Table 7.1: Weighted Summary Statistics
| Mean | SD | Min | Max | Count | |
|---|---|---|---|---|---|
| Perceived Trust | 2.88 | 1.18 | 1 | 5 | 1,055 |
| Perceived Suffering | 0.91 | 1.32 | 0 | 6 | 1,021 |
| Previous Move was Forced | 0.10 | 0 | 1 | 1,063 | |
| Found Housing through Network | 0.51 | 0 | 1 | 1,063 | |
| Found Housing through Agency | 0.05 | 0 | 1 | 1,063 | |
| Found Housing through Self | 0.44 | 0 | 1 | 1,063 | |
| Number of Lasting Housing Problems | 0.80 | 1.14 | 0 | 9 | 1,063 |
| Black Renter | 0.34 | 0 | 1 | 1,060 | |
| Hispanic Renter | 0.14 | 0 | 1 | 1,060 | |
| White Renter | 0.46 | 0 | 1 | 1,060 | |
| Other Race Renter | 0.06 | 0 | 1 | 1,060 | |
| Female Renter | 0.62 | 0 | 1 | 1,062 | |
| College Graduate | 0.40 | 0 | 1 | 1,074 | |
| Age | 38.78 | 14.68 | 15 | 91 | 1,053 |
| Months in Neighborhood | 48.44 | 75.88 | 0 | 635 | 1,037 |
| Miles from Previous Residence | 47.33 | 309.35 | 0.006 | 5,408 | 1,032 |
| Minor Children in Household | 0.43 | 0 | 1 | 1,060 | |
| Only Adult in Household | 0.47 | 0 | 1 | 1,063 | |
| Neighborhood Strong Ties | 1.91 | 2.43 | 0 | 26 | 1,044 |
| Recent Job Loss | 0.19 | 0 | 1 | 1,049 | |
| Recent Relationship Dissolution | 0.23 | 0 | 1 | 1,061 | |
| Neighborhood Poverty Rate | 0.12 | 0.15 | 0 | 0.89 | 1,062 |
| Observed Disorder | 0.04 | 0 | 1 | 1,036 | |
| Violent Crime Rate | 0.12 | 0.12 | 0 | 0.87 | 1,056 |
| Neighborhood Disadvantage | −0.51 | 0.79 | −1.451 | 2.99 | 1,056 |
Note: Milwaukee Area Renters Study, N = 1,086.
Methods
I use regressions to examine the relationship between housing dynamics and neighborhood perceptions. When estimating neighborhood trust (0, 1), I rely on logistic regression. To investigate the association between housing dynamics and perceptions of concentrated suffering (a count variable), I employ negative binomial models. Along with the controls listed earlier, models include block-group fixed effects to account for time-invariant neighborhood factors potentially correlated with renters’ perceptions of their community (Allison Reference Allison2009). The identification strategy of the multivariate analyses, then, conditions both on time-variant ecological indicators of disadvantage (through neighborhood-level coefficients) and time-invariant indicators (through neighborhood fixed effects), facilitating comparisons between similar renters in similar neighborhoods who differ with respect to the reasons they entered the neighborhood, how they located their housing, and the quality of dwelling they inhabit.
To address treatment selection, I also employ propensity score matching. Applying experimentalist logic to observational data, this technique compares renters matched along several observable characteristics but who differ by whether they were exposed to a treatment: in this case, one of the three housing dynamics of interest (Rosenbaum and Rubin Reference Rosenbaum and Rubin1983). To predict renters’ propensity for (1) selecting into the neighborhood after a forced move (e.g., eviction) and (2) finding housing through an agency, I included the following characteristics in the matching algorithm: race, age, gender, education, recent job loss, and recent relationship dissolution, as well as indicators for whether the tenant is the only adult in the household or lives with minor children. In addition to these characteristics, when predicting renters’ propensity for (3) experiencing any lasting housing problem (here, a binary outcome), I also included how many months they had lived in the neighborhood, the miles between their current and previous residence, neighborhood-based strong ties, and the neighborhood poverty rate.
Descriptive Patterns: Forced Mobility, Search Strategies, and Housing Problems
Looking strictly at moves that occurred within the previous two years, I found that the prior move for 1 in 10 renters in Milwaukee was a forced relocation. A nontrivial percentage of renting families, then, selected into their current home and community through an involuntary dislocation from their previous neighborhood. This was the case for 17 percent of Hispanic renters, 10 percent of black renters, and 9 percent of white renters – a disparity driven in large part by the high rate of landlord foreclosures in predominantly Latino neighborhoods during the study period (Desmond and Shollenberger Reference Desmond and Shollenberger2015). Fifteen percent of renters living in neighborhoods with high concentrations of poverty (where at least 40 percent of residents lived below the poverty line) came to their neighborhoods after an eviction, compared to 9 percent of renters residing in low-poverty areas (where less than 20 percent of residents lived in poverty).
As displayed in Figure 7.1, considerable differences appear in perceived neighborhood trust and suffering between renters who selected into their community after a forced move and those who did not. Compared to renters who had relocated to their neighborhood after a recent eviction, other renters were twice as likely to report trusting people in their neighborhood “quite a bit” or “a great deal.” This difference is statistically significant (p = 0.007). Recently evicted movers were also far more likely to perceive suffering in their neighborhood (27 percent), compared to non-forced movers or long-term stayers (21 percent).
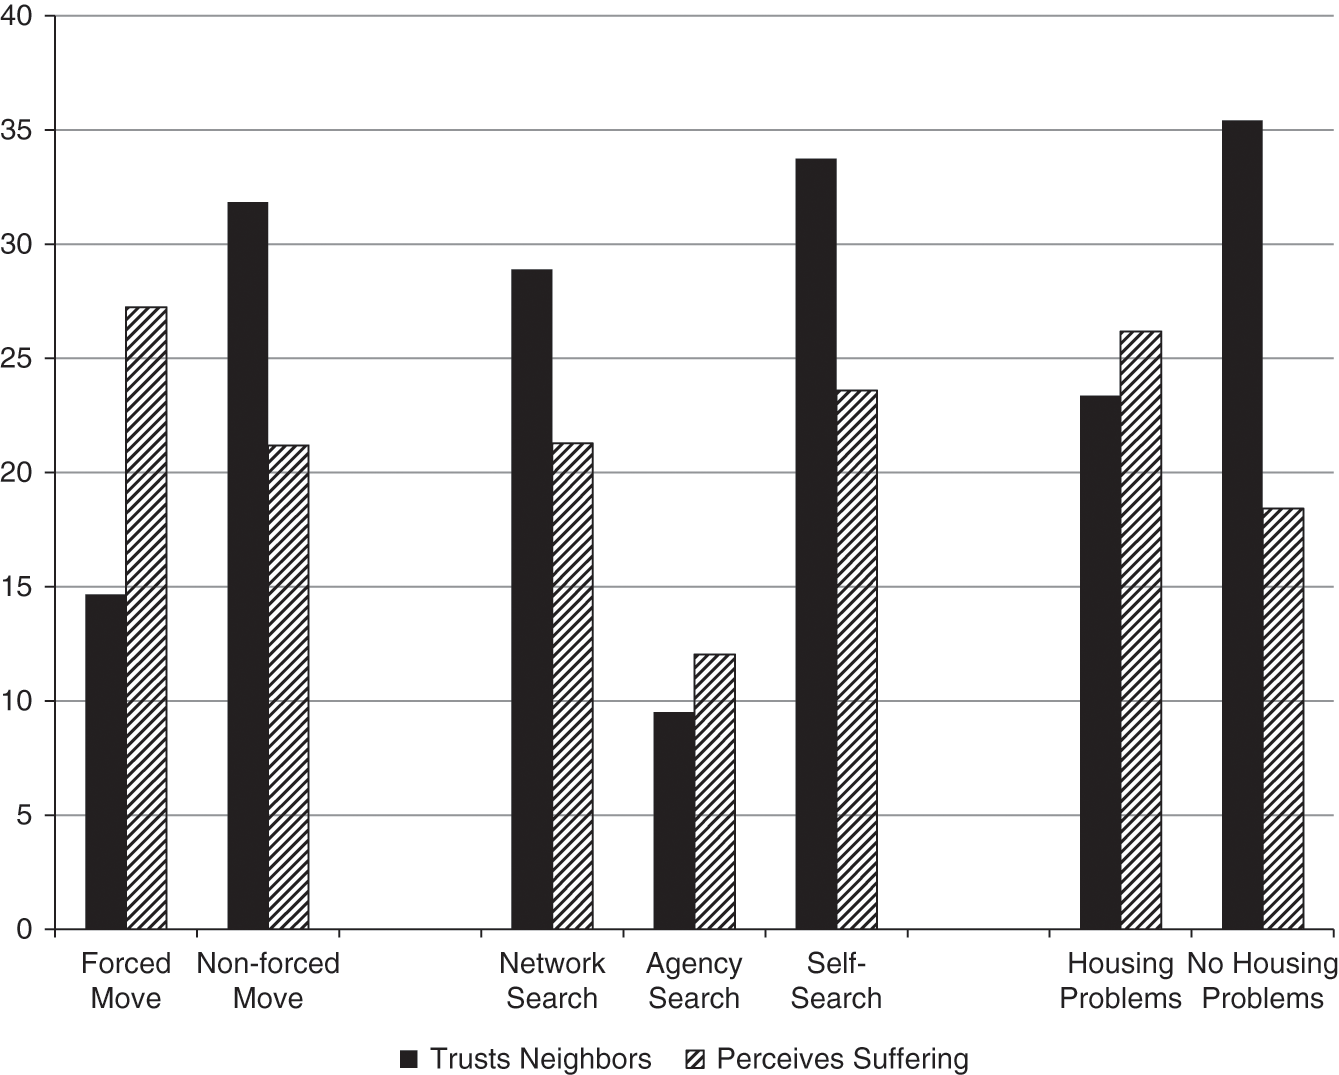
Figure 7.1 Perceived Neighborhood Trust and Suffering by Reasons for Moving, Housing Search Strategies, and Housing Problems (weighted percentages). Renters were considered to have housing problems if they reported at least one lasting issue. Renters were considered to trust their neighbors if they reported trusting people in their neighborhood “quite a bit” or “a great deal.” Renters were considered to perceive suffering if they reported that their neighbors had experienced two or more adverse events. Milwaukee Area Renters Study, N = 1,086.
With respect to locating new housing, most Milwaukee renters (51 percent) found their current housing through a network connection: a friend, family member, church attendee, coworker, or other social tie. An additional 44 percent found their housing by themselves, through searching the newspaper or Internet, or spotting a “for rent” sign. Only 5 percent of renters found their housing through a government or nonprofit agency.
While roughly 58 percent of black renters found housing through social networks, the same was true for 50 percent of Hispanic renters and only 41 percent of white renters. The majority of white renters (54 percent) and 49 percent of Hispanic renters located housing through an independent search. Roughly 34 percent of black renters relied on a self-guided search. A small share of renters – roughly 5 percent of white renters, 8 percent of black renters, and less than 1 percent of Hispanic renters – relied on agencies. The vast majority of tenants who located housing through network ties relied on kin and friends. In sharp contrast to research suggesting that black job seekers receive less help from social ties than other groups (Smith Reference Smith2007), I found that black house seekers receive more.
White, black, and Hispanic renters who searched for housing independently did so differently. Roughly 48 percent of whites who found housing on their own relied on the Internet, and 33 percent found housing after spotting a “for rent” sign. A total of only three Hispanic households who undertook a self-guided search used the Internet. The majority of them (55 percent) found housing through “for rent” signs. Only 15 percent of black households who executed an independent search relied on the Internet. A third found housing through “for rent” signs and an additional third through the newspaper or other print media. Except for white renters, looking for rental housing was largely an un-digital affair.
Figure 7.1 indicates that the ways renters found housing might influence how they perceive their neighborhoods. The difference is especially acute when it comes to trusting one’s neighbors. Roughly a third of renters who located housing independently reported high levels of neighborhood trust; the same was true for 29 percent of renters who located housing through social networks. However, only 9.5 percent of renters who found housing through an agency reported high levels of neighborhood trust, a statistically significant difference when compared to non-agency search methods (p = 0.04). Surprisingly, the reverse pattern was observed with respect to perceived suffering, with renters who found housing independently and through networks being roughly twice as likely to report suffering in their communities, compared to renters who relied on agencies to locate housing.
Regarding housing quality, 44 percent of Milwaukee renters reported experiencing at least one significant and lasting housing problem. Twenty-one percent of renters reported one problem; 16 percent reported two; and 7 percent reported three or more. Black and Hispanic renters were more likely to live in poor-quality housing, with 52 percent and 42 percent, respectively, experiencing any housing problem, compared to 37 percent of white renters. Housing problems affected renters across the city, particularly those in poor communities. Forty-two percent of renters in neighborhoods with poverty rates below 20 percent reported housing problems, compared to 58 percent of renters in all other neighborhoods.
While more than a third of renters who experienced no housing problems reported high levels of trust in their neighbors, the same was true for less than a quarter of those who experienced at least one housing problem, a statistically significant difference (p = 0.03). Likewise, while 18 percent of renters who lived in decent conditions perceived suffering in their community, 26 percent of those who reported at least one lasting housing problem did.
Multivariate Models
To further examine these patterns in a multivariate framework, I employed logistic and negative binomial regression analyses. Table 7.2 displays the results. Separate models were estimated for each of the three explanatory variables: eviction, housing search methods, and housing problems. Models 1 and 3 include the full suit of control variables; Models 2 and 4 also employ neighborhood fixed effects.
Table 7.2: Logistic and Negative Binomial Regression Models Estimating Neighborhood Perceptions
| Neighborhood Trust | Perceived Suffering | |||
|---|---|---|---|---|
| (1) | (2) | (3) | (4) | |
| Previous Move Was Forced | −0.360 | −0.171 | 0.241* | 0.192 |
| (0.234) | (0.259) | (0.106) | (0.123) | |
| Found Housing through Agency | −1.406* | −1.236* | −0.245 | −0.196 |
| (0.549) | (0.567) | (0.205) | (0.210) | |
| Found Housing through Networks | −0.075 | 0.095 | −0.043 | −0.068 |
| (0.156) | (0.173) | (0.083) | (0.090) | |
| Lasting Housing Problems | −0.250*** | −0.271*** | 0.174*** | 0.185*** |
| (0.066) | (0.074) | (0.023) | (0.027) | |
Note: Milwaukee Area Renters Study, N = 1,086. Logistic regression models are used when estimating perceived trust; negative binomial regression models are used when estimating perceived suffering. Separate regressions were used to estimate the association between eviction, housing search methods, and housing problems on neighborhood perceptions. Models 2 and 4 include neighborhood fixed effects. All models control for months in neighborhood; miles from previous residence; the race, age, gender, and education of respondents; if respondents live with other adults or children; if respondents recently experienced job loss or relationship dissolution; how many of each respondent’s strong ties live in the neighborhood; and the neighborhood (block group) poverty rate.
* p < 0.05; ** p < 0.01; *** p < 0.001 (two-tailed)
Table 7.2 shows that renters whose previous move was forced reported significantly higher levels of perceived neighborhood suffering, all else equal. A previous eviction is estimated to increase the likelihood that renters will perceive suffering in their neighborhood by 27 percent. However, the association between eviction and perceived suffering becomes insignificant when neighborhood fixed effects are introduced. No model documented a statistically significant relationship between eviction and neighborhood trust.
I did, however, document such a relationship when the explanatory variable was housing search strategies. Specifically, renters who located housing through agencies expressed lower levels of neighborhood trust. All else equal, finding housing through an agency is predicted to reduce renters’ levels of neighborhood trust by 71 percent, a finding robust to neighborhood fixed effects. No relationship between housing search strategies and perceived neighborhood suffering was documented.
My findings also indicate that housing problems are associated with lower levels of perceived neighborhood trust and higher levels of perceived neighborhood suffering. After controlling for several relevant factors and including neighborhood fixed effects, each lasting housing problem a renter experiences is expected to decrease her or his odds of trusting neighbors by 24 percent and increase her or his level of perceived suffering by 20 percent. Renters who lived with more housing problems thought less of their neighborhoods.
All else equal, older renters and those with at least some college education reported higher levels of neighborhood trust, while Hispanic renters expressed lower levels of perceived suffering (results available upon request). Renters who had lived in the neighborhood longer and who counted more of their neighbors among their closest family members and friends reported higher levels of perceived suffering. This suggests that those who spend more time in a neighborhood and who are intimately connected with their neighbors may have a heightened sensibility of the adversity surrounding them. That housing dynamics remained a significant and substantially large predictor of more negative neighborhood perceptions after a number of relevant controls were introduced indicates that the circumstances that led families to select into a neighborhood, how they selected in, and the conditions of their home are critically important to understanding how they see their local community.
Robustness Checks
Across models, the neighborhood poverty rate was negatively associated with perceived trust and positively associated with perceived suffering, indicating that renters living in more economically disadvantaged neighborhoods harbor dimmer views of their community. To test whether the results were robust to alternative ecological specifications, I replicated the fixed effects models displayed in Table 7.2, replacing block-group poverty rate with three alternative neighborhood-level measures. The first was Observed Disorder, a binary variable that takes the value of 1 if survey interviewers documented abandoned buildings and litter on a respondent’s street. Renters’ perception of their community might be dragged down if they lived on streets displaying visible signs of distress.
I also substituted neighborhood poverty with Violent Crime rates, the latter being among the most important indicators of neighborhood disadvantage (Sampson Reference Sampson2012; Wilson Reference Wilson1987) and may affect cognitive functioning (Margolin and Gordis Reference Margolin and Gordis2000; Sharkey and Sampson Reference Sharkey, Sampson, Schutt, Keshavan and Seidman2015) Drawing on data supplied by the Milwaukee Police Department, I estimated each neighborhood’s violent crime rate as the sum of all counts of homicide, kidnapping, assault, arson, robbery, and weapon-related incidents per 100 people in the year a renter was surveyed.
Last, I created the composite variable, Neighborhood Disadvantage, via factor analysis, loading seven block-group characteristics onto a single scale: median household income, violent crime rate, and the percentages of families below the poverty line, of the population under 18, of residents with less than a high school education, of residents receiving public assistance, and of vacant housing units. This measure provides a more comprehensive estimate of neighborhood quality.
Separate models were estimated for each neighborhood-level control. The results are displayed in Table 7.3. In addition to using neighborhood fixed effects, these models include all individual- and household-level control variables employed in Table 7.2. The results are robust to alternative neighborhood specifications. Across all models, renters who worked with an agency to find housing reported lower levels of neighborhood trust, and those living in substandard conditions expressed more negative views of their local community.
Table 7.3: Fixed Effects Models with Alternative Neighborhood Controls
| Observed Disorder | Violent Crime | Neighborhood Disadvantage | |
|---|---|---|---|
| Neighborhood Trust | |||
| Previous Move Was Forced | −0.177 | −0.145 | −0.126 |
| (0.267) | (0.260) | (0.260) | |
| Found Housing through Agency | −1.104+ | −1.251* | −1.252* |
| (0.574) | (0.568) | (0.570) | |
| Lasting Housing Problems | −0.251** | −0.270*** | −0.270*** |
| (0.074) | (0.074) | (0.074) | |
| Perceived Suffering | |||
| Previous Move Was Forced | 0.200 | 0.182 | 0.180 |
| (0.124) | (0.124) | (0.123) | |
| Found Housing through Agency | −0.207 | −0.201 | −0.191 |
| (0.216) | (0.211) | (0.210) | |
| Lasting Housing Problems | 0.190*** | 0.182*** | 0.183*** |
| (0.027) | (0.027) | (0.027) |
Note: Milwaukee Area Renters Study, N = 1,086. Logistic regression models are used when estimating perceived trust; negative binomial regression models are used when estimating perceived suffering. These models include all individual- and household-level control variables used in Table 7.2. Observed Disorder = 1 if survey interviewers noticed abandoned buildings and litter on a given block. Violent Crime is the sum of all counts of homicide, kidnapping, assault, arson, robbery, and weapon-related incidents (categories based on Incident-Based Reporting codes) per 100 people per year. Neighborhood Disadvantage is a composite variable created via factor analysis, with seven block-group characteristics loading onto a single scale: median household income, violent crime rate, and the percentages of families below the poverty line, of the population under 18, of residents with less than a high school education, of residents receiving public assistance, and of vacant housing units.
+ p < 0.1; * p < 0.05; ** p < 0.01; *** p < 0.001 (two-tailed)
As a final robustness check, I employed propensity score matching to estimate differences in neighborhood trust and perceived suffering by eviction, agency-based housing searches, and experiencing at least one housing problem. The results are displayed in Table 7.4. The findings indicate that agency-based searches and housing problems are negatively related to neighborhood trust, while previous involuntary moves and housing problems are positively associated with perceived suffering.
Table 7.4: Propensity Score Matching Estimates, Average Treatment Effects
| Neighborhood Trust | Perceived Suffering | |
|---|---|---|
| Previous Move Was Forced | 0.041 | 0.348* |
| (0.061) | (0.173) | |
| Found Housing through Agency | −0.224*** | −0.277 |
| (0.036) | (0.198) | |
| Lasting Housing Problems | −0.098** | 0.619*** |
| (0.031) | (0.113) |
Note: Milwaukee Area Renters Study, N = 1,086. Here, Lasting Housing Problems is a binary variable, with 1 indicating having experienced any problems.
* p < 0.05; ** p < 0.01; *** p < 0.001 (two-tailed)
Discussion
Most of the chapters in this volume focus on housing markets and their regulation, with the primary actors being real estate investors, policy makers and enforcers, and homeowners. This study, by contrast, increased the magnification to focus on the relationship between housing and neighborhood dynamics in an American city, understood through the experiences of urban renters, many of whom live below the poverty line. An analysis of a unique dataset of Milwaukee renters found that those who had relocated to their neighborhood after an eviction or other kind of involuntary displacement, located their apartments through a government or nonprofit agency, or experienced multiple housing problems saw their neighborhood in a lesser light. With the exception of the finding pertaining to the estimated effect of eviction on neighborhood perceptions, the results of this study are robust to multiple measures of neighborhood quality as well as to neighborhood fixed effects.
What mechanisms help explain these patterns? Consider, first, the relationship between eviction and negative neighborhood perceptions. This study found some evidence that renters whose previous move was involuntary reported higher levels of perceived suffering, although this finding was not robust to neighborhood fixed effects specifications. Eviction can be a demoralizing process involving families being forced from a community in which they were invested to a neighborhood they consider undesirable (Desmond Reference Desmond2016a). If processed through the court system, an eviction comes with a record, which can result in families moving into worse neighborhoods and substandard housing (Desmond and Shollenberger Reference Desmond and Shollenberger2015). Even if evicted families relocate to equivalent housing and similar neighborhoods, they may still feel that their surroundings are of lower quality because they were accepted under acute duress; after all, the effect of eviction on local trust remained after controlling for neighborhood poverty rate and housing quality. Alternatively, eviction can affect one’s mental health, heightening depressive symptoms and stress levels (Desmond and Kimbro Reference Desmond and Kimbro2015), which could cast a pall over renters’ outlooks in general, including their views on the local community.
A more puzzling finding, however, concerns the observation that renters who located their housing through a government or nonprofit agency had a dimmer view of their neighborhoods. These renters did live in more disadvantaged neighborhoods: the poverty rate for the average agency-assisted renter was 28 percent, compared to 11 percent for all other renters. However, the link between locating housing through a third party and lower levels of community trust remained after conditioning on several ecological characterizes and including neighborhood fixed effects. When attempting to understand this pattern, it is important to recognize, first, that the vast majority of these renters (91 percent) did not receive housing assistance. So this finding should not be interpreted as reflecting the perceptions of voucher holders. On the contrary, two-thirds of renters who located housing through a government or community organization relied on a nonprofit agency; and roughly 40 percent sought help from the Housing Authority. By and large, then, most renters who located housing through a government or nonprofit agency did not receive additional help, like rent assistance, and relied on nonprofit organizations.
To further investigate possible dynamics beneath this pattern, I examined the reasons these renters offered as to why they moved into their neighborhoods. Some renters who relied on agencies to find housing expressed a lack of options when it came to neighborhood choice. “This is what the Housing Authority had open,” one renter said. “Couldn’t find anywhere else to go,” said another. As these comments attest, finding housing through an agency can be a stressful and rushed experience, owing to time limits affixed to assistance and limited staff capacity. This may influence how renters see the neighborhood into which they eventually select.
This finding suggests a pair of implications for policy makers. First, expanding a city’s stock of temporary housing would allow housing organizations to operate with more slack. When the alternative is homelessness, an organization assisting a family in need is more likely to identify housing options quickly and to encourage clients to accept whatever is available. However, if that family were able to stay in temporary housing for some duration of time, organizations could provide families more housing options. This could boost low-income families’ neighborhood quality and their level of community trust. Agencies assisting families in crisis operate under considerable pressure not only because those families have an acute need to be housed quickly, but also because many landlords turn away assisted renters. Landlords in most states are not obligated to accept families with housing vouchers, for example, and many make inferences about the quality of tenants based on their relationships with government or nonprofit agencies (DeLuca, Garboden, and Rosenblatt Reference DeLuca, Garboden and Rosenblatt2013). A second policy implication from this study, then, has to do with expanding and enforcing source-of-income discrimination laws, which would increase the housing and neighborhood options of low-income, assisted families.
Besides renters’ motivations for moving and strategies for locating housing, the quality of their dwellings also appears to color their neighborhood perceptions. Renters who experienced more housing problems were far less likely to trust their neighbors and more likely to perceive suffering around them. As suggested earlier, a potential explanation for this finding pertains to neighborhood usage. Renters living in worse housing conditions might spend less time in their homes and more on the street than those in higher-quality housing. If this were the case, we might expect housing problems to be positively associated with indicators of neighborhood involvement or exposure. Following this line of thought, I replicated the fixed effects negative binomial regression model displayed in Table 7.2 on a new outcome: Local Assistance, a measure of how meaningfully engaged renters were with their neighbors. Respondents were asked: “While you have been living in this neighborhood, have you ever helped a neighbor (1) pay bills or buy groceries; (2) get a job; (3) fix their house or their car; (4) by supporting them emotionally, as they went through a hard time; or (5) by watching their kids?” Answers were summed to create a measure of local assistance (min = 0, max = 5). The models found that renters who experienced more housing problems reported higher levels of local assistance (b = 0.086; p < 0.001). This finding is robust to the three alternative measures of neighborhood quality discussed earlier.
Material hardship could be the underlying cause of both heightened exposure to housing problems and neighborhood engagement, relied on to make ends meet. All else equal, renters who live in disadvantaged neighborhoods report higher levels of local assistance (Desmond and An 2015). However, I observed a significant association between housing problems and neighborhood engagement net of indicators of material hardship, such as having experienced a recent job loss or breakup, as well as controls for the length of time and the number of strong ties in a community and neighborhood fixed effects. Renters who have experienced more housing problems report higher levels of neighborhood involvement, compared to similar renters in similar neighborhoods. This suggests that housing problems spur community exposure, as renters leave their homes to escape degrading conditions or to address such conditions by seeking help from neighbors.
This study’s identification strategy pertains to similar renters in similar neighborhoods having different housing-related experiences that influence how they perceive their local community. Those perceptions are steered not only by objective neighborhood disadvantage, like crime, but also by multiple housing dynamics: why city dwellers moved, how they found subsequent housing, and the conditions of their dwelling. A neighborhood’s outlook, whether it will improve or decline, depends in significant part on how its residents see it. If people see their community as a special, cherished thing, they will work to protect and improve it (Fischel, Chapter 1, this volume). However, if they fear their neighborhood or become ashamed of it, they will look for ways to leave or burrow behind locked doors, ignoring the streets around them (Rosenblatt and DeLuca Reference Rosenblatt and DeLuca2012). When neighbors work together, they can improve their community and drive down crime by establishing effective local practices or lobbying elected representatives. “Our failures with city neighborhoods are, ultimately, failures in localized self-government,” wrote Jane Jacobs. “And our successes are successes at localized self-government” (Reference Jacobs1961, 114).
A prerequisite for successful self-management is the cultivation of a palpable optimism about the capacity of the local community (McAdam Reference McAdam1982; Piven and Cloward Reference Piven and Cloward1977), a belief in and familiarity with one’s neighbors. But negative neighborhood perceptions can compromise a community’s civic efficacy and thwart community-based organizing (Desmond and Travis Reference Desmond and Travis2016; Sampson Reference Sampson2012), directly contributing to neighborhood decline through depopulation (when families move out) and disinvestment (when families withdraw from their own community). It follows, then, that those hoping to identify ways to cultivate collective efficacy and raise people’s expectations of their community should strive to apprehend why people see their neighborhood in this or that light.
The findings of this study indicate that if we wish to understand neighborhood perceptions, we have to pay attention to housing dynamics. A long-standing interest in housing discrimination and gentrification notwithstanding (Massey and Denton Reference Massey and Denton1993; South and Crowder Reference South and Crowder1997), research on neighborhood effects largely overlooks housing dynamics. Because city dwellers’ immediate environment – the house – is fundamentally linked to their broader ecological surroundings, future investigations into the role housing markets play in shaping neighborhood perceptions and local dynamics could advance urban studies in significant ways. This chapter has contributed to uniting the sociology of housing and of neighborhoods, but much work remains undone. Indeed, many chapters in this volume reflect the tendency of research on housing markets to ignore neighborhood characteristics, which in turn are critical to understanding market dynamics. For example, despite the fact that racial residential segregation directly contributed to the foreclosure crisis (Rugh and Massey Reference Rugh and Massey2010), scholarship on the crisis trains most of its attention on regulatory failures and financial instruments.
If housing and neighborhood dynamics are bound together in a tight knot, then policy interventions focused on one will likely have an effect on the other. The findings of this chapter indicate that initiatives designed to prevent eviction, for example, not only could promote family stability and well-being, but may also promote community investment since renters that select into neighborhoods under more voluntary circumstances see their communities in a more positive light. Similarly, if housing problems color renters’ perceptions of their neighborhoods, then initiatives designed to improve housing quality could benefit not just individuals but communities as well.
Negative neighborhood perceptions can thwart community cohesion, impede the formation of social capital, spur residential turnover, and invite social problems. Addressing these issues by confronting such perceptions requires understanding the factors that deeply influence how we see our communities. When it comes to promoting neighborhood trust and pride, a good place to start is the home.
Author’s Note
I thank Kathleen Cagney, Lee Anne Fennell, Benjamin Keys, and participants at the Kreisman Initiative on Housing Law and Policy, University of Chicago Law School, for critical feedback on earlier drafts. This research was supported by the John D. and Catherine T. MacArthur Foundation, through its “How Housing Matters” initiative.


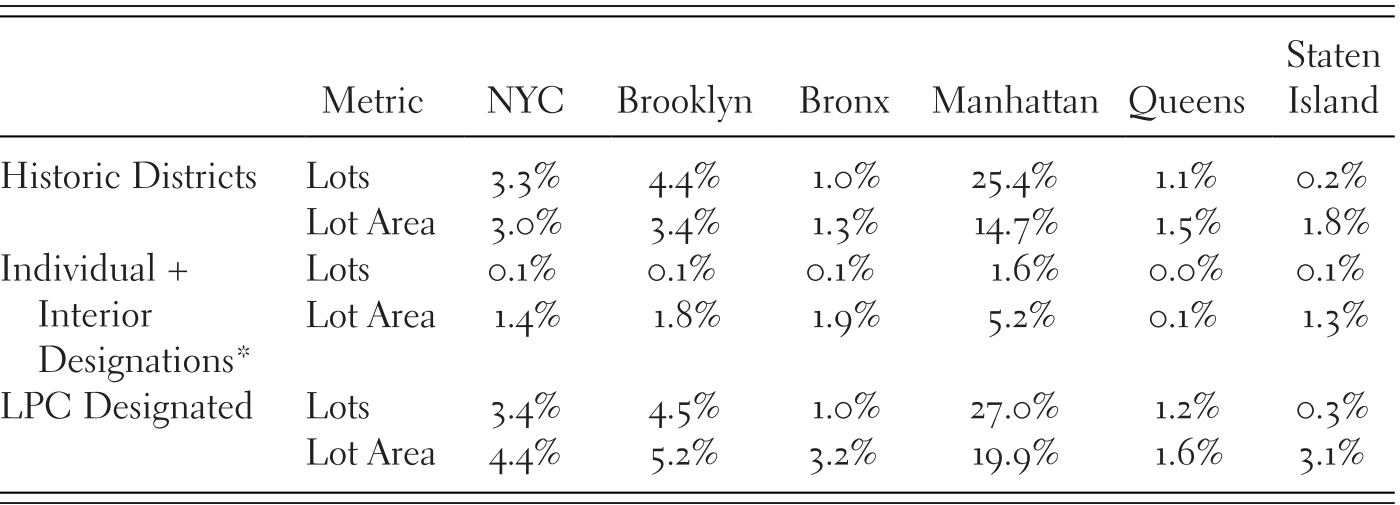
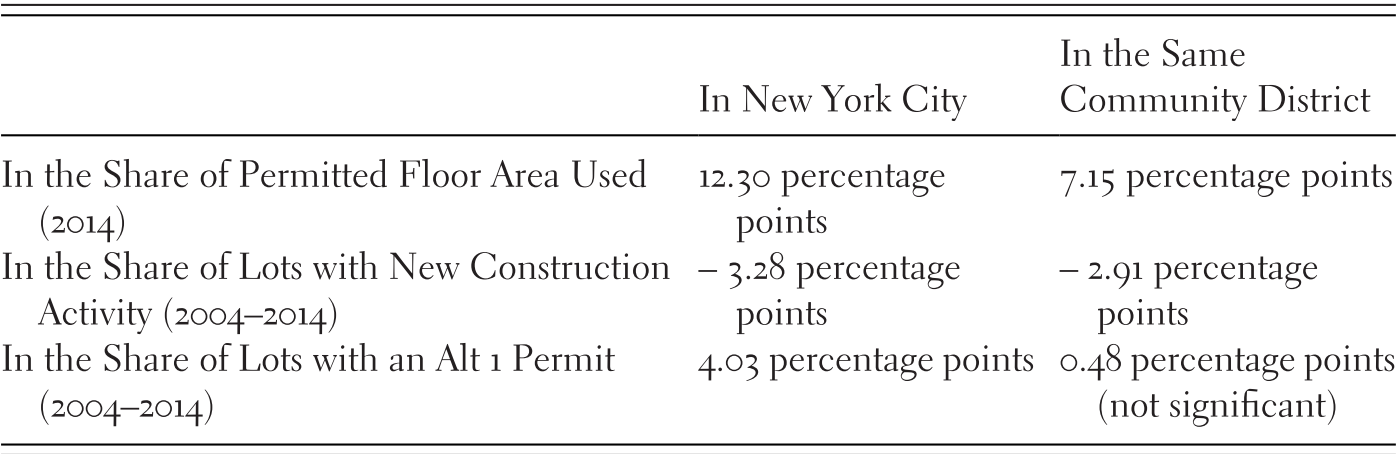
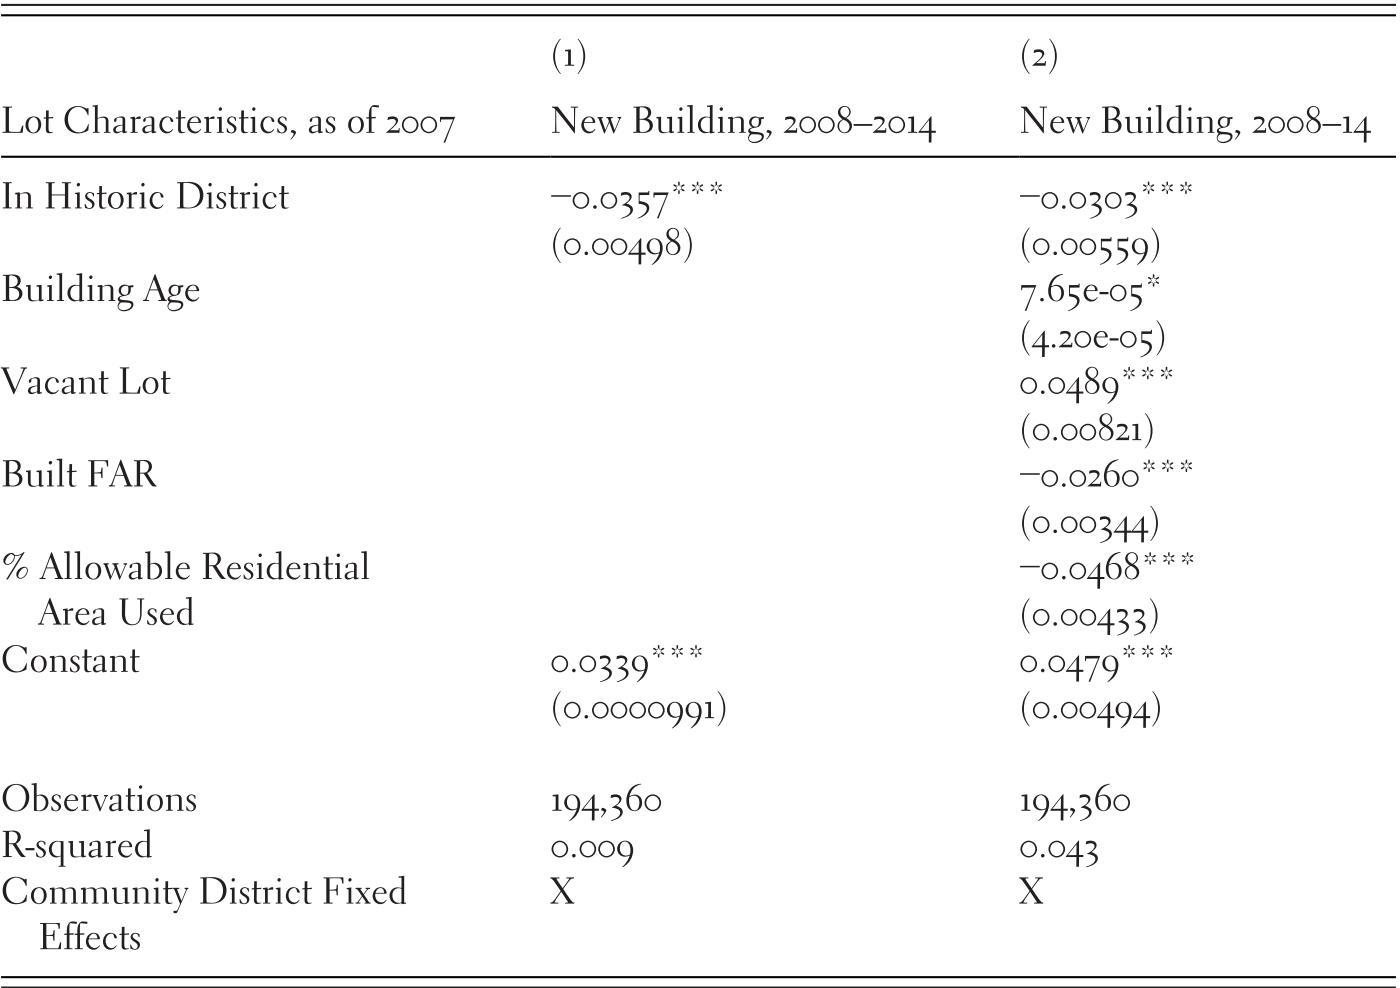


 Open access