


Introduction
An integration of scanning probe microscopy (SPM) with scanning electron microscopy (SEM) is an important step in pushing the development of characterization tools that provide more complete materials analysis. The integration of an atomic force microscope (AFM) and an SEM into a single tool has been pursued for doing correlative AFM and SEM experiments since the early 1990s [Reference Rosolen and Welland1]. With the growing importance of nanotechnology and nanofabrication, atomic force microscopy is emerging from research laboratories and becoming a useful inspection and metrology tool inside SEM/focused ion beam (FIB) instruments. Correlative investigations and correlative nanofabrication with spatial resolution at the nanoscale get the pole position of next-generation instrumentation. Moreover the growing requirements of nanotechnology make necessary the use of hybrid methods for studying the properties of materials and for nanofabrication [Reference Rangelow2].
This article describes the AFMinSEM instrument (Figure 1) from nano analytik GmbH, which is capable of providing characterization of surface topography, mechanical properties, electrical properties, and magnetic properties. This tool can support IC lab work in 3D-nanometrology, defect inspection, and nanofabrication. This brings the SEM, FIB, energy-dispersive X-ray spectrometry (EDX), and AFM techniques together in a single multipurpose workstation. To get high mechanical stability for the AFM in the SEM, the mechanical loop must be very rigid. This includes all mechanical parts related to the AFM and the SEM specimen stage.
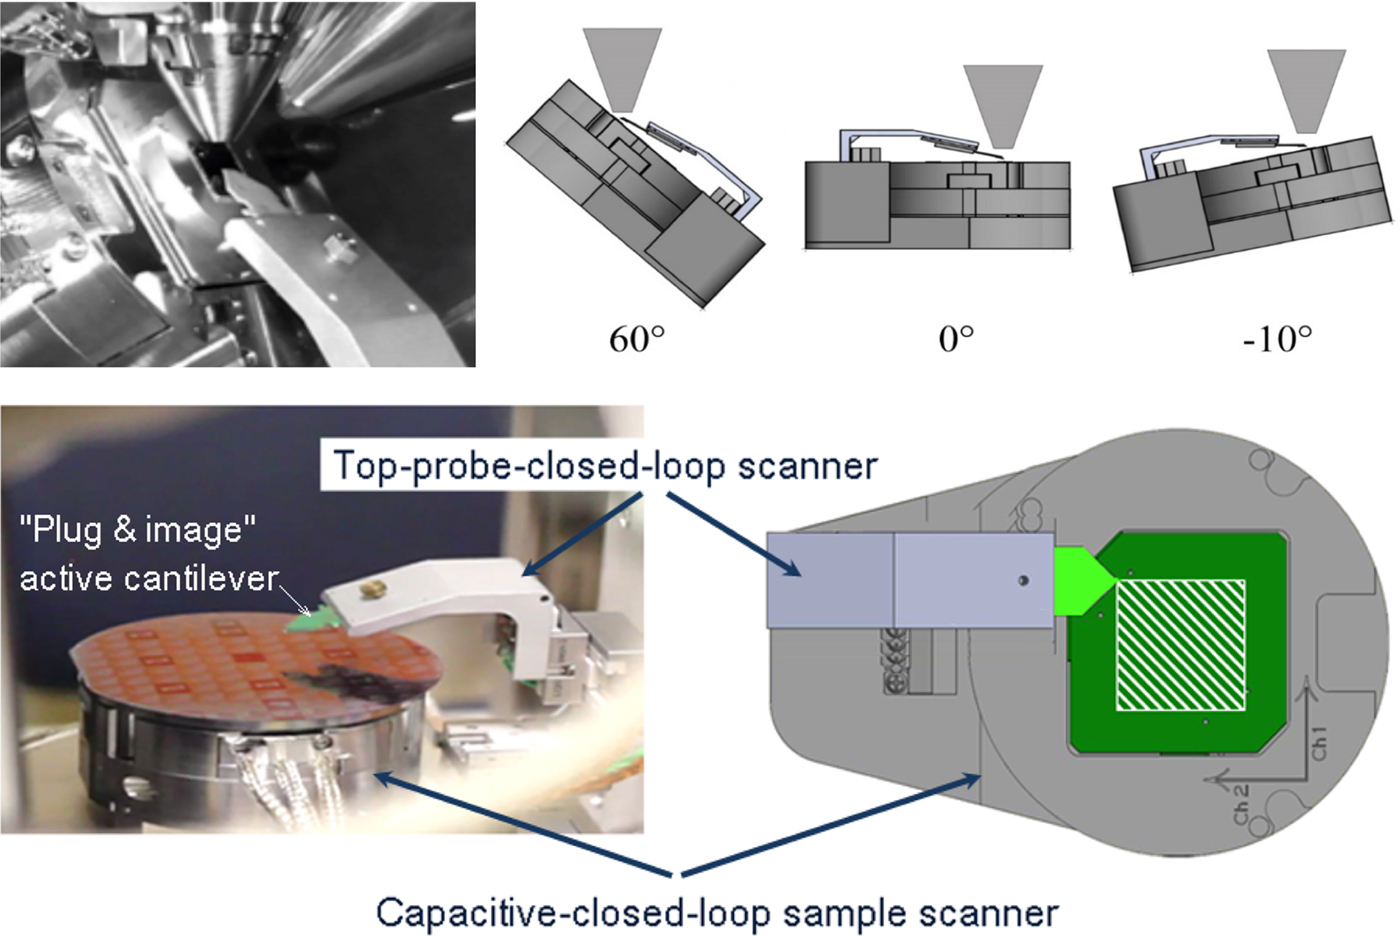
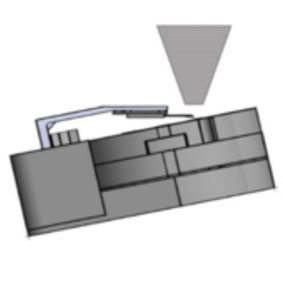
Figure 1: AFM mounted on an SEM specimen stage. (top) AFMinSEM allows tilt angles from + 60° to −10° providing imaging of the tip with the SEM during AFM operation. (bottom) Arrangement of the general setup of both the scanner and active “plug and image” cantilever. The top-probe-closed loop scanner provides motions in the field of 18 × 18 mm to locate the AFM-tip at the region of interest, which can be pre-navigated with the SEM. The optimal working distance of the SEM for simultaneous operation of both instruments is 4 mm.
One of the most beneficial outcomes of the AFMinSEM design is the improvement in spatial resolution for everyday nanoscale investigations. The SEM and the AFM complement each other. Using the SEM, the operator identifies a region of interest and then measures with the AFM in three dimensions at sub-nm-resolution. Combined with the SEM/FIB, the AFM can be used for correlative nanofabrication. The usability of these three indispensable tools is enhanced by the computer operating system. The SEM, FIB, and AFM can operate autonomously or simultaneously, and neither technique is compromised.
Materials and Methods
AFMinSEM
The tool called an atomic force microscope in the scanning electron microscope (AFMinSEM) presented in this article operates in most modes associated with AFM. An image from the AFM can be obtained in non-contact mode or contact mode. The integrated actuator on the cantilever is used to drive the cantilever in resonance as well as deflect the cantilever at lower frequencies off-resonance. For that reason, in the non-contact imaging mode it is necessary to drive the cantilever around its resonant frequency (AC voltage) with the thermo-mechanical actuator and apply a DC voltage to control the distance between cantilever and sample. When a DC voltage is applied to the thermo-mechanical actuator, the cantilever bends proportionally to the square of the applied electric power (P = V2/R). Subsequently, the cantilever bends with a change in temperature due to a difference in thermal expansion coefficient. The deflection is proportional to the temperature change T, which is proportional to the dissipated electrical power P in the thermo-mechanical actuator.
Scanning
The compact and modular AFM setup enables both probe-scanning and sample-scanning (Figure 1, top). On the SEM specimen stage the probe-closed-loop scanner allows addressing of the cantilever tip anywhere within a range of 18 × 18 × 10 mm at a precision that can approach 1 nm (Figure 1, bottom). The capacitive-closed-loop sample scanner is used for metrology purposes. One sample scanner providing qualified metrological capabilities was initially calibrated and tested by the manufacturer and yielded the following performance criteria: (i) 0.4 nm resolution in x- and y-axes and 0.2 nm in z-axis; (ii) linearity deviation < 0.01%; and (iii) repeatability < 1 nm.
Active cantilever
The implementation of a piezoresistive, thermo-mechanically transduced active cantilever offers capabilities beyond a standard AFM using optical read-out. An active cantilever allows self-measurement of its thermomechanical resonance [Reference Rangelow3,Reference Rangelow4]. In 1994 a Wheatstone bridge configuration was introduced [Reference Rangelow5] for the piezoresistive readout, and later thermomechanical actuation was implemented (Figure 2) [Reference Rangelow2,Reference Rangelow3]. The thermomechanical noise floor of the cantilevers equipped with piezoresistive Wheatstone bridge sensors was measured to be 80 fm × Hz−1/2 [Reference Rangelow2]. The direct cantilever actuation allows simple operation in dynamic imaging mode, which uses a sinusoidal voltage source applied to the thermomechanical actuator for driving the cantilever at constant amplitude and frequency. The proportional, integral, derivative (PID) controller adjusts the tip height above the surface to keep its amplitude at a constant value (amplitude set-point). An active cantilever allows self-measurement of its thermomechanical resonance.
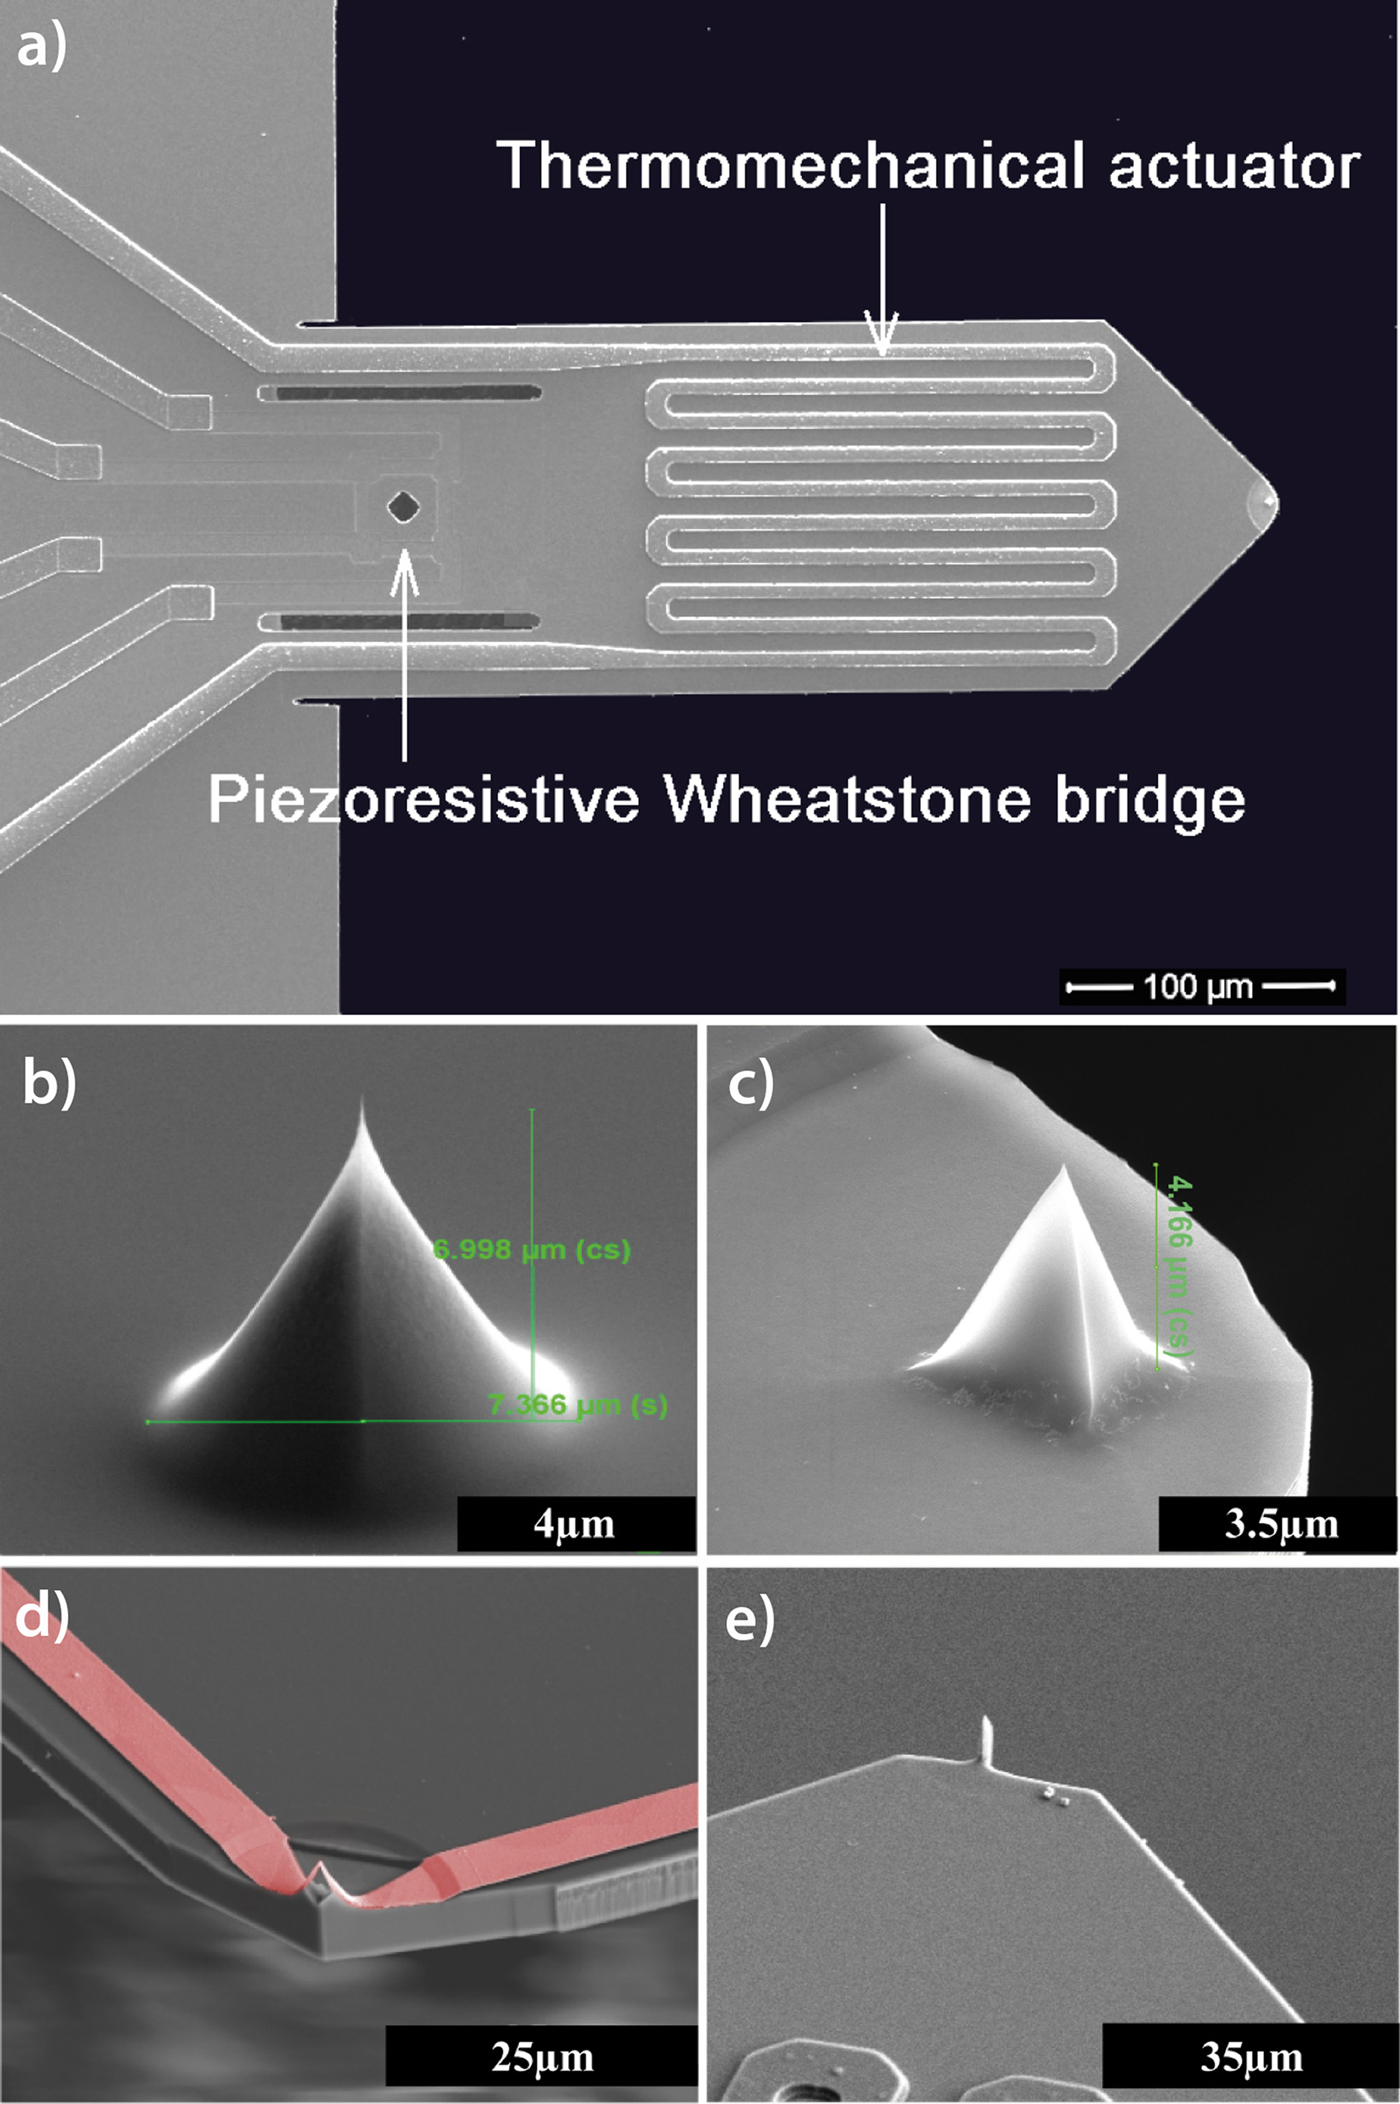
Figure 2: The nano analytik GmbH piezoresistive cantilever with integrated thermo-mechanical actuator [Reference Rangelow5], is also called an active cantilever, which can be equipped with different tips. (a) Overview of a standard active cantilever; (b) conical tip (height about 7 µm) (reproduced from T Angelov et al., J Vac Sci Technol B 34 (2016) 06KB01, with the permission of the American Vacuum Society); (c) crystallographic tip (height about 4.1µm); (d) tip with thermal-Pt bridge (height 6 µm) for thermal imaging [Reference Rangelow5]; and (e) high aspect-ratio Silicon-whisker tip (height 7 µm) for deep trench imaging.
The advancement of active cantilever development has resulted in a substantial reduction of cantilever mass, an increase in the resonance frequency (fc), and an improvement in the spring constant (kc) ratio [Reference Rangelow2]. This allows a significant increase of the scanning speed. The main benefit of the thermomechanical actuation, in addition to excitation of the cantilever at its resonance, is the capability of deflecting the cantilever at lower frequencies off-resonance (1 Hz–10 kHz). When a DC voltage is applied to the actuator, the cantilever bends proportionally to the square of the flowing current [Reference Pedrak6]. In this manner, the z-displacement can be by the cantilever itself. This scheme has been used successfully in the realization of parallel cantilever arrays capable of imaging large wafer fields at high speed [7,Reference Hofmann12].
The integrated AFMinSEM can routinely image atomic steps in molybdenum disulfide (MoS2) with interaction forces in the pN range, preventing damage to the material. Figure 3 shows a result of single-layer MoS2 regions imaged by both SEM and the integrated AFM. This figure indicates the advantage of measuring step height via the AFM.
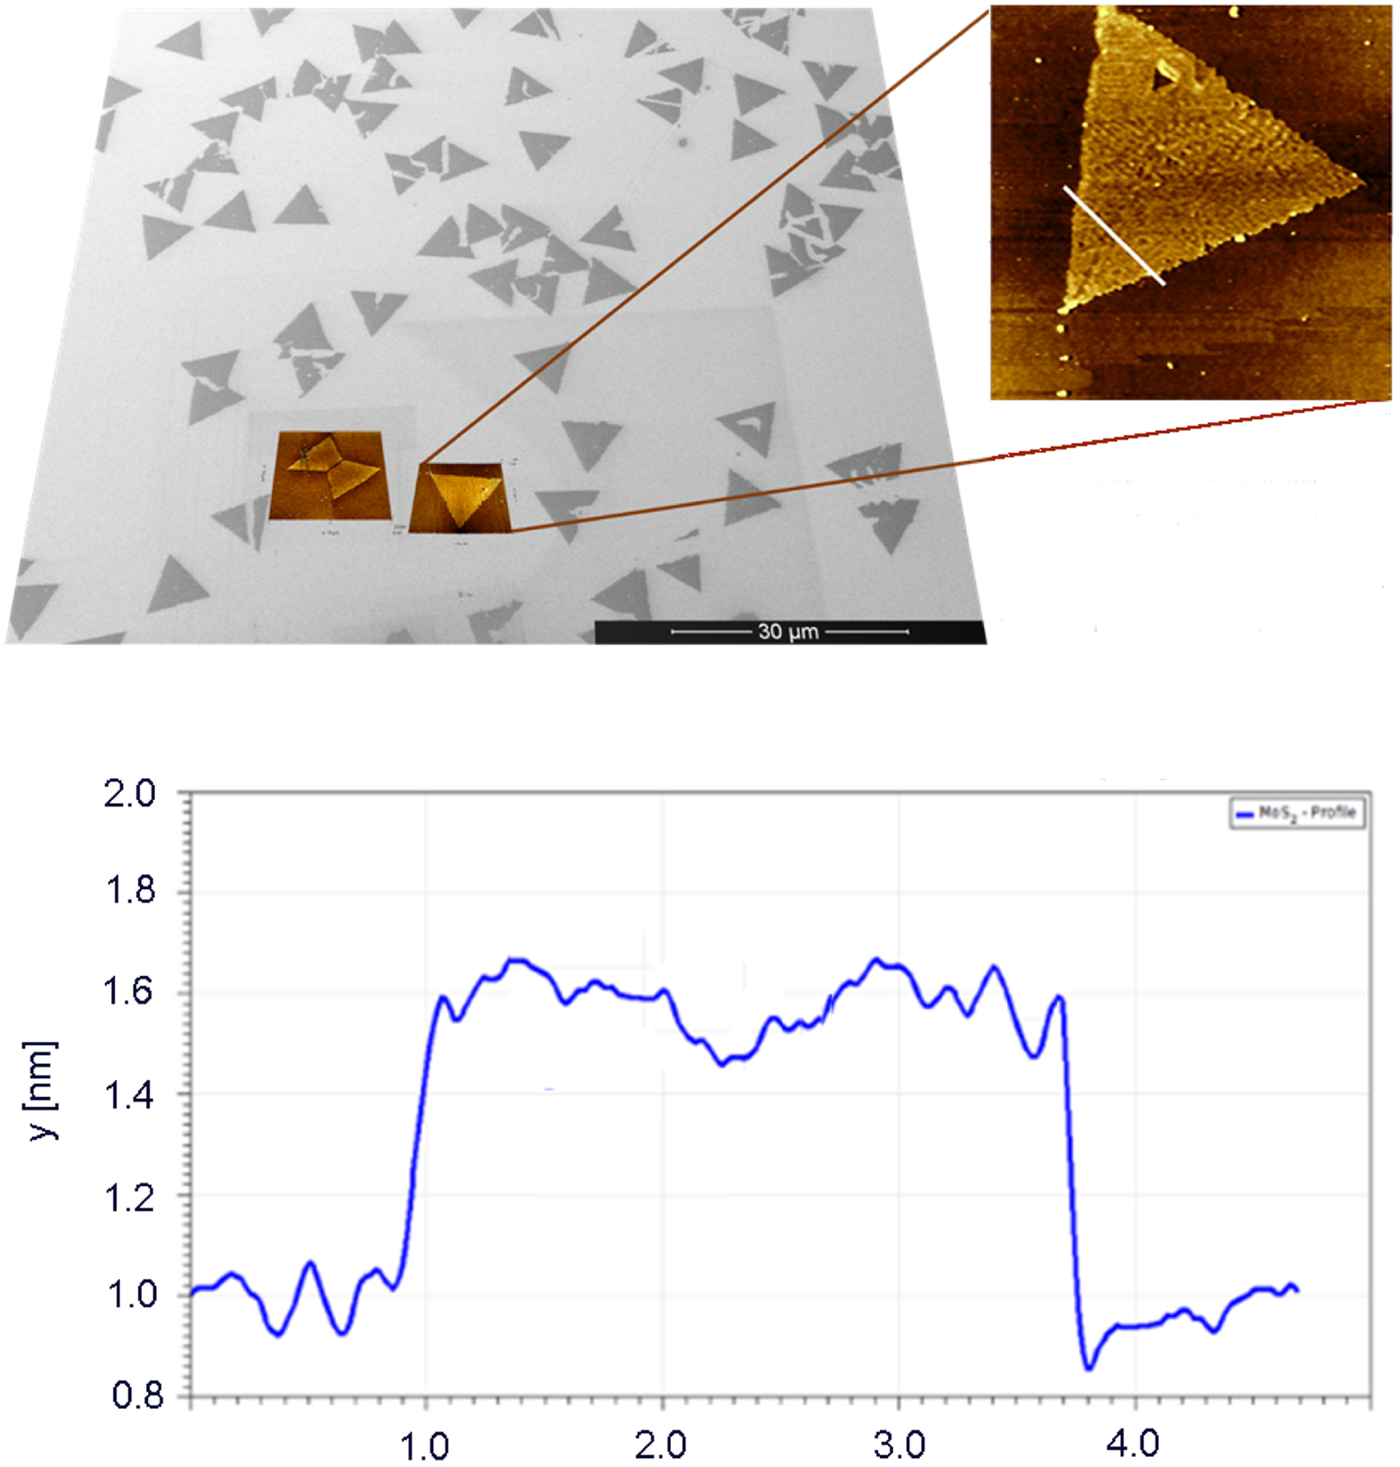
Figure 3: Height measurements. (top) Non-contact AFM image within an SEM image of a single layer of the molybdenum disulfide (MoS2) flex. Inset AFM image width = 10 µm. (bottom) Step height of the flex is 0.6 nm.
Today, micro-electro-mechanical-systems (MEMS) technology can produce active probes with sub-10 nm tip radius and with tips that are sharper than the imaged surface features, which leads to a surface profile with the correct shape. Moreover, the tip can be functionalized, allowing it to detect different interactions or modify the surface. Different tips integrated with the active cantilever make possible not only imaging in contact or non-contact modes, but they also allow current-AFM, magnetic force microscopy, Kelvin-probe microscopy, scanning thermal microscopy, electron field-emission lithography, tip-based electron beam induced deposition (TB-EBID), and nano-indentation or nano-milling integrating sharp diamond tips [Reference Rangelow8,Reference Hofmann12].
Topography
One advantage of integration of AFM into the SEM is the precise measurement of the height or depth of features (Figure 4). For that purpose we use a high-aspect-ratio (HAR) silicon whisker tip formed at room temperature and sharpened with FIB [Reference Hofmann12]. This technique is compatible with CMOS/MEMS technology, which is routinely used for the fabrication of the SPM probes. Atomic force microscopy measurements with such HAR-tips also provide a useful trench depth value. Metrology with the nanometer-level height resolution of the AFM technique on silicon has been confirmed by SEM-cross-section measurements. Figure 4 shows the ability of amplitude-modulation AFM to reproduce the actual topography of nanoscale trenches, particularly those with high aspect ratios. The depth value is obtained in non-contact (or so-called AC-mode) imaging; the cantilever is driven to oscillate by resistive heating of the thermomechanical actuator at the resonant frequency. The amplitude of oscillation can be adjusted by the magnitude of the actuator voltage. Generally, the free amplitude ranges from 1 to 5 nm. To get better height resolution, a stiff cantilever is used, and the oscillation amplitude is very small (peak-to-peak amplitude of 2 nm). When the cantilever-tip starts approaching the surface, the cantilever oscillation is constant at its undamped amplitude and is measured. As the cantilever-tip reaches the surface, the cantilever oscillation becomes damped. The tip position at which damping occurs is controlled by the set-point of the feedback and determined by the magnitude of cantilever oscillation. Even though the vacuum in the SEM chamber is quite good, there is always a thin layer of water and hydrocarbons (contamination layer). The cantilever-tip is scanned across the surface inside the contamination layer, and high-resolution images can be obtained in this regime.
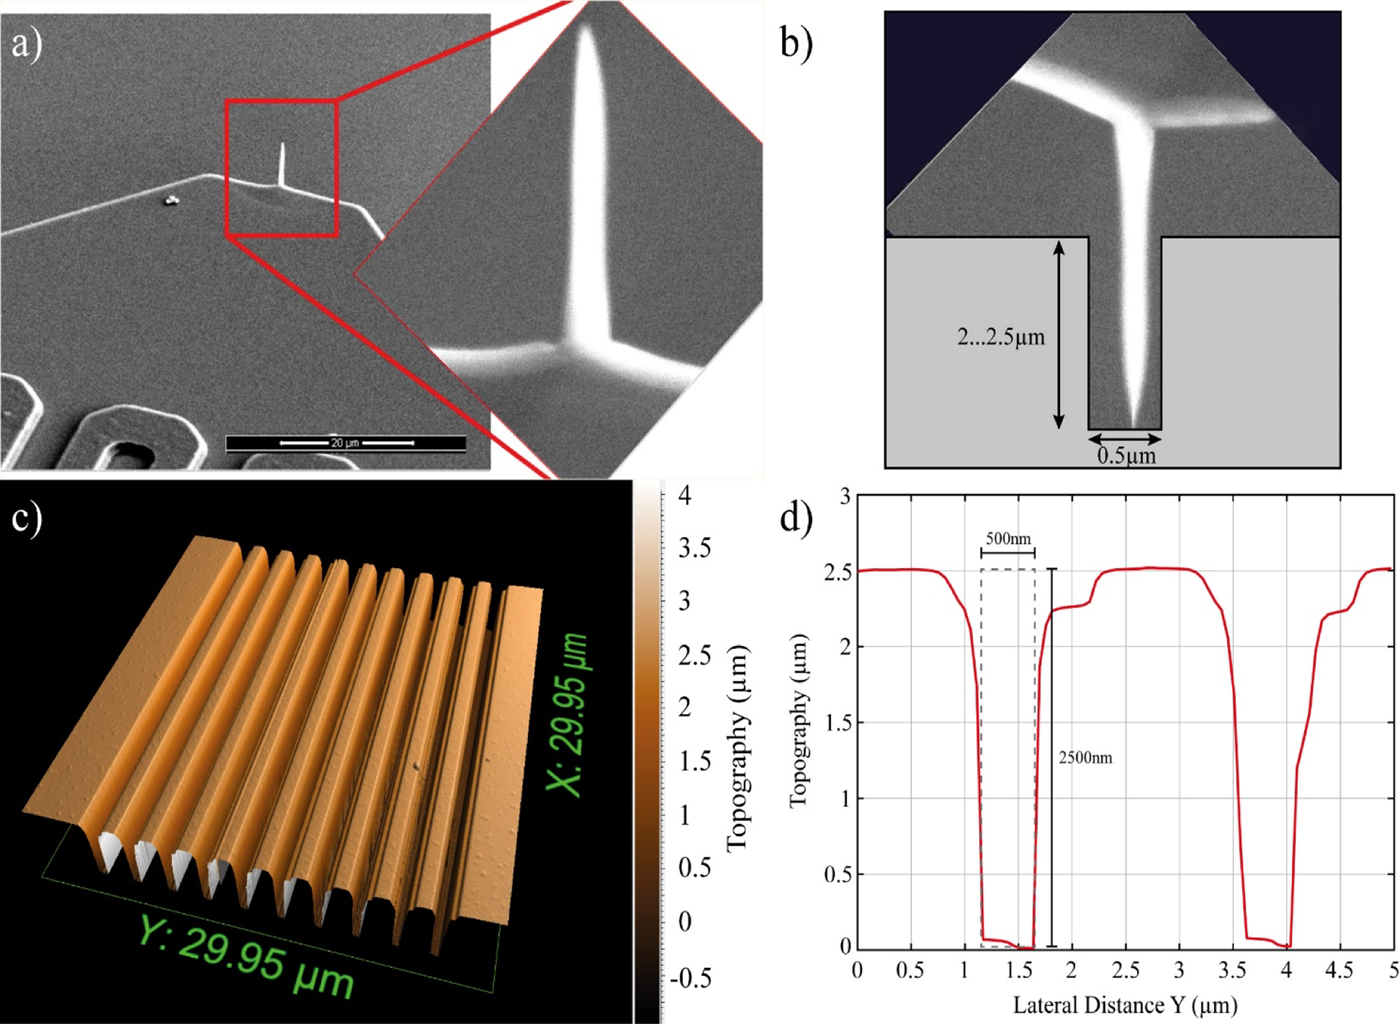
Figure 4: Deep trench imaging. (a) SEM image of high-aspect ratio tip integrated onto an active cantilever. (b) Sketch showing the penetration of the silicon-tip into a trench with 4:1 aspect ratio. The cantilever moves from left to right. (c) Amplitude modulation-AFM image and cross-section plot of the trenches. (d) AFM measured trench with 5:1 aspect ratio.
Precision measurements of surface topography are a strength of AFM, and this remains true when active cantilever technology is employed. Figure 5 shows a topographical image where heights on a polymer membrane appear about 200 nm with a precision of about ± 100 nm.
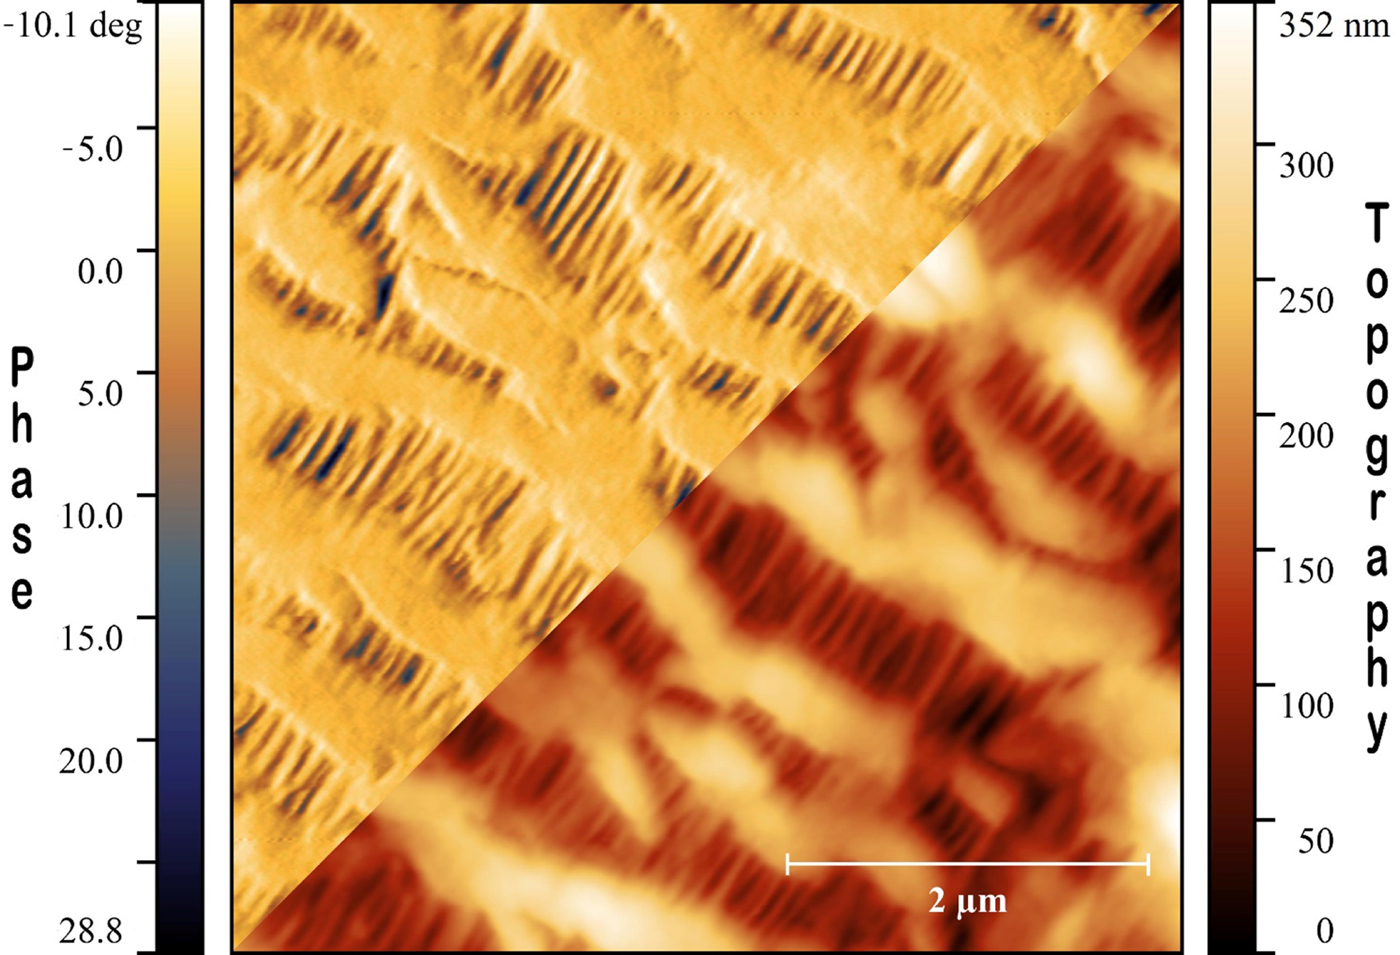
Figure 5: Performance of active cantilever technology. Topography and phase AFM image of Celgard® polypropylene battery separator membrane. The AFM reveals the topography of the polymer membrane material, which can be measured with the scale at the right.
Correlative microscopy
To obtain complete characterization of a material, blends of techniques and instruments should be used in a correlative fashion. The AFMinSEM offers various opportunities for correlative microscopy. The integration of SEM, EDX, and AFM make it possible to extend the analytical capabilities. The SEM offers high resolution, a large field of view, and high depth of field; but precise 3D information is challenging.
Figure 6 shows a set of correlative microscopy images obtained with an AFMinSEM of the 22.2 nm thick SiO2 structures fabricated with ZEP520 resist on Si. The SEM image and the X-ray maps give information about the chemical composition of the sample. The 2D, 3D-AFM, and phase images provide feature shapes and dimensions. The thickness of the features is obtained with atomic resolution because the z-actuator has been calibrated on highly oriented pyrolytic graphite (HOPG) during the same measurements [Reference Rangelow4].
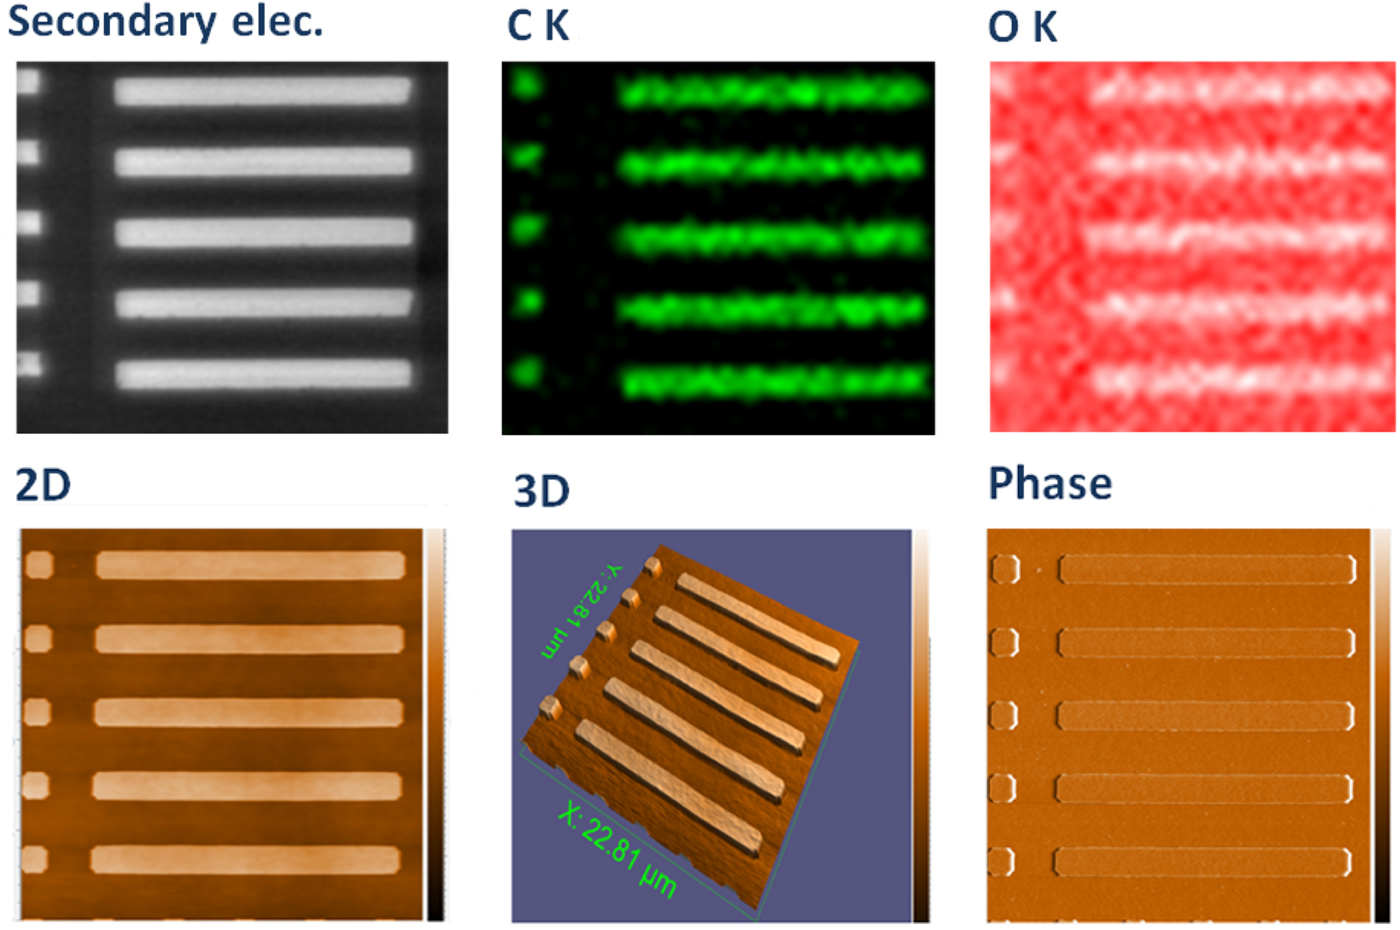
Figure 6: Correlative microscopy images from the AFMinSEM of 22.2 nm thick SiO2 features etched with ZEP520 resist. Upper line of SEM and X-ray images provide information on the chemical composition of the sample (carbon and oxygen elemental maps). Bottom line shows images of 2D-AFM, 3D-AFM, and Phase-AFM of the same features. Adapted from IW Rangelow et al., J Vac Sci Technol B 36 (2018) 06J102, doi: 10.1116/1.5048524, with the permission of the American Vacuum Society.
Property measurements
The AFMinSEM is capable of measuring various properties of materials. One of these is the measurement of the hardness and elastic modulus of thin films and soft materials. For this type of measurement the SEM is used only to guide the AFM probe to the area of interest. A diamond AFM tip may be employed as an indenter, and its penetration can be measured by the same diamond tip. To determine a material parameter of interest, like the Young's modulus, we used the Hertz [Reference Hertz9–Reference Jee and Lee11] model and consider the AFM tip as an indenter. Young's modulus can be calculated by transforming force–displacement curves into force–indentation curves, which are fitted with the Hertz model.
Nano-milling
The diamond tip of an active cantilever also can be employed as a nano-milling tool for fabricating various nanostructures. Nano-milling by an active cantilever equipped with a single-crystal diamond tip is a simple technique combining AFM-based metrology and mechanical removal of material (Figure 7). The integrated piezoresistive read-out and known stiffness of the cantilever were used in a closed loop for the determination of the load force.
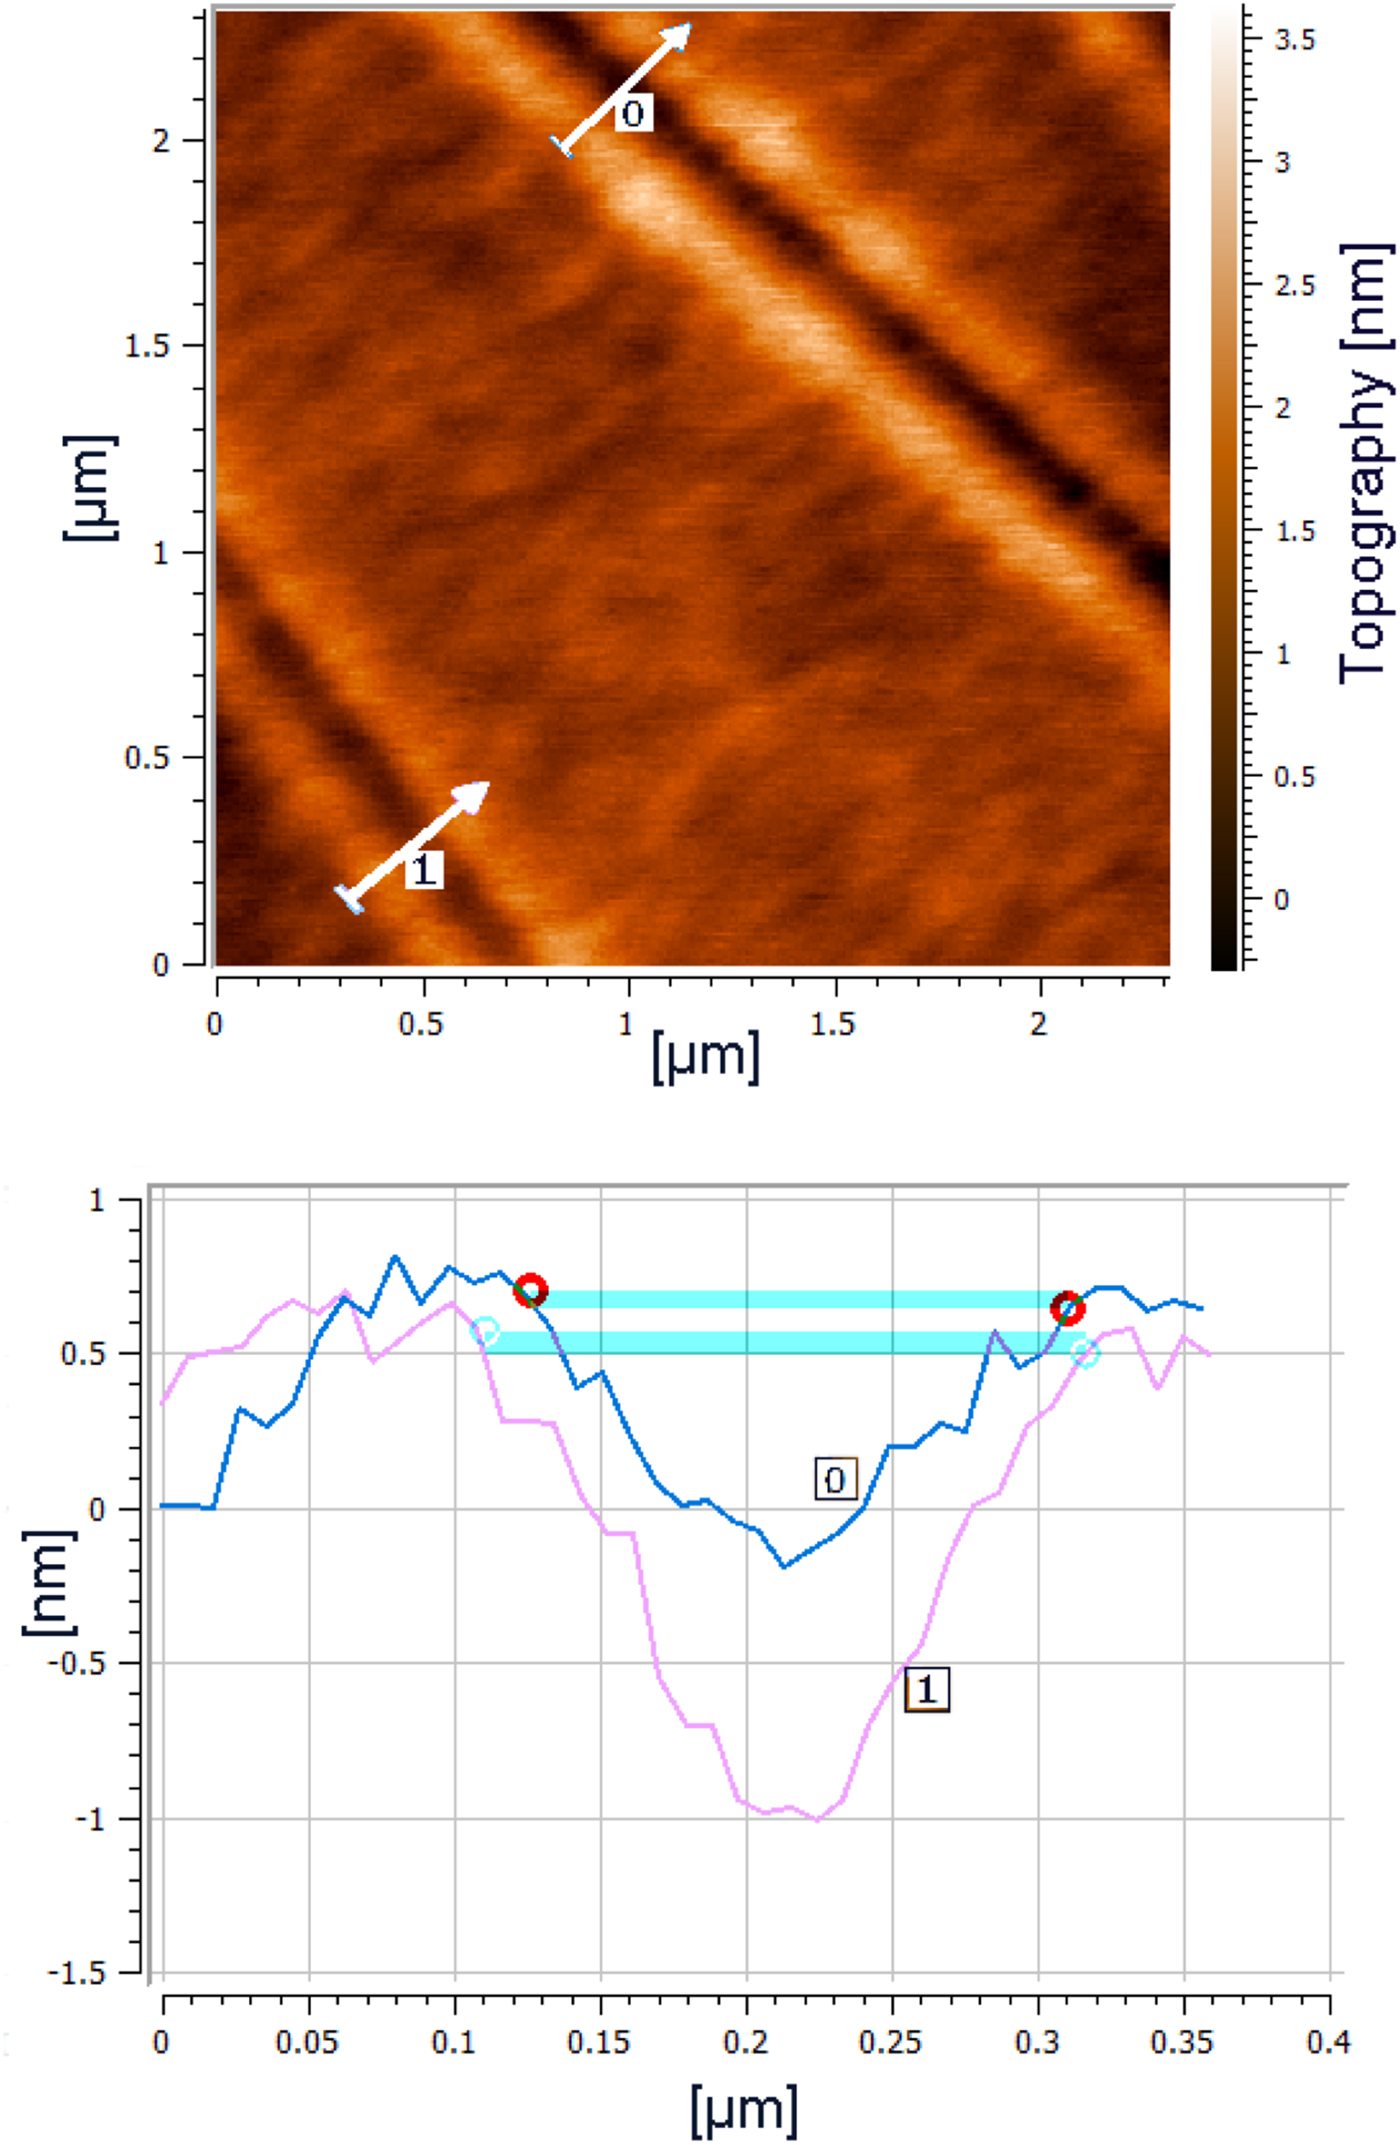
Figure 7: Nano-milling. Original uncorrected topographic image (top) and the resulting depth profiles of AFM diamond-tip-based mechanical nano-milling (bottom). The 180 nm and 210 nm wide groves were milled in an 80-nanometer-thick chromium film deposited on quartz with a normal load of 82 μN and 180 μN. The AFM-image was obtained with the same diamond tip (in non-contact mode) that created the grooves. Image width = 2.3 µm.
Field emission scanning probe lithography
The AFMinSEM may also be used for field emission scanning probe lithography (FE-SPL). This mode of operation is based on the exposure of electron-sensitive materials to low-energy electrons field-emitted from an ultra-sharp diamond tip or tip array placed in close proximity to a resist-covered specimen. The output of this method is AFM imaging and lithography. The FE-SPL method has substantial gains over traditional e-beam lithography including: (a) closed-loop operation, (b) improved lateral resolution, (c) lower implementation cost, (d) ambient or vacuum operation, (e) delivery of exposure electrons without optics requiring optimization, (f) high overlay and stitching accuracy, and (g) the ability to “write and read” with the same probe in a non-destructive manner. The operation scenario of FE-SPL is based on a vector scan scheme where the SPL tip is addressed directly to the areas to be exposed. The FE-SPL mode of operation is a high-resolution technique and, according to Tennant's law [Reference Donald and Timp13], has relatively low throughput. To enhance the throughput, a mix-and-match lithographic approach has been introduced [Reference Rangelow4]. The dynamic switching between SPL and AFM using the same diamond tip probe [Reference Hofmann12] has the advantage of overlaying the high-resolution pattern with sub-3 nm overlay accuracy [Reference Rangelow3]. The electron field emission current from the AFM tip is controlled with a current feedback loop, which consists of a two-stage high-precision current-to-voltage (IV)-converter. The preamplifier is characterized by a transfer function of 5 V/nA and 0.07 pA noise level at 1.5 kHz bandwidth. Figure 8 shows an exposure of a 20 nm thick calixarene resist with 40 V electrons to a dose of 25 nC/cm.
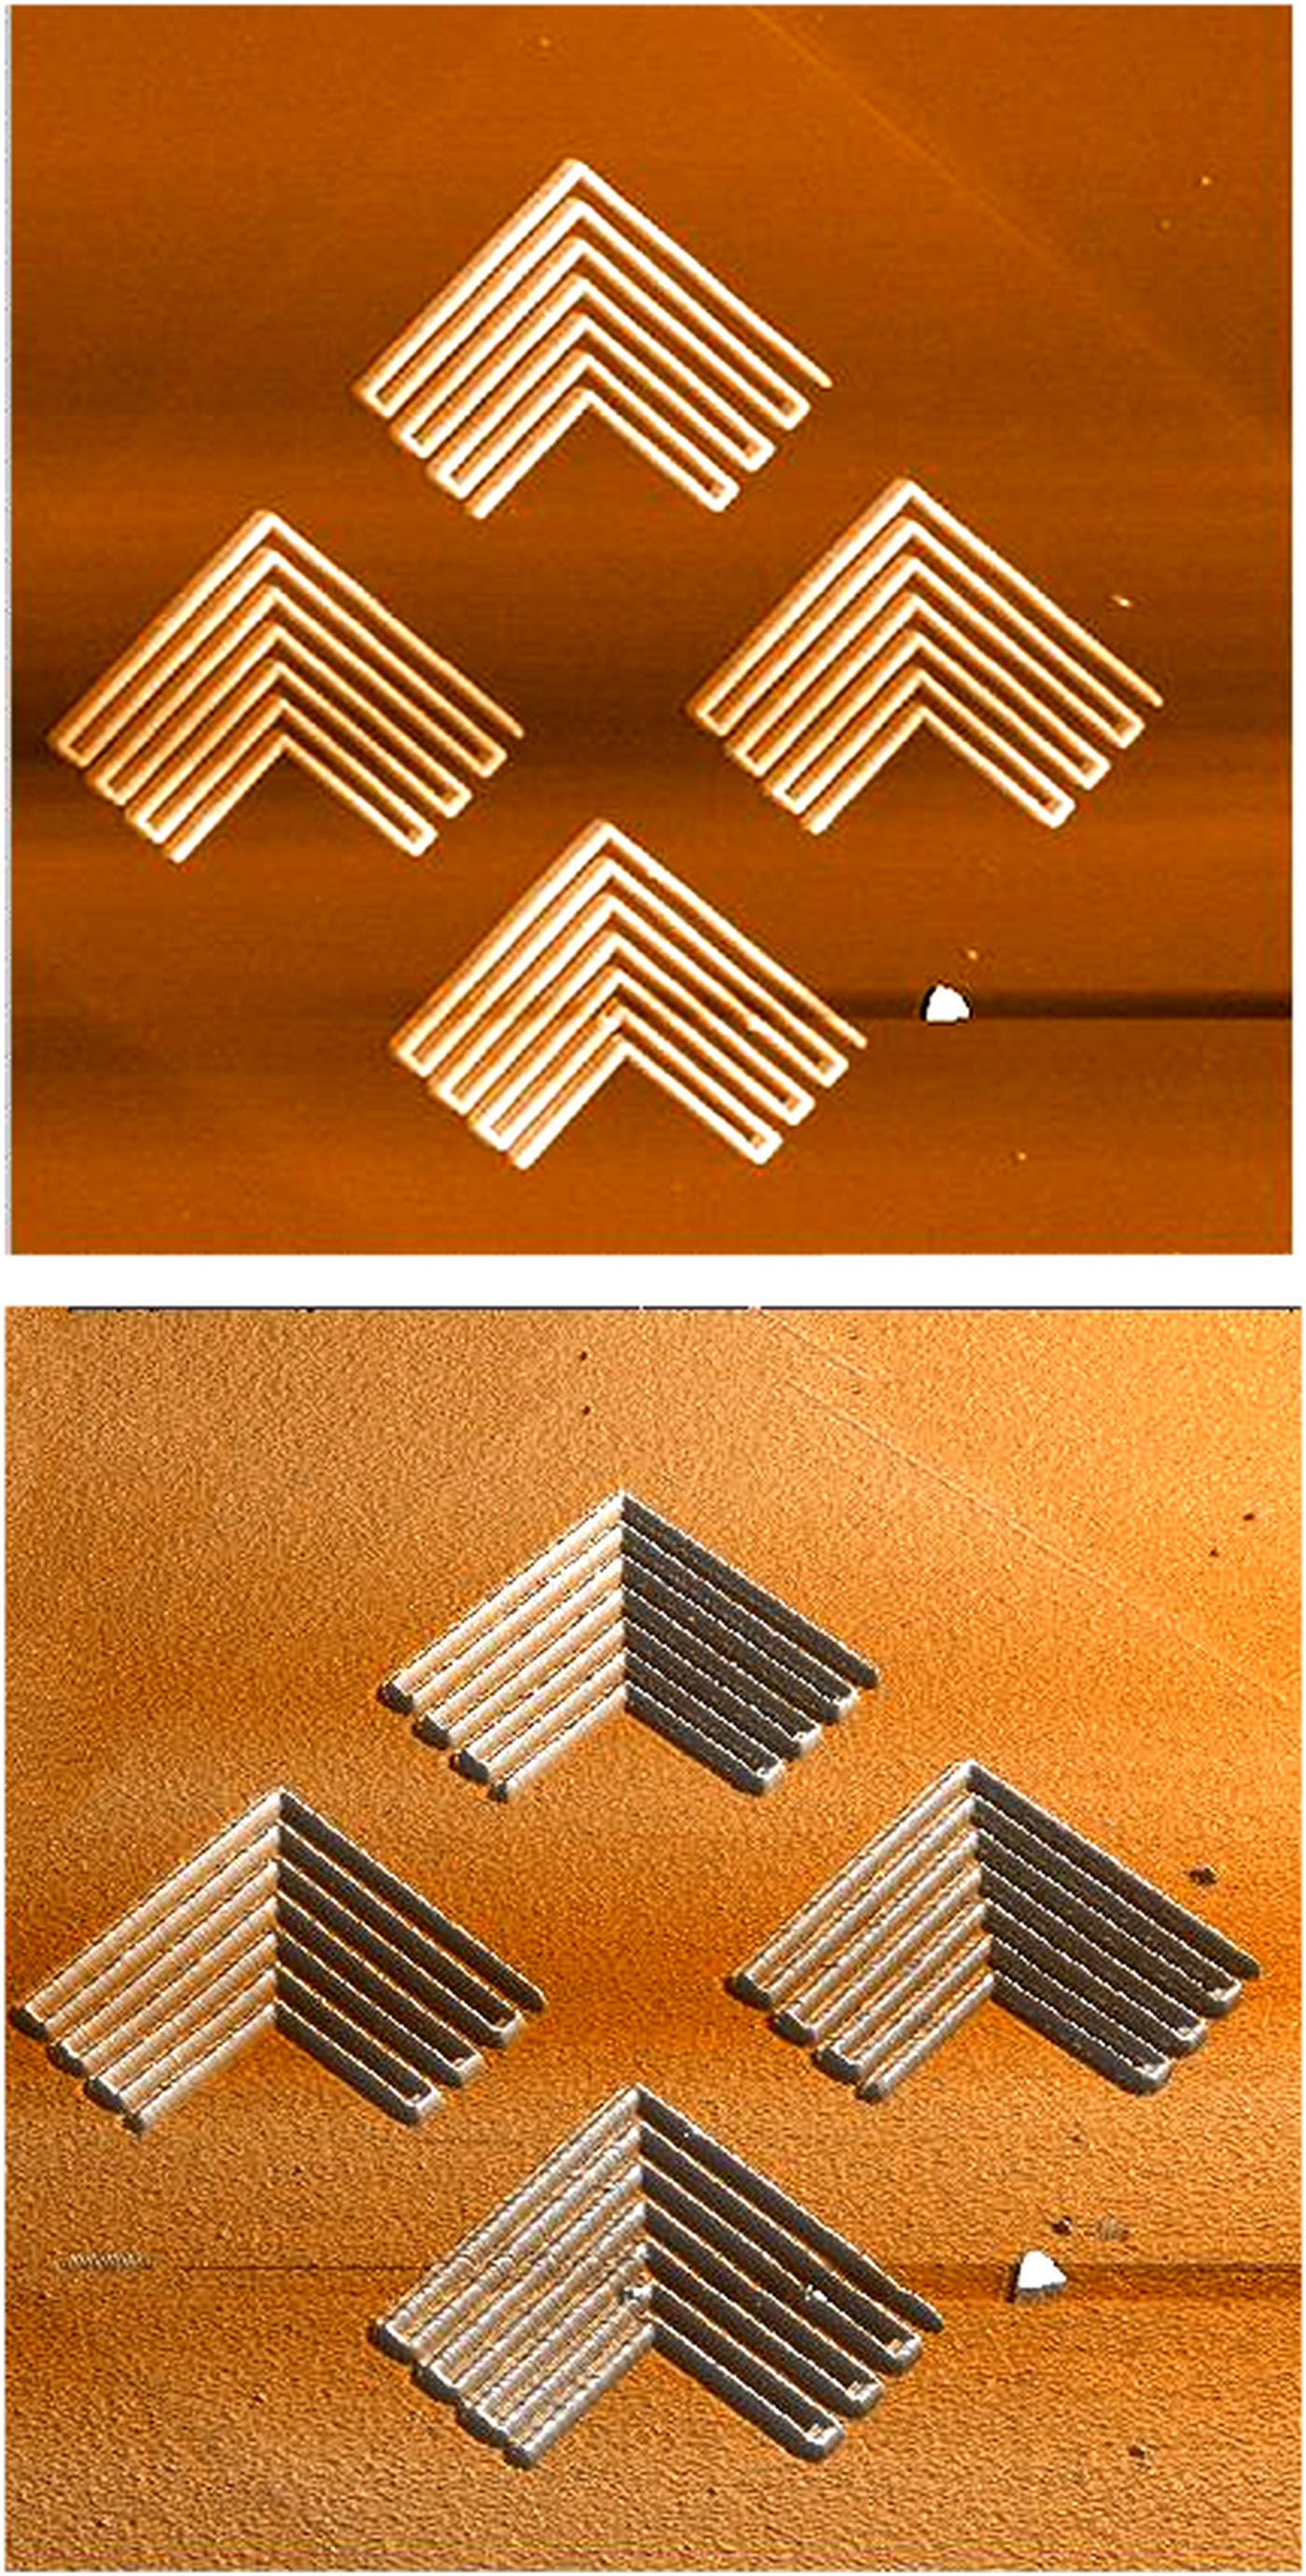
Figure 8: Lithography. (top) AFM image of “latent” features after exposure in a resist with the AFMinSEM and (bottom) after development in xylene. The workpiece was inspected and measured by switching the AFMinSEM from FE-SPL to AFM non-contact imaging mode [Reference Villarubia10]. Image width = 12.9 µm.
Tip-based electron beam induced deposition
The AFMinSEM can be used for tip-based electron beam induced deposition (TB-EBID) by again using field-emitted low-energy electrons (< 50 eV) from the tip of the AFMinSEM. In conventional SEM-based EBID, higher-energy electron beams (above 100 eV) interact with the substrate and generate backscattered electrons and low-energy secondary electrons. With AFMinSEM TB-EBID, the electrons emitted from the tip have less than 50 eV and thus create more localized dissociation reactions. The deposits are created much closer to the probe for higher-resolution EBID (Figure 9) [Reference Kaestner14].
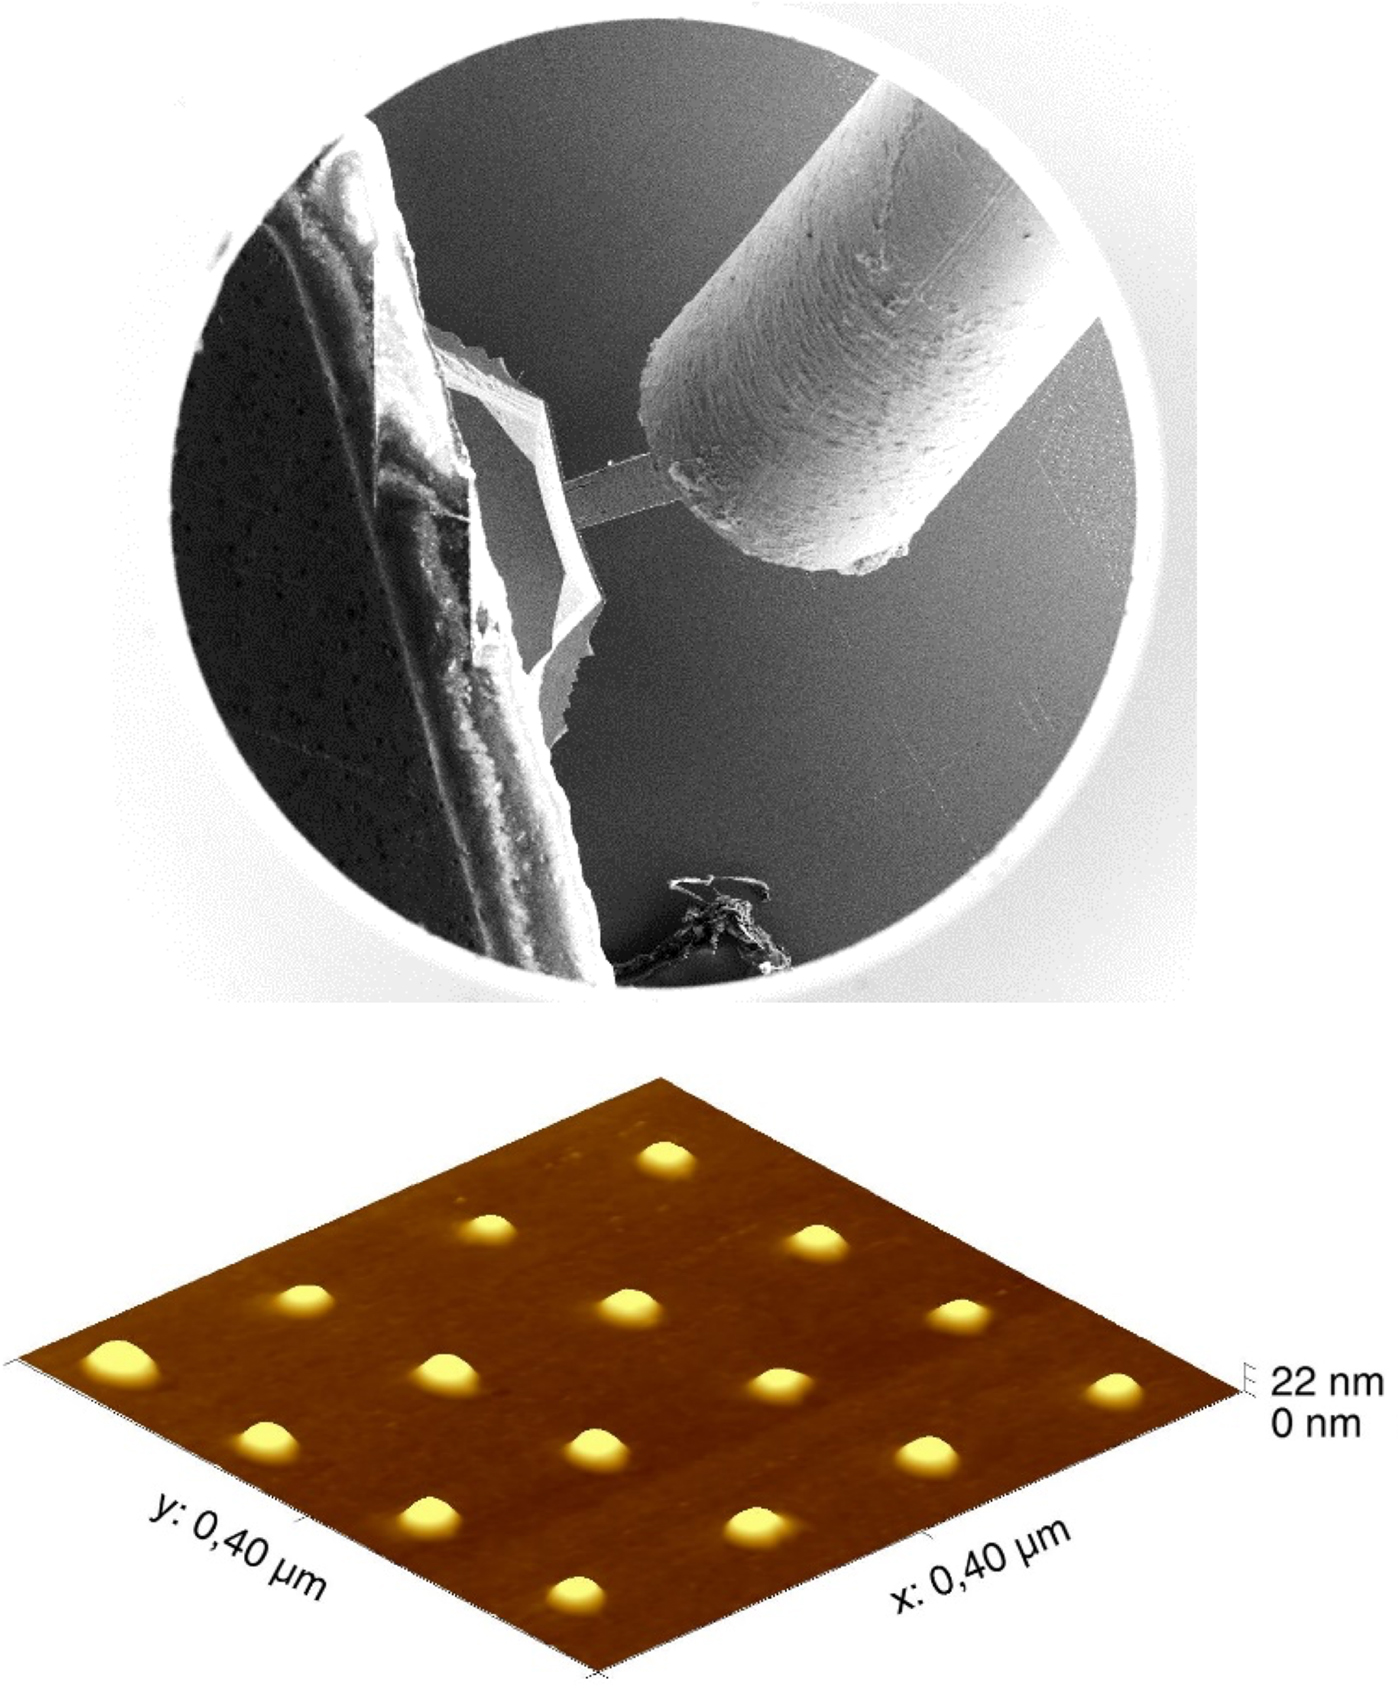
Figure 9: Deposition. Generation of sub-10 nm features using field-emitted low-energy electrons (less than 50 eV) in tip-based electron beam induced deposition (TB-EBID). (top) View of the AFMinSEM gas injector setup of trimethyl (methylcyclopentadienyl) platinum. (bottom) 3D-AFM image of Pt dots obtained immediately after TB-EBID deposition using the same tip. The diameter of smallest dot is 20 nm.
Discussion
The advantages of AFMinSEM have been described above. Looking to the future, direct integration of readout and actuation onto the cantilever is essential for further downscaling of the probe. In this context, self-sensing probes have the potential to replace the bulky and heavy optical read-out setup. All known AFM modes are possible with the AFMinSEM. The AFM also can be integrated with an environmental SEM and without any operational restrictions. The versatility presented here makes active cantilever technology a good choice for precise metrology and nanofabrication in an AFM-SEM combined instrument. This could be the first step in realization of a nano-lab in the SEM [15].
Further potential applications of the AFMinSEM include the characterization of wafers, for example after chemical-mechanical polishing (CMP) of damascene-patterned Cu. This polishing is the key step in patterning the copper interconnection layer. Plasma-based reactive ion etching process cannot etch the copper material. The performance of the Cu polishing process can be investigated by examining surface roughness, after Cu dishing and oxide erosion, using the AFMinSEM, which also provides 3D images at the nano-scale. [Reference Neirynck16].
A major benefit of the AFMinSEM is simultaneous surface characterization and cost-effective nano-manufacturing. One challenge remains: the throughput of AFM imaging of large samples, which is relevant for industrial productivity (high scan speed). The integration of thermomechanical actuation along with piezoresistive readout opens the possibility of increasing surface metrology throughput. Active cantilevers are strong candidates for operating in arrays for the realization of tools capable of cost-effective imaging of large substrates [Reference Holz17].
Conclusion
The AFMinSEM instrument from nano analytik GmbH provides new capabilities in analysis and fabrication at the nanoscale. The instrument can be integrated into any SEM, is highly customizable, and can be configured for each specific application. Several modes of operation take advantage of active cantilever operation. Piezoresistive cantilevers produced by microelectro-mechanical systems (MEMS) technology enable direct quantitative force and beam-deflection measurements.


