


Poor diets account for 10 % of the global burden of disease( Reference Forouzanfar, Alexander and Anderson 1 ). Adolescence represents a time when dietary intakes are at their worst( Reference Bates, Cox and Nicholson 2 , Reference Llauradó, Albar and Giralt 3 ) and a trajectory is set for inadequate dietary intake in adulthood. Interventions to improve diet and reduce the burden of disease are urgently required. In the UK, adolescents’ diet is not optimal and according to the most recent National Diet and Nutrition Survey (NDNS), their intakes of saturated fats and added sugars are excessive( Reference Bates, Cox and Nicholson 4 ). A few policies in the UK have tried to improve adolescents’ food consumption, such as the implementation of school food standards to improve school meals( Reference Adamson, Spence and Reed 5 ). Consumption of energy-dense nutrient-poor foods at this age is an issue of public health concern and comprises one of the key strategies to prevent childhood obesity(6).
Core foods provide the body with all the essential nutrients required for health and should form the basis of everyday diet, whereas non-core or discretionary foods are surplus to requirements and should have limited consumption. In the UK, non-core foods like regular soft drinks, crisps and savoury snacks, chips and potato products, chocolate and biscuits make up 40 % of adolescents’ total energy intake (EI)( Reference Toumpakari, Haase and Johnson 7 ), vastly exceeding recommendations( Reference Public Health England 8 , 9 ).
Understanding the context of non-core energy consumption, in terms of where and with whom adolescents eat non-core foods, could help identify high-risk environments where interventions can be focused. In descriptive analyses we have shown that a greater proportion of energy eaten in eateries or with friends is non-core, thus these contexts may represent high-risk environments for eating surplus to requirements( Reference Toumpakari, Haase and Johnson 7 ). However, these analyses did not consider the interrelationships between characteristics of eating contexts; for example, eating occasions (EO) with parents are more likely to be an evening meal( Reference Briggs and Lake 10 ). Furthermore, potential confounding by individual adolescent characteristics, such as age, sex or socio-economic status (SES), could explain associations( Reference Story, Neumark-Sztainer and French 11 ). It is unclear if greater non-core food intake occurs in eateries and with friends because of those physical and social contexts per se or because the type of people who eat in those contexts more often generally eat more non-core foods.
A way to overcome this is the use of ecological momentary assessment (EMA), i.e. collecting real-time information on people’s behaviours in natural environments, which has had limited application in nutritional research( Reference Mak, Prynne and Cole 12 ). EMA can be combined with dietary assessment using multiday diet diaries, which offer data on many EO in multiple different contexts for the same person. This will allow associations of specific contexts with non-core food intake to be estimated within-person while holding variation in individual characteristics constant. Multilevel modelling (MLM) can partition variation in the amount of non-core food eaten in an EO to within- and between-person sources to explore the relative contribution of the individual characteristics v. the environment.
A couple of analyses have explored the association of eating context with food intake by accounting for within- and between-person variation or the use of EMA( Reference Mak, Prynne and Cole 12 , Reference Liu, Han and Cohen 13 ). Both these studies highlighted specific environments that could benefit from the provision of healthier food choices to improve children’s and adults’ food intake, suggesting similar environmental targets could be identified to reduce adolescents’ non-core food consumption, but to our knowledge no studies in adolescents have yet been conducted.
We aimed to determine the independent relationship between specific eating contexts and non-core energy consumption in an EO, by focusing on variation in the characteristics of different EO within adolescents while holding between-adolescent variation constant.
Methods
Study sample
Dietary data were used from 884 adolescents aged 11–18 years old from Years 1–4 (2008/09–2011/12) of the UK NDNS rolling programme. Details about the design of NDNS can be found elsewhere( Reference Bates, Cox and Nicholson 4 ); relevant details to the current analysis are described below. The NDNS was conducted according to the Declaration of Helsinki and was approved by the Oxfordshire A Research Ethics Committee( Reference Bates, Cox and Nicholson 4 ). Data for the present analysis were downloaded from the UK data archive( 14 ).
Dietary data
Participants completed a 4d food diary recording details of all EO including foods and drinks consumed, while a form of EMA was used to collect information on ‘where’ and ‘with whom’ the EO occurred. Further description about the dietary assessment can be found elsewhere( Reference Lennox, Fitt and Whitton 15 ). Foods and food groups( Reference Bates, Lennox and Prentice 16 ) were classified as non-core using specific fat and sugar cut-off points per 100 g of food( Reference Kellet, Smith and Schmerlaib 17 ), following a previously used approach( Reference Rangan, Randall and Hector 18 ). A total of twenty food groups containing non-core foods was determined. Further information about the allocation of foods to non-core can be found elsewhere( Reference Toumpakari, Haase and Johnson 7 ). Raw data represented one food item consumed by one adolescent within one EO in each row. EO were defined as all food and drink items consumed together by the same person, on the same day, at the same time. Total non-core EI (kcal) per EO was the sum of energy from all non-core foods and drinks reported.
Definition of eating context
NDNS used EMA to collect real-time information on where and with whom food consumption occurred. Thirty six locations of EO were collapsed into seven categories (‘Home’; ‘Friend’s/relative’s house’; ‘School’; ‘Eateries’, such as restaurants, cafés and fast-food places, ‘On the go’; ‘Activity/other places’; ‘Work’) and nineteen ‘with whom’ categories were collapsed into six groups (‘Alone’; ‘Parents/carers’; ‘Parents & siblings’; ‘Family & friends’; ‘Friends’; ‘Not specified’) for analysis( Reference Toumpakari, Haase and Johnson 7 ). For the ‘where’ and ‘with whom’ categories ‘Home’ and ‘Alone’ were the reference groups, respectively.
Potential confounders
A review of the literature and the availability of data in the survey informed the selection of potential confounders, which included: (i) time (hours) of each EO; (ii) day of each EO (either weekday (Monday–Friday) or weekend day (Saturday–Sunday)); (iii) television watching; (iv) sex; (v) age (years); (vi) BMI (kg/m2), computed from measured weight and height and standardised for age and sex using the 1990 British Growth Reference( Reference Cole, Bellizzi and Flegal 19 ). BMI categories (i.e. underweight, normal weight, overweight and obese, based on International Obesity Task Force criteria) were also created and were used in interaction models; (vii) adolescent SES indicated by parental occupation (high, intermediate or low (reference category)) based on the National Statistics Socio-Economic Classification (NSSEC)( Reference Wijlaars, Johnson and van Jaarsveld 20 ); and (viii) adolescents’ average total daily EI (per 4184 kJ (1000 kcal)/d).
Data analysis
The frequency and percentage of all EO and characteristics of EO in specific ‘where’ and ‘with whom’ eating contexts are reported at the survey level. Total and non-core EO per day consumed by adolescents overall and in specific contexts are described using means and standard deviations. Individual characteristics of adolescents reporting EO overall and in specific contexts are described using frequencies and percentages (for categorical variables) and means and standard deviations (for continuous variables). Pearson χ 2 tests were used to examine simple associations between eating contexts and categorical characteristics of EO or adolescents. Differences between eating contexts and continuous variables were examined using Kruskal–Wallis tests for non-normal and ANOVA for normally distributed variables.
Multilevel modelling
MLM( Reference Rabe-Hesketh and Skrondal 21 ) investigated the relationship of eating contexts with non-core energy consumption. Level 1 variation was in characteristics of EO (where, with whom, time and day of the week of each EO and television watching) and level 2 variation was in characteristics of adolescents (age, sex, SES, BMI and total EI). EO are nested within adolescents; hence MLM allowed us to explore whether non-core EI varies within and between adolescents, as well as factors that explain this variability. Non-core energy (kcal) per EO was not normally distributed, owing to non-consumption of non-core foods in 31 % of EO, and was logged to approximate the normal distribution.
A series of models were run: Model 1 was the null intercept model, which included just the adolescent identifier in the random part of the model, to explore the extent to which differences in non-core EI were bigger between adolescents v. within adolescents. Models 1·1 to 1·9 are random-intercept univariable models, where each model included the adolescent identifier and an additional single explanatory variable from either the EO or adolescent level entered separately in their own model. These models examined the individual effect of each EO-related variable on non-core energy. Model 2 is a random-intercept model and included all explanatory variables at the EO level from Models 1·1 to 1·4 simultaneously to explore the independent effect of each eating context on non-core energy consumption, accounting for time of day and day of the week. Model 3 was Model 2 plus all adolescent-related variables from Models 1·5–1·9 to explore the independent effect of each eating context on non-core energy consumption accounting for time of day, day of the week and between-adolescent differences (i.e. sex, age, SES, EI and BMI). Coefficients from Model 3 were also converted to non-core energy by multiplying the adjusted ratios by the intercept of the model, to provide meaningful units for public health nutrition. The description and purpose of all different models are illustrated in the online supplementary material, Supplemental Table 1.
For each model, we calculated the change in the proportion of variance explained in the outcome within adolescents, between adolescents and in total compared with the variance estimated by Model 1. For Models 1–3, the intraclass correlation (between-adolescent variance/total variance) represented the proportion of variance in non-core EI attributable to differences between adolescents. Model fit was assessed using a likelihood ratio test.
Sensitivity analyses
Misreporting for EI was assessed using an individualised method( Reference Mendez, Popkin and Buckland 22 , Reference Rennie, Coward and Jebb 23 ), where the ratio of reported EI to estimated energy requirement was calculated and plausible reports were identified using cut-offs of 0·66–1·34. In total, 53 % of the total sample were under-reporters and 4 % of adolescents were over-reporters. The final Model 3 was rerun with the inclusion of a categorical misreporting variable (under-, plausible or over-reporters); however, ratios were identical to Model 3 and are therefore not reported. Interactions of eating contexts with sex, SES and BMI were tested in Models 4, 5 and 6, respectively. Stratified MLM were run for any statistically significant interactions. Individual level 2 survey weights, available from NDNS, were used to account for selection and non-response bias. Analyses were done in that statistical software package Stata version 13.
Results
Characteristics of eating occasions
Table 1 describes the characteristics of EO overall and within specific eating contexts. The majority of EO were consumed at ‘Home’ (68 %) and on a weekday (70 %) but were broadly spread throughout the day. Adolescents ate ‘Alone’ (24 %) as much as with ‘Friends’ (23 %). Overall 69 % of EO contained non-core food. Similar to all EO, most non-core EO occurred at ‘Home’ (66 %), on weekdays (67 %) and were spread throughout the day. EO at ‘Home’ (68 %) were less likely to be with ‘Friends’ (5 %) and more likely to occur ‘Alone’ (33 %; data not shown). While 3 % of all EO occurred in ‘Eateries’ (see online supplementary material, Supplemental Table 2), 89 % contained non-core food. EO at ‘Eateries’ were more likely to occur with ‘Friends’ (51 %) and less likely to occur with ‘Parents/carers’ (9 %; data not shown). Eating ‘Alone’ was less likely to contain non-core food (60 %) and was more common in the morning (34 % at 06.00–12.00 hours). EO with ‘Friends’ were more likely to contain non-core food (77 %) and occur on a weekday (78 %) lunchtime (35 % at 12.00–14.00 hours).
Table 1 Characteristics of eating occasions (EO) in the survey and across ‘where’ and ‘with whom’ eating contexts, in absolute frequencies and percentages, among adolescents (n 884) aged 11–18 years, UK National Diet and Nutrition Survey (NDNS) 2008–2012
* Pearson χ 2 test was performed between this variable and with all ‘where’ and ‘with whom’ eating contexts.
† EO containing at least one non-core food.
‡ P<0·001 across all ‘where’ and ‘with whom’ eating context.
§ Meal slots are based on NDNS categories.
║ These are percentages of all EO in the whole survey.
¶ These are percentages of all EO in the specific context.
Characteristics of adolescents
Table 2 describes individual characteristics of adolescents reporting EO overall and within different physical and social eating contexts. All adolescents reported eating at ‘Home’ and 63 % ate at ‘School’. Fewer adolescents reported eating in other locations, ranging from 12 to 50 % reporting eating at ‘Work’ or ‘On the go’. Overall the mean age of adolescents was 14·5 years, mean BMI was 21·9 kg/m2, BMI Z-score was 0·7 and mean total EI was 7468 kJ/d (1785 kcal/d). Adolescents reported on average 6·4 EO/person per d.
Table 2 Characteristics of adolescents (n 884) aged 11–18 years in the UK National Diet and Nutrition Survey (NDNS) 2008–2012
SES, socio-economic status; EI, energy intake; EO, eating occasion.
Pearson χ 2 test was performed between sex, high SES, intermediate SES and all ‘where’ and ‘with whom’ eating contexts.
Kruskal–Wallis test was performed between mean age, BMI, BMI Z-score, total EI and total EO/person per d with all ‘where’ and ‘with whom’ eating contexts.
* Evidence of association only for ‘with whom’ eating contexts (P<0·001).
† Evidence of association for both ‘where’ and ‘with whom’ eating contexts (P<0·001).
‡ BMI Z-score was created by standardising BMI for sex and age based on the 1990 British Growth Reference(Reference Cole, Bellizzi and Flegal19).
Adolescents who ate at ‘Eateries’ were mostly females, older, of higher SES and had greater total EI (7971 kJ/d (1905 kcal/d)) compared with the overall sample. On the contrary, their BMI Z-score was lower compared with the children of the UK child growth standards (0·6 v. 0·7). Adolescents had on average 0·2 EO/person per d at ‘Eateries’. Finally, adolescents who ate with ‘Friends’ had 1·3 EO/person per d on average eating with them and did not differ from the overall sample in terms of their overall characteristics.
Compared with the overall sample of adolescents, boys were less likely to eat at a ‘Friend’s/relative’s house’, ‘Eateries’, ‘Work’ and with ‘Family & friends’ and more likely to eat at ‘Activity/other places’ and with people ‘Not specified’ (see online supplementary material, Supplemental Table 3). Adolescents from the high SES group were more likely to eat at ‘Eateries’ and ‘Activity/other places’ and with ‘Parents/carers’ compared with the overall sample (Supplemental Table 3), while adolescents from the intermediate SES group were more likely to eat at ‘Work’ and with ‘Parents & siblings’ compared with the overall sample (Supplemental Table 3).
Within- and between-adolescent variation in non-core energy intake
In Model 1 including random effects for adolescents, the intraclass correlation showed that only 11 % of the total variance in non-core EI was attributed to differences between adolescents (Table 3). The remaining 89 % of the differences in non-core EI was attributed to within-person variability in different EO.
Table 3 Within-adolescent, between-adolescent and total variance explained across the different models among adolescents (n 884) aged 11–18 years in the UK National Diet and Nutrition Survey (NDNS) 2008–2012
ICC, intraclass correlation; SES, socio-economic status; N/A, not applicable.
* Model 1 includes just adolescents’ identifier to model random effects within and between people. No explanatory variables are included.
† Model 2 is adjusted for within-adolescent variables, i.e. ‘where and ‘with whom’ eating contexts, time of day and day of the week.
‡ Model 3 is adjusted for within-adolescent variables (from Model 2) and for between-adolescent variables, i.e. sex, age, BMI, energy intake and SES.
§ Model 4 is adjusted for within- and between-adolescent variables (Model 3) and sex–eating contexts interactions.
|| Model 5 is adjusted for within- and between-adolescent variables (Model 3) and SES–eating contexts interactions.
¶ Model 6 is adjusted for within- and between-adolescent variables (Model 3) and BMI–eating contexts interactions.
** Computed as the percentage of change in variance compared with Model 1.
†† ICC represents the percentage of variation in non-core energy intake in an eating occasion attributed to differences between adolescents. Computed from ICC=between-adolescents’ variance/total variance.
‡‡ P<0·001. A likelihood ratio test was conducted by comparing the deviance across the models. The difference in deviance follows a χ2 distribution with df, the increase in the number of parameters estimated in each successive model (df=1).
Including level 1 variables (characteristics of EO) explained 4·8 % of the total variation and 5·1 % of the variation within adolescents in non-core EI (Model 2, Table 3). Further adjusting for adolescents’ characteristics in Model 3, we explained 20·2 % of the between-adolescent variation in non-core EI and 6·5 % of the total variance compared with Model 1 (Model 3, Table 3). Only sex, total EI and BMI showed evidence of an association with non-core EI, which individually explained 0·3, 2·3 and 0·3 % of the total variation, respectively (Table 4). The association of sex with non-core EI was attenuated by the inclusion of covariates in Model 3, but associations for total EI and BMI Z-score remained (data not shown). In Model 3, each 4184 kJ (1000 kcal) of total EI was associated with 42 % (95 % CI 30, 55 %) more non-core EI, while 1 sd of BMI was associated with 4 % (95 % CI 0, 7 %) lower non-core EI in an EO. The intraclass correlation in Model 3 decreased to 9·3 %, suggesting that by including the above adolescent characteristics, 9·3 % of the differences in non-core energy were now attributed to differences between adolescents. The fit of the models improved significantly (Table 3).
Table 4 Relationship of non-core energy intake with eating occasion (EO) and adolescent variables, along with percentage of total variance explained, among adolescents (n 884) aged 11–18 years in the UK National Diet and Nutrition Survey (NDNS) 2008–2012
SES, socio-economic status.
Ratios come from linear variance component multilevel models (Models 1·1 to 1·9), with non-core energy intake (non-core kcal) as the outcome variable. Models 1·1 and 1·2 with eating contexts contain all dummy variables for the physical or the social contexts examined. For example, Model 1·1 includes all the dummy variables for the ‘where’ variable, e.g. ‘Friend’s/relative’s house’, ‘School’, ‘Eateries’, ‘On the go’, ‘Activity/other places’ and ‘Work’, with the reference category being ‘Home’. Similarly, Model 1·2 includes ‘Parents/carers’, ‘Parents & siblings’, ‘Family & friends’, ‘Friends’ and ‘Not specified’, with the reference category being ‘Alone’. All the remaining models contain one independent variable. Ratios are the exponentiated values of the log-transformed coefficients and represent changes in the ratio of the mean non-core energy intake (kcal) in an eating occasion (the intercept). For example, an exponentiated value of 1·39 for an eating context represents a 39 % difference in non-core energy intake between the specified eating context and its reference category.
* Computed as the percentage of change in total variance compared with Model 1.
† Reference category is ‘Home’.
‡ Reference category is ‘Alone’.
Associations of physical (‘where’) contexts with non-core energy intake
The effect estimates and variation explained for physical eating contexts in Model 1·1 are displayed in Table 4. Eating at ‘Eateries’ was associated with the largest non-core EI, with intakes more than double the amount eaten at ‘Home’ (2·79; 95 % CI 2·41, 3·24). All the remaining locations showed evidence, to a much lesser extent, of higher non-core EI compared with ‘Home’. Collectively ‘where’ EO occurred explained 4·1 % of the total variance in non-core energy (Table 4).
After adjusting for EO and adolescent characteristics (Model 3), evidence for higher non-core EI in all out-of-home locations was robust (Table 5). The effect size of all locations on non-core EI was broadly similar in Model 3 compared with the unadjusted Model 1·1 (Table 4). After these adjustments, ‘Eateries’ remained associated with the highest non-core EI (2·51; 95 % CI 2·12, 2·96), followed by ‘School’ (1·88; 95 % CI 1·65, 2·13).
Table 5 Ratios of the change in mean non-core energy intake at each ‘where’ and ‘with whom’ eating context among adolescents (n 884) aged 11–18 years in the UK National Diet and Nutrition Survey (NDNS) 2008–2012
* Estimate and ratios come from Model 3 (adjusted for ‘where and ‘with whom’ eating contexts, time of day, day of the week, sex, age, BMI, energy intake and socio-economic status). Ratios are the exponentiated values of the log-transformed coefficients and represent changes in the ratio of the mean non-core energy intake (kcal) in an eating occasion (the intercept). For example, an exponentiated value of 1·25 for an eating context represents a 25 % difference in non-core energy intake between the specified eating context and its reference category.
† Reference category is ‘Home’.
‡ Reference category is ‘Alone’.
Associations of locations with non-core energy are presented in Fig. 1 in units of kcal/EO. Assuming all else is equal, when adolescents eat in ‘Eateries’, their non-core EI is 703 (95% CI 427, 1163) kJ (168 (95% CI 102, 278) kcal) compared with 280 (95% CI 201, 393) kJ (67 (95% CI 48, 94) kcal) when they eat at ‘Home’.
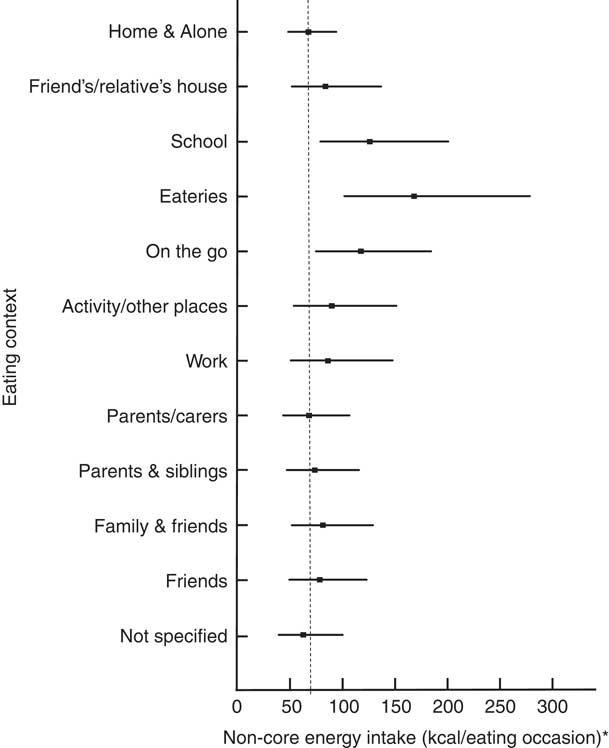
Fig. 1 Associations of eating contexts with non-core energy intake among adolescents (n 884) aged 11–18 years, UK National Diet and Nutrition Survey (NDNS) 2008–2012. *Predicted estimates come from Model 3, adjusted for time of day, day of the week, sex, age, BMI, energy intake and socio-economic status. Computed from Table 5 (estimate=intercept ×ratio), they show non-core energy (in kcal/eating occasion; 1 kcal=4·184 kJ) that adolescents consume in all eating contexts, with 95 % CI represented by horizontal bars. - - - - - shows non-core energy intake at ‘Home’ and ‘Alone’ (intercept), adjusted for factors in Model 3 (mentioned above)
Associations of social (‘with whom’) contexts with non-core energy intake
The effect estimates and variation explained for social eating contexts in Model 1·2 are displayed in Table 4. In the unadjusted models (Table 4), when eating with ‘Friends’, adolescents consumed 80 % more non-core EI (1·80; 95 % CI 1·63, 1·99) compared with eating ‘Alone’. On the contrary, when eating with ‘Parents & siblings’, adolescents reported eating 15 % (1·15; 95 % CI 1·02, 1·29) more non-core energy compared with eating ‘Alone’. Collectively ‘with whom’ adolescents ate explained 2·1 % of the variance in non-core energy (Table 4).
After adjusting for EO and adolescent characteristics (Model 3, Table 5), eating with ‘Family & friends’ was the social context with the highest non-core EI compared with eating ‘Alone’ (21 %; 95 % CI 7, 37 %), whereas the association with ‘Friends’ was greatly attenuated to just 16 % (95 % CI 3, 31 %) more non-core EI.
Associations of social eating contexts with non-core energy represent adolescents consuming 335 (95% CI 213, 536) kJ (80 (95% CI 51, 128) kcal) and 318 (95% CI 205, 515) kJ (76 (95% CI 49, 123) kcal) non-core EI when with ‘Family & friends’ and ‘Friends’, respectively, compared with 280 (95% CI 201, 393) kJ (67 (95% CI 48, 94) kcal) when eating ‘Alone’ (Fig. 1).
Interactions between sex and eating contexts on non-core energy intake
Evidence of interaction was observed only for sex and ‘Activity/other places’ (P=0·045) as well as ‘Family & friends’ (P=0·028). Boys consumed 48 % more non-core energy at ‘Activity/other places’ compared with girls (boys: 1·56; 95 % CI 1·22, 1·98; girls: 1·08; 95 % CI 0·83, 1·42), whereas girls consumed 29 % more non-core energy compared with boys when eating with ‘Family & friends’ (girls: 1·35; 95 % CI 1·14, 1·59; boys: 1·06; 95 % CI 0·90, 1·25).
Discussion
The present study is the first assessing the associations between eating contexts and non-core energy consumption independent of other features of EO and individual adolescent characteristics. Only 11 % of the variation in non-core EI was attributed to differences between adolescents, while the remaining 89 % occurred because of differences from one EO to another within the same person. Eateries, such as restaurants, cafés and fast-food places, were independently associated with the highest non-core EI, where adolescents consumed 423 kJ (101 kcal)/EO more non-core energy than comparable EO at home. Analyses to date have only captured how differences between people are associated with non-core EI, such as food preferences or amounts of television watching( Reference Johnson, van Jaarsveld and Wardle 24 , Reference McGowan, Croker and Wardle 25 ). By using MLM, the association of eating contexts independent of between-individual differences was estimated and thus potential confounding associated with adolescents’ specific characteristics was ruled out.
As our analysis is novel there are no other studies with which to directly compare the results. Previous research has either focused on the associations of different food environments with overall consumption, without distinguishing between ‘healthy’ and ‘unhealthy’ foods( Reference Woodruff, Hanning and McGoldrick 26 , Reference Zoumas-Morse, Rock and Sobo 27 ), or has only examined younger children’s individual characteristics in relation to non-core energy consumption( Reference Johnson, van Jaarsveld and Wardle 24 , Reference McGowan, Croker and Wardle 25 , Reference Zarnowiecki, Parletta and Dollman 28 ). Mak et al. ( Reference Mak, Prynne and Cole 12 ) have examined associations of eating context with fruit and vegetable consumption in a younger age group, showing lower odds of fruit and vegetable consumption at home compared with school and care outside home settings. In addition, Liu et al. ( Reference Liu, Han and Cohen 13 ) showed that adults had higher odds of consuming sugar-sweetened beverages outside the home and especially in sit-down restaurants and fast-food/convenience stores, similarly to our findings. However, none of these studies reported on the relative contribution of within- and between-person variation to food intake, unlike our findings. Our analyses showed greater within-person variability in non-core food intake, suggesting that interventions should target environmental contexts rather than individual characteristics to reduce adolescents’ non-core food consumption.
Non-core EI was more variable from one EO to another (within adolescents) than it was from one person to another (between adolescents), suggesting that all adolescents eat non-core energy to some extent. The amount of non-core energy they eat is better predicted by characteristics of EO, such as where and with whom the EO occurred, rather than characteristics of the individual like their age or SES. Future research should therefore focus on identifying factors affecting within-person variability in EO rather than the characteristics of people; for example, food advertising, product placement and number of people present. These factors, among others, can vary between EO, however they are typically measured in laboratory settings. Collecting information on these factors in real-life settings may help us explain a greater proportion of within-person variation in non-core EI and identify novel targets for interventions. Changing individuals’ eating behaviour can be notoriously hard, thus interventions could instead target specific eating environments to help everyone reduce non-core energy in those contexts( Reference Adams, Mytton and White 29 ). The focus of policies could be further guided by understanding the source of non-core energy; for example, if most non-core energy eaten at school is bought from nearby food outlets then policies improving the food environment of those outlets would be beneficial.
Eateries were the eating contexts associated with the highest non-core energy consumption in adolescents. On average adolescents had 0·2 non-core EO at eateries per day and ate 423 kJ (101 kcal) more non-core energy in each EO, which translates to 590 more kJ (141 more kcal) of non-core energy per week compared with eating at home. Although most eating occasions take place at home and therefore in absolute terms more non-core food is consumed at home, adolescents are less likely to consume non-core food at home compared with eating in eateries. In addition, our analyses did not consider food purchased from eateries but consumed elsewhere, which is likely to have increased non-core food consumed at/from eateries. Adolescents choose to eat at eateries such as fast-food places because they are quick, easy to get to and they serve tasty foods( Reference Rydell, Harnack and Oakes 30 ). Foods consumed in eateries are usually higher in fat and sugar than foods consumed at home( Reference Lachat, Nago and Verstraeten 31 ), which is in concordance with our work showing higher non-core EI in these settings. In addition, portion sizes served at eateries in the UK have increased over the years( Reference Church 32 ). Hence, factors such as an increased availability of non-core foods at eateries, larger portion sizes and the frequency with which adolescents eat there, may explain the increased non-core EI at these places. Reformulating non-core foods, offering a different range of foods (e.g. fruit and vegetables as side dishes rather than chips( Reference Anzman-Frasca, Dawes and Sliwa 33 )) and decreasing portion sizes have been suggested as strategies to decrease non-core food consumption( Reference Grieger, Wycherley and Johnson 34 ). A few of these strategies have been tried among adolescents and were shown to be successful( Reference Ebbeling, Feldman and Osganian 35 , Reference Ebbeling, Garcia-Lago and Leidig 36 ), thus future studies should further explore their use in real-life settings.
Despite existing policies to improve the quality of food in schools( 37 ), our findings highlighted greater amounts of non-core foods consumed in school compared with home. School food standards have generally improved the quality of schools meals provided in secondary schools( Reference Nicholas, Wood and Harper 38 ); however, nutrients such as fibre, vitamins and Fe were still below recommended standards( Reference Nicholas, Wood and Harper 38 ). In addition, some academies and free schools are still exempt, hence the quality of food provided there cannot be ensured. A substantial source of food consumed in schools is packed lunches, whose nutritional quality is considered poorer compared with school meals( Reference Nicholas, Wood and Harper 38 – Reference Stevens, Nicholas and Wood 40 ). Furthermore, adolescents often buy non-core foods, such as soft drinks and confectionery, from supermarkets, fast-food places and convenience shops( Reference Macdiarmid, Wills and Masson 41 ), typically found around school premises( Reference Smith, Cummins and Clark 42 ). Future studies should also explore where most of the non-core food consumed at schools is obtained from, to better guide the focus of school interventions and policies.
Eating with family and friends and with friends were the only social eating contexts associated with increased non-core EI compared with eating alone. Previous research has shown increased EI with familiar others compared with strangers( Reference de Castro 43 ); that is, greater meal size (more energy consumed) when eating with family/spouse and friends compared with co-workers and other unfamiliar people( Reference de Castro 44 ). Social facilitation was suggested as the operating mechanism, i.e. people consume more food in the presence of familiar others( Reference de Castro 44 , Reference Salvy, Jarrin and Paluch 45 ). In addition, more often than not, eating with family and friends occurs in eateries compared with eating alone or with parents and siblings, i.e. 7 v. 0·2–2 % (data not shown). Eating with family and friends represents a social occasion which is considered a ‘treat’ for the whole family( Reference McGuffin, Price and McCaffrey 46 ), hence non-core food choices become more acceptable compared with the home environment. Future studies should explore ways to normalise core food consumption when eating out in the company of family and friends.
Our findings highlighted high-risk eating environments, such as eateries and school; however, the majority of EO and subsequently non-core food consumption still occurred within the home environment. To improve the home eating environment, we need to understand the sources of non-core food consumed at home, which will enable us to identify additional targets for home-based interventions. Evidence shows that British adolescents obtain most of their fat and sugar intake from fast-food places, bakeries, convenience shops and vending machines( Reference Tyrrell, Greenhalgh and Hodgson 47 ), while US data from four national representative surveys from 1977–2006 have shown that most of the energy adolescents consumed at home was obtained from supermarkets and grocery shops( Reference Poti and Popkin 48 ). Future studies should investigate place of consumption and place of purchase concurrently, to more efficiently target and change high-risk eating environments.
Strengths and limitations
Our findings should be interpreted carefully in the light of the study’s strengths and limitations. A major strength is that data are from a representative adolescent sample in the UK and that foods were classified to core and non-core with the use of a simple and explicit tool. The use of MLM allowed us to investigate the independent association of eating context within-person, while holding between-person confounding factors constant. Food diaries offer a more accurate dietary assessment method compared with an FFQ or a single 24 h recall( Reference Thompson and Subar 49 ), while their combination with EMA allowed the collection of real-time data and the simultaneous measure of contextual factors alongside food intake. All self-reported dietary assessment can be affected by misreporting; however, we quantified and adjusted for plausible reporting in our analyses( Reference Mendez, Popkin and Buckland 22 , Reference Tooze, Freedman and Carroll 50 ) and the results were unchanged.
On the other hand, the use of cross-sectional data limits causal inference. The study did not investigate the combined association of physical and social eating contexts, such as eating with friends at school, as this type of analysis would decrease the power to detect interactions owing to the small numbers in some contextual combinations. Eating location was defined as the place of consumption, however looking at the place of purchase may have identified different eating contexts such as convenience stores. The total variance of non-core EI explained in the models was relatively small (i.e. 6·7 %), hence future research should explore further within-person variability by measuring additional factors( Reference Willett 51 ) like food availability and accessibility of food outlets. These are typically perceived to vary between people but could also be measured at that EO level. Finally, the definition of eateries in the current study included both sit-down restaurants and fast-food places, although poor diet quality has been mainly attributed to fast-food outlets rather than sit-down restaurants or cafés( Reference Penney, Jones and Adams 52 ). However, EO at fast-food outlets in our data represented a very small proportion of total EO (0·8 %), hence associations with fast-food restaurants only would be unlikely to be different compared with overall eateries.
Conclusion
The present study is the first to analyse associations of eating context with UK adolescents’ non-core energy consumption, independent of their individual characteristics. Variability in non-core EI is better explained by differences between EO rather than between individuals, hence targeting specific high-risk food environments and not specific people may be more beneficial for improving adolescents’ eating behaviour and subsequently their diet during adulthood. More specifically, our findings highlight the potential for targeting eateries in future interventions to reduce non-core energy consumption, through reformulation of existing non-core foods, the provision of smaller portion sizes or increasing the availability of healthier food choices. By improving the food environment of eateries, as well as other high-risk eating environments such as school, consumption of healthier options becomes easier, while diet inequalities are more likely to reduce since change occurs for everyone( Reference Adams, Mytton and White 29 ). A great proportion of unexplained within-person variability in non-core EI was highlighted which suggests that future research should focus on identifying factors affecting EO rather than individual characteristics.
Acknowledgements
Acknowledgements: The authors would like to thank the study participants, the NDNS team, the UK Data Service and the dietary assessment assistants at MRC Human Nutrition Research who coded the food diaries. Financial support: This research received no specific grant from any funding agency in the public, commercial or non-for-profit sectors. Conflict of interest: None. Authorship: The present work was designed by Z.T., A.M.H. and L.J.; analysis was conducted by Z.T., L.J. and K.T.; initial manuscript preparation and drafts were prepared by Z.T.; the final manuscript was revised by all authors. Ethics of human subject participation: The NDNS was conducted according to the Declaration of Helsinki and was approved by the Oxfordshire A Research Ethics Committee. Written informed consent was obtained from all participants.
Supplementary material
To view supplementary material for this article, please visit https://doi.org/10.1017/S1368980018002860


