


I. INTRODUCTION
In the energy-hungry 21st century, sustainable energy ‘generation’ by renewable sources and efficient ‘storage’ for (mobile) distribution form two key technological sectors. Efficient energy storage can be realized by various electrochemical energy storage devices; batteries being the leader with their high gravimetric energy/power density and robust cyclability. The saga of batteries became popular with the commercialization of rechargeable Li-ion batteries by SONY® (Tokyo, Japan) (circa 1991) based on the intercalation reaction involving LixCoO2 cathode and graphite anode.Reference Goodenough and Park1 Almost 40 years after the discovery of intercalation mechanism,Reference Whittingham2 the internal design remains unaltered with various companies catering to the multibillion dollar battery market. Development of robust batteries is a multiprong task, where anode (−ve electrode) plays an important role for safe operation.
In a sense, the successful commercialization of batteries can be rooted to the use of graphite anode versus a plethora of intercalation cathode materials. Graphite converts to LiC6 via a staging intercalation process (at 0.2 V) delivering capacity over 372 mA h/g. However, graphite suffers from issues like irreversible Li loss owing to the formation of solid electrolyte interphase (SEI) and short-circuit related safety risks from low voltage dendrite formation at higher current or during over-discharge/over-lithiation. To overcome these issues, various Ti-based anode materials have been introduced.Reference Chen, Belharouak, Sun and Amine3,Reference Zhu, Wang and Xia4 While spinel Li4Ti5O12 has been commercialized,Reference Ohzuku, Ueda and Yamamoto5 numerous titanate materials are widely being investigated. One such class of titanate anode family is MLi2Ti6O14 (M = 2Na, Sr, Ba, Pb).Reference Dambournet, Belharouak and Amine6–Reference Li, Qian, Yu, Yan, Lin, Yang, Long, Shui and Shu10 Structurally, MLi2Ti6O14 titanates have an orthorhombic (s.g. Cmca) framework built from layers of edge and corner connected TiO6 octahedra along (100) with lithium atoms occupying vacancies within the TiO6 framework.Reference Koseva, Chaminade, Gravereau, Pechev, Peshev and Etourneau11
In 1989, BaLi2Ti6O14 was found by serendipity as a highly pure Li+ conductive phase (4 × 10⁻³ S/cm at 300 °C, E a = 0.36 eV) in the 20% Li2O–73% TiO2–7% BaO ternary system.Reference Zheng, Okuyama, Esaka and Iwahara12 Its crystal structure was reported in 2005 by Koseva et al.Reference Koseva, Chaminade, Gravereau, Pechev, Peshev and Etourneau11 BaLi2Ti6O14 is capable of delivering high energy density with its high theoretical capacity (approximately 242.8 mA h/g) and a safe operating voltage ∼1.4 V (versus Li). Following the initial reports by Belharouak and Amine,Reference Dambournet, Belharouak and Amine6,Reference Belharouak and Amine7 Shu group has systematically examined the BaLi2Ti6O14 system by process/morphology optimization, doping, and conductive coating.Reference Lin, Li, Shao, Shui, Wang, Long, Ren and Shu13–Reference Yu, Yan, Qian, Li, Lan, Zhu, Long, Shui and Shu17 They all involve aggressive heat treatment steps involving high calcination temperature (900–1100 °C), prolonged annealing (12–24 h), and expensive precursors. It makes the synthesis cumbersome that calls for alternate energy-miser synthesis methods.
Pursuing BaLi2Ti6O14 titanate system, here we report a rapid solution combustion synthesis involving the lowest calcination temperature (approximately 800 °C) along with the shortest calcination duration of 2 h. We have investigated the Li+ conductivity and migration pathways in BaLi2Ti6O14 titanate by synergizing experimental ionic conductivity measurement with computational bond valence site energy (BVSE) calculations. It offers feasible Li+ migration pathways suitable for battery anode application. The combustion synthesized barium lithium titanate delivers reversible capacity over 100 mA h/g in Li half-cell architecture. In addition, we have observed partial Na+ (de)intercalation in BaLi2Ti6O14 for the first time. With its open structure, one-dimensional diffusion pathways with moderate energy barrier, and intermediate voltage safe operation, combustion-made BaLi2Ti6O14 forms a robust anode for secondary batteries.
II. MATERIALS AND METHODS
A. Combustion synthesis
The BaLi2Ti6O14 target product was prepared via a two-step solution combustion method using low-cost metal nitrates as the oxidizer and glycine as fuel. Titanyl nitrate [TiO(NO3)2] was prepared in-house using acid hydrolysis.Reference Chung and Wang18 Under ice-cold condition and constant stirring, 3 mL (6 moles) of titanium isopropoxide (C12H28O4Ti, Sigma, St. Louis, Missouri, 97%) was added to 9 mL of isopropyl alcohol (Merck & Co., Kenilworth, New Jersey, 99.7%). 3 mL of 1:1 v/v diluted HNO3 (Merck, 69%) was added dropwise to form a clear titanyl nitrate solution. After sonication for 20 min, stoichiometric amounts of Ba(NO3)2 (Sigma, >99%), LiNO3 (Sigma, 99%), and glycine (C2H5NO2, Merck, 99.7%) were added to the titanyl nitrate solution. Upon heating this precursor solution at 140 °C, a thick white mixture was formed after evaporation of excess water. It was transferred to a hot plate maintained at 500 °C. It triggered the exothermic combustion reaction forming an amorphous intermediate complex. It was mildly ground and was calcined at 800 °C for 2 h (in air) to obtain the final titanate product. The type of fuel, stoichiometry of the lithium precursor, and calcination temperatures were optimized after extensive trials.
B. Physical characterization
Powder X-ray diffraction patterns of pristine and electrochemically cycled samples were acquired with a PANalytical Empyrean X-ray diffractometer (PANalytical, Malvern, UK) equipped with a Cu Kα source (λ1 = 1.54 Å, operating at 40 kV/30 mA). Typical patterns were collected in the 2θ range of 10–90° (step size = 0.026°/s). Rietveld refinement was performed using GSAS program using EXPGUI graphical user interface.Reference Rietveld19–Reference Toby21 The surface morphology was examined with an FEI Quanta 200 scanning electron microscope (FEI, Hillsboro, Oregon) having a tungsten source operating at 20–25 kV. The structure and morphology were further analyzed with an FEI Technai F 30 STwin transmission electron microscope operating at 200 kV. For TEM, the powder sample was dispersed in ethanol and was deposited on a holey carbon–copper grid. Brunauer–Emmett–Teller (BET) surface area analysis using surface adsorption of N2 (at 77 K) was performed with a Belsorp Max unit (MicrotracBEL Corp., Krefeld, Germany). Raman spectra were collected with a HORIBA JobinYvon LabRAM HR spectrometer (Horiba Ltd., Kyoto, Japan) using a 532 nm laser source.
C. AC conductivity measurement
The ionic conductivity as a function of temperature was measured using AC impedance spectroscopy. The combustion synthesized titanate powder was pressed into pellet (Φ = 15 mm) by applying 55 kN uniaxial pressure. This pellet was densified by sintering at 800 °C for 12 h and its relative density (ρexp/ρtrue) was determined by the Archimedes principle. Silver paste was coated on both sides serving as an electronic conductor while blocking the ionic exchange. AC impedance analysis was performed with an Agilent 4194 A HP impedance analyzer (Agilent Technologies, Santa Clara, California) in the frequency range of 40 Hz–100 MHz in the temperature range of 200–300 °C. The impedance spectra were analyzed using ZView impedance data analyzer software.
D. Computational methods
Lithium-ion occupancy in vacant sites in BaLi2Ti6O14 and corresponding migration barrier values were calculated based on the BVSE method.Reference Adams and Rao22–Reference Chen and Adams24 EBVSE(Li) identifies regions of low BVSE that connect to form migration pathways for mobile lithium ions. As demonstrated by Adam et al., the mismatch |∆V| of bond valence s Li−X = exp [(R 0,Li−X − R Li−X)/b Li−X] can be favourably scaled down to absolute energies by rewriting bond valence into a Morse-type interaction potential between the reference cation Li+ and anion X.
 $${E_{{\rm{BVSE}}}}\left( {{\rm{Li}}} \right) = \sum\limits_x D \left[ {\sum\limits_{i = 1}^N {\left( {{{\left( {{{{s_{{\rm{Li}} - {\rm{X}}}}} \over {{s_{{\rm{min,}}\;{\rm{Li}} - {\rm{X}}}}}}} \right)}^2} - 2{{{s_{{\rm{Li}} - {\rm{X}}}}} \over {{s_{{\rm{min,}}\;{\rm{Li}} - {\rm{X}}}}}}} \right)} } \right] + {E_{{\rm{repulsion}}}}\quad .$$
The required parameters were taken from the softBV database.Reference Chen and Adams24 The structure model was constructed with the refinement of atomic coordinates obtained from the experiment. Grids covering this structure model with a resolution of (0.1) Å3 was used while calculating EBVSE(Li).
E. Electrochemical characterization
For battery testing, the working electrode was prepared by making a slurry of active material, polyvinylidene fluoride binder, and Super P carbon black (80:10:10 w/w) in minimal amount of N-methyl-2-pyrrolidone (Sigma, >99%) solvent. This slurry was uniformly coated on copper current collector (Φ = 12 mm) and was dried in vacuum to remove the NMP solvent. The typical active material loading was ∼3 mg/cm2. For battery testing, CR2032-type coin cells were assembled inside an Ar-filled glove box (MBraun LabStar GmbH, Garching, Germany) to avoid any moisture contamination. Coated disks and Li metal foils (Sigma) were used as the working and counter electrodes, respectively, separated by two sheets of Whatman GF/C glass fiber separator soaked with 100 μL of 1 M LiPF6 dissolved in 1:1:3 v/v % of ethylene carbonate/propylene carbonate/dimethyl carbonate (EC/PC/DMC) acting as the electrolyte. Sodium half cells were assembled in a similar fashion by using Na metal foil as the counter electrode and 1 M NaPF6 dissolved in 1:1 v/v% of ethylene carbonate/diethylene carbonate (EC:DEC) acting as the electrolyte. These coin cells were subjected to galvanostatic cycling at different rates (C/20 ∼ 3C) in the potential window of 0.5–2 V (at 25 °C) with VMP3 or BCS-805/810 (Bio-Logic SAS, Seyssinet-Pariset, France) battery cycler. The capacity and C rate values were calculated keeping in mind the theoretical capacity of BaLi2Ti6O14 (242.8 mA h/g) based on six electron/lithium transfer.
F. Ex-situ characterization
Ex-situ electrochemical and Raman analyses were performed by using Swagelok type Teflon-aluminum cells. Swagelok cells were stopped at different states of charge/potentials in the 1st cycle (1.3 V, 0.5 V, 1.5 V, and 2 V). Complete phase formation at the stopping potentials was ensured by keeping the cell at a constant voltage until current decayed to half (C/20). Postcycling, the Swagelok cells were opened inside the glove box, and the electrodes were washed with propylene carbonate solvent and were vacuum dried for 12 h for further analysis.
III. RESULTS AND DISCUSSION
A. Structure and morphology
For combustion synthesis of BaLi2Ti6O14 titanate, several trials were made to optimize the amount of lithium precursor, fuel, pre-calcination temperature, and final calcination temperature. To compensate for possible lithium volatisation at high temperature, a slightly excess amount (0–5%) of lithium precursor can be used. Varying the Li precursor content, the final BaLi2Ti6O14 product was formed along with impurities like Li4Ti7O16, BaTiO3, and TiO2 (Supplementary Material, Fig. S1). Using a pre-calcination temperature of 500 °C and final annealing at 800 °C, the phase pure titanate product was obtained. Despite several attempts, we were unable to get pure titanate phase by combustion synthesis employing alternate fuels such as ascorbic acid, citric acid, stearic acid, sucrose, and urea. The exothermicity of the combustion reaction can be altered by varying the oxidant to fuel ratio. In the current work, stoichiometric amounts of Ba/Li/Ti precursors (as oxidants) and glycine (as fuel) were used involving the final annealing at 800 °C for 2 h.
Rietveld refinement confirmed the phase purity of combustion synthesized BaLi2Ti6O14 (χ2 = 3.82%, R factor = 6.69%) (Fig. 1). When compared to solid-state synthesis involving 950 °C calcination for 12 h, solution combustion synthesis yielded the desired titanate with the lowest reported calcination temperature (800 °C) and calcination duration (2 h). This titanate stabilizes into an orthorhombic crystal structure (symmetry: Cmca) with lattice parameters a = 16.565(2) Å, b = 11.265(5) Å, and c = 11.584(0) Å similar to earlier reports.Reference Dambournet, Belharouak and Amine6,Reference Lin, Li, Shao, Shui, Wang, Long, Ren and Shu13 The atomic coordinates and bond valence sums of all atoms gave a GII value of 0.147(2) in agreement with the value of 0.102(8) found for single crystal literature data. It validates the stability of the chemical environment of the refined structural model for further study. Table I lists the crystallographic parameters, atomic coordinates, and bond valence sum values obtained from Rietveld refinement.
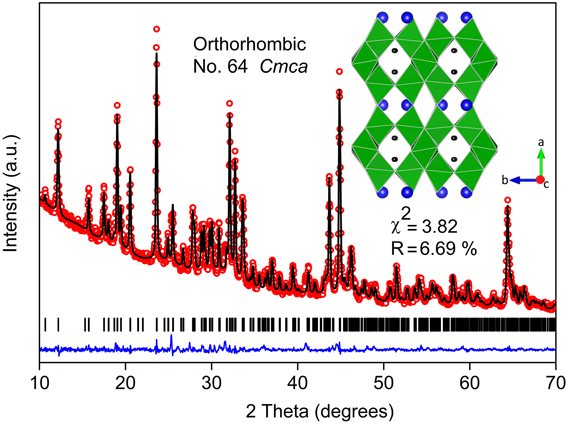
FIG. 1. Rietveld refinement of XRD (Cu Kα) pattern of BaLi2Ti6O14 formed by solution combustion synthesis. The experimental data points (red hollow dots), calculated pattern (black line), their difference (blue line), and Bragg reflections of the orthorhombic Cmca phase (black bars) are shown. The inset shows the crystal structure along c axis of the refined cell having partly filled Li tunnels surrounded by rutile tunnels transversely reinforced by TiO6 pairs (green). (Ba = blue balls, TiO6 octahedra = distorted green squares, and Li = black balls).
TABLE I. Crystallographic parameters determined by the Rietveld refinement of high-resolution XRD data (λ = 1.5418 Å) of BaLi2Ti6O14 at 25 °C. (U iso = equivalent isotropic displacement parameters) (BVS = bond valence sum).

a The high calculated theoretical density (4.09 g/cm3) in BaLi2Ti6O14 can favor high tap density energy density.
b GII is the root mean square bond valence mismatch of the bond valence sums.
The three-dimensional framework of BaLi2Ti6O14 is built from layers TiO6 octahedra having tunnels partly filled with Li ions. One set of TiO6 octahedra containing Ti(1) and Ti(2) share opposite edges of their equatorial plane to form a rutile-like chain along c direction. Another similar set of TiO6 octahedra reinforce these rutile chains by alternately sharing adjacent edges along b and c axis. It forms corner-sharing blocks of 3 edge-sharing TiO6 octahedra (along a direction) having zig-zag tunnels partially filled with Li ions. Barium atoms occupy 11 coordinated 8f sites between the layers. Despite high unit cell volume, mean Ba–O bond distance (2.87 Å) in our case was similar to the value (2.889 Å) obtained from the single crystal study,Reference Koseva, Chaminade, Gravereau, Pechev, Peshev and Etourneau11 both of which were significantly lower than the sum of the ionic radii (2.97 Å). This stems from the residual compressive strain, which was further validated by a high bond valence value of Ba (2.11) (Table I).
The short annealing time led to less aggressive grain growth so as to form small primary particles in the size range of 150–300 nm (Fig. 2). They agglomerated to form secondary micrometric (<5 μm) particles. Characteristic to combustion reaction involving gaseous by-products, porous morphology was developed that can be beneficial for electrolyte wetting and efficient Li+ diffusion (with shorter diffusion length) during battery cycling. The BET specific surface area was found to be ∼8 m2/g (Supplementary Material, Fig. S2). HRTEM images [Fig. 2(f)] show  $\left( {\bar{1}\bar{1}\bar{1}} \right)$ plane with a dislocation-free interplanar spacing of 7.1725 Å. The corresponding selected area diffraction pattern [SAED, Fig. 2(h)] confirmed phase purity with distinct points indexed to $\left[ {\bar{1}\bar{1}\bar{1}} \right]$ zone axis. Figure 2(g) shows (311) and (112) planes with an interplanar spacing of 4.54 Å and 4.94 Å, respectively. Due to their small difference, several edge dislocations can be seen. Elemental mapping [Fig. 2(j)] showed a uniform distribution of constituent Ba, Ti, and O elements in BaLi2Ti6O14 titanate.
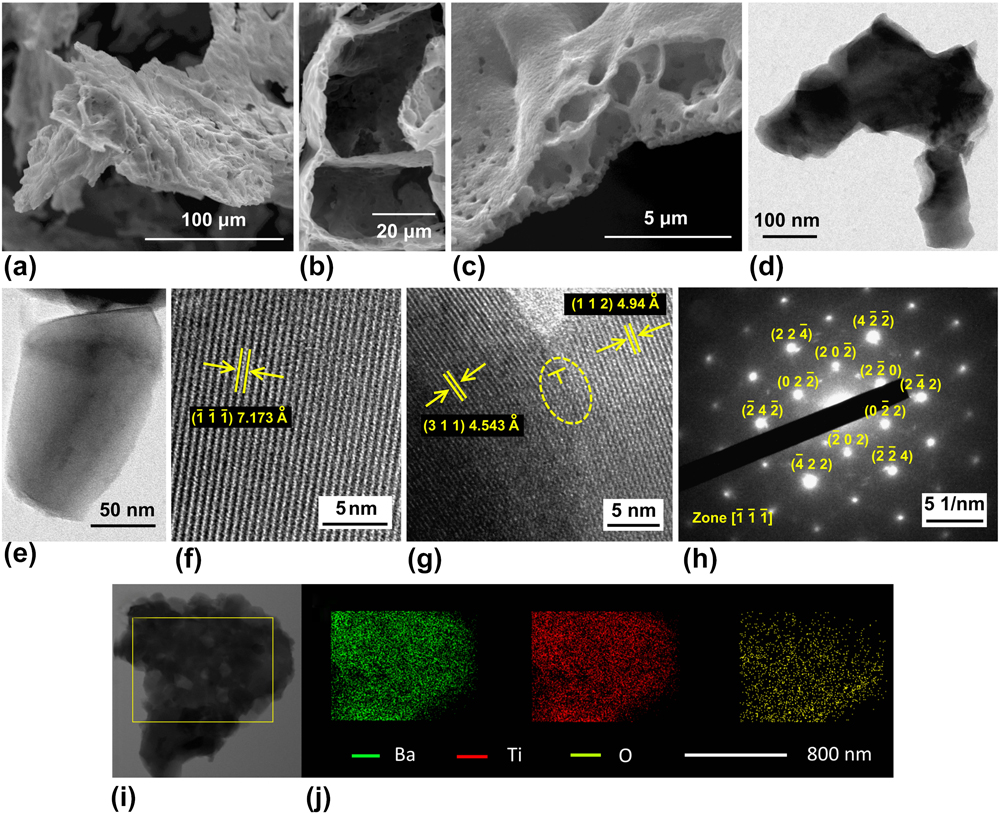
FIG. 2. (a–c) SEM images of as-prepared BaLi2Ti6O14 showing porous morphology. (d and e) TEM images indicating nanometric particle size. (f and g) High resolution TEM images showing fringes indexed to atomic plane and dislocations showing extra half plane at the interface between two planes. (h) SAED pattern indexed to the orthorhombic Cmca crystal structure. (i and j) Bright field STEM images and elemental mapping showing homogenous distribution of barium, titanium, and oxygen.
B. BVSE analysis
During lithiation, BaLi2Ti6O14 reduces one (or more) Ti from Ti4+ to Ti3+ while intercalating xLi+ to form BaLi2+xTi6O14. It involves diffusion of Li+ ions that is controlled by the crystal structure and surrounding potential. As Li+ ions intercalate at x = 0 in BaLi2+xTi6O14 proceeding through partially delithiated structures (0 < x < 6), the chemical environment around Li+ gets gradually modified and determines its iterative distribution and movement. The key is to build an accurate lowest energy chemical environment from experimentally reliable and a hence relevant local structure consisting of refined atomic positions. Environment modeling can be done using several ways such as computationally expensive ab initio methods. Similar results can be obtained by using simpler BVSE calculations.Reference Adams and Rao22–Reference Chen and Adams24 BVSE method, working on force field of the chemical environment, intuitively identifies interstitial or vacancy sites of the lowest BVSE of lithium (E BVSE Li+), stitching them by intersite hopping barrier energies into one or multidimensional threads of lithium ion migration pathways. Based on blocking due to defects/impurity or change of barrier energies with composition x, different pathways can activate. For consistency, migration pathways found by computationally expensive ab initio methods have been found to match those by the bond valence approach in suites of electrode materials.
In the pristine delithiated state (x = 0), tunnels directed along c axis host 16 Li+ ions (2 per formula unit as Z = 8) completely occupying single 16 g empty tetrahedral sites, along with two interstitial sites i2 and i3. These tunnels are created by TiO6 rutile chains interconnected alternately above and below by sets of edge-sharing TiO6 blocks (Fig. 1, inset). Inside the tunnels, along with i2 and i3 sites, Li1 sites form a one-dimensional (1D) zigzag migration pathway Li1–i2–Li1–i3 that interconnect to neighboring 1D channels by Li1–i4–Li1 2D paths forming a two-dimensional (2D) network spread in the ac or (010) plane [Fig. 3(a) showing isosurface as pathways along with position of the environmentally most perturbing ion]. The 2D nets are linked in the bc plane (100) by Li1–i3–i3–Li1 three dimensional (3D) paths [Fig. 3(b)]. For a clearer understanding, complete Li+ ion migration pathways overlapping with the crystal structure is illustrated in Fig. 3(c).
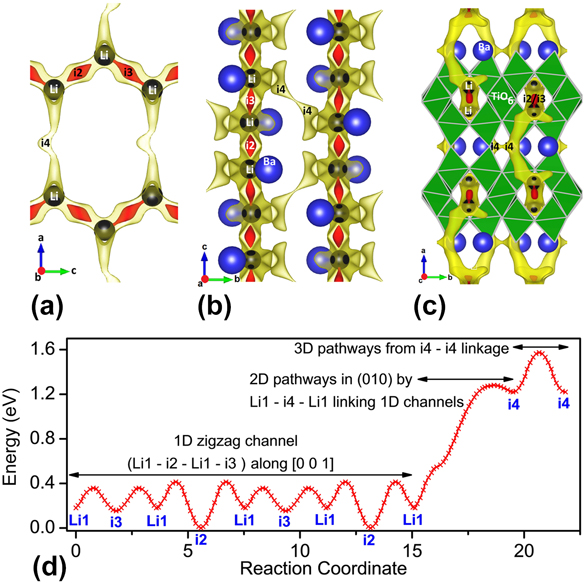
FIG. 3. BVSE model showing lithium ion migration pathways in BaLi2Ti6O14. The pathways shown are two isosurfaces (red and yellow) (a) (010) plane having one dimensional and two dimensional paths involving i2, i3, and i4 interstitials in half of the unit cell (to avoid overlap), (b) (100) plane having three dimensional pathways through i4 and (c) (001) plane showing 1D path running along the lithium filled tunnel, rutile chain (one labelled TiO6), and (d) energy landscape showing migration barriers across different interstitials connected 1D, 2D, and 3D paths. The barrier for i3 access by Li1 is smaller than i2, hence as the energy corresponding to the isosurface in red is enough for i3 access but just exceeds the i2 barrier, i2 is not connected to lithium while i3 is. All illustrations have been presented using VESTA.Reference Momma and Izumi25
From the energy plot in Fig. 3(d), it can be seen that i2 and i3 interstitials have dissimilar site energies unlike the case of SrLi2Ti6O14.Reference Dayamani, Shinde, Chaupatnaik, Rao, Adams and Barpanda9 Despite the compressive strain of the M (M = Sr/Ba) atom in BaLi2Ti6O14 (bond valence of Ba = 2.11) that is absent in SrLi2Ti6O14 (bond valence of Sr = 1.75), the larger ionic size of Ba significantly increases the b and c lattice parameters in comparison to a. Ba is closer towards the i2 site while being far and opposite from i3. This smaller Ba-i2 distance [Fig. 3(a)] increases the i2 energy significantly from i3. Hence the 2D links are difficult to operate in the case of Ba with only one interstitial as compared to two interstitials in Sr. Concomitant to the case of Sr, with BVSE ignoring the mobile Li–Li repulsions, though interstitials i2 and i3 exist at energies much lower than Li1, stay unfilled because of Li1 stabilization in i1 by reduced repulsion among mobile Li+ ions. (The nomenclature is ix if the site is unfilled and Lix if the site is filled by Li).
The migration pathways calculated for BaLi2Ti6O14 have low barriers of 0.414 eV for 1D links with higher barriers of 1.281 and 1.574 eV for the 2D and 3D links [Fig. 3(d)]. Hence, most likely it is a one-dimensional ionic conductor, rarely activating the 2D and 3D pathways in cases when 1D pathways are blocked. It is in contrast to isostructural SrLi2Ti6O14 which is at discretion to freely use 1D, 2D, and 3D pathways with barrier energies lower than 0.69 eV making it a 3D ion conductor. Following the energy landscape, a maximum of four Li+ will insert sequentially in i3, i2, i4, and i5 sites, each of which can hold one lithium. This is if progressive lithium insertion does not drastically energize the chemical environment. Otherwise, based on the lowest energy at that composition, Li+ ions will dynamically rearrange altering the energy landscape. Overall, BaLi2Ti6O14 was found to be a one-dimensional Li+ conductor. The ionic conductivity was further analyzed by experimental ac conductivity measurement as described below.
C. AC (ionic) conductivity
Unlike graphitic anode where Li+ ions intercalate along with electrons without reducing anything, ionic conductivity is important in anodes involving transition metal ions. Ionic conductivity is more important than electronic conductivity as diffusion governs/limits the rate of (de)lithiation during battery cycling. Ionic conductivity was measured using BaLi2Ti6O14 pellets having 94.24% (3.83 g/cm3) of theoretical density (4.069 g/cm3). Figure 4(a) shows the high temperature complex Nyquist plots from 200 to 300 °C at intervals of 10° C taken to understand the process involved during ionic conduction and correlate it with that obtained from the earlier BVSE analysis. For temperatures up to 250 °C, depressed semicircles were observed. A tail at the low-frequency end suddenly appeared in Nyquist plots above 250 °C indicating fast ion mobility which gets blocked as ionic charges accumulate at the sample–electrode interface. All depressed semicircles diminished at higher temperatures indicating an increase in conductivity.
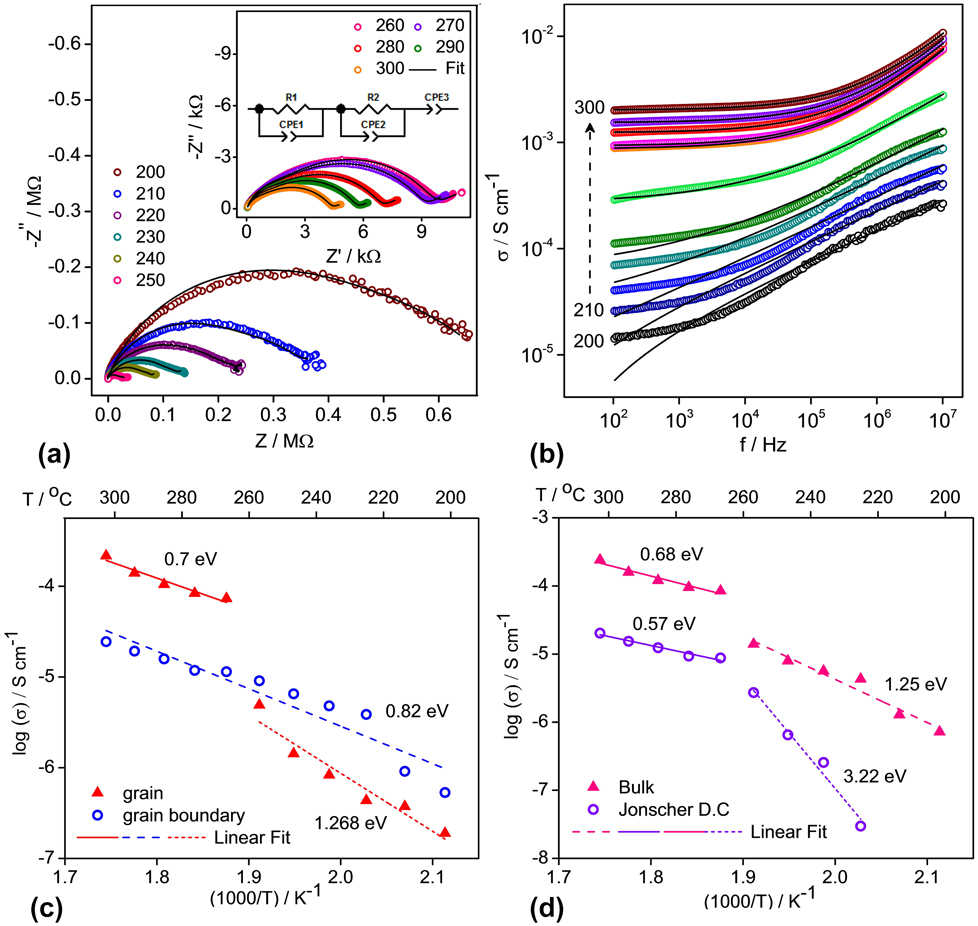
FIG. 4. Electrical measurements of AC conductivity. (a) Complex impedance plots for BaLi2Ti6O14 recorded in the frequency range of 40 Hz–110 MHz at high temperatures and the corresponding fit, using ZView, as per the equivalent circuit in the inset, (b) AC conductivity versus frequency and fit based on Jonscher’s power law. The individual resolved and combined bulk resistance values from fits in (a) and Jonscher’s dc conductivity values from fits in (b) have been used to calculate the activation energy in graphs (c) and (d).
The observed values were fitted to an equivalent circuit consisting of a pair of parallel Debye-like resistor-constant phase element (representing impedance contribution from grain and grain boundary) and a constant phase element (representing the impedance contribution from the electrode–grain interface) connected in series. Though semicircles of impedance spectra seem as a single depressed semicircle, two overlapping semicircles from grain contribution at higher frequency and grain boundary contribution at lower frequency regions exist, which can be resolved slightly more clearly at higher temperatures. This difficulty in resolution indicates overlapping time constants for grain and grain boundary relaxation. The bulk resistance R was calculated from a parallel combination of resistance values of grain (R g) and grain boundary (R gb) obtained after fitting. Bulk conductivity (σ) in S/cm was calculated using σ = 1/ρ = l/(R × A), where l is the thickness of the pellet and A is the disc area of the pellet in cm. The grain, grain boundary, and bulk conductivity at 300 °C were 2.16 × 10⁻⁴ S/cm, 2.44 × 10⁻⁵ S/cm, and 2.41 × 10⁻⁴ S/cm, respectively. The activation energy for ion movement was calculated from Arrhenius relation of the temperature dependence of dc conductivity:
 $$\sigma = {A_0}\exp \left( { - {{{E_{\rm{a}}}} \over {kT}}} \right)\quad ,$$
where A 0 is the pre-exponential factor, E a is the activation energy in eV, k is the Boltzman’s constant in eV/K, and T is the temperature in K.
The individual grain and grain boundary conductivity values (in S/cm) at different temperatures obtained after fitting the impedance spectra have been plotted versus 1000/T [Fig. 4(c)]. The grain conductivity shows a large jump above 250 °C with a corresponding change in slope while the grain boundary conductivity follows a single trend. Two temperature regions of grain and entire temperature region of grain boundary conductivity were fitted. Grain boundary activation energy of 0.82 eV was obtained. Grain activation energy corresponding to 0.7 and 1.268 eV for high and low temperature regions was found. It indicates the occurrence of an internal switch in ionic conduction mechanism within the grain from 2D to 1D, increasing ion mobility, possibly from clearing away of defects in the 1D pathways at a higher temperature. It is justified from an excellent agreement of the activation energy obtained from BVSE where calculated values for the 1D path (0.414 eV) match the high-temperature values (0.7 eV), while values for the 2D path (1.281 eV) match the low-temperature values (1.268 eV) of grain conductivity.
Figure 4(b) shows the variation of ac conductivity with frequency at 10 °C intervals from 200 to 300 °C. AC conductivity increases with an increase in temperature indicating higher mobility, while at temperatures above 240 °C, it varies with frequency as per Jonscher’s universal dielectric response depicting localized ionic motion.Reference Jonscher26
 $$\sigma \left( \omega \right) = {\sigma _{{\rm{dc}}}} + A{\omega ^n}\quad ,$$
where σdc is the low frequency or dc conductivity, A is the preexponential temperature-dependent factor, and n is the degree of interaction between mobile ions. Solid black lines in Fig. 4(b) show the fitting of experimental data to Jonscher’s law at each temperature from which the magnitudes of n and σdc are obtained. Plotted versus 1000/T [Fig. 4(d)], the Jonscher’s dc conductivity σdc shows a sharp change in slope at 250 °C. The activation energies of Jonscher’s dc and bulk conductivity are 0.57 and 0.68 eV at high temperature and 3.22 and 1.25 eV at low temperature. Except for the low temperature value of Jonscher’s dc conductivity, the change of activation energy signals a change in ion conduction mechanism from 2D to 1D as discussed earlier.
D. Electrochemical performance
The diffusion behavior in BaLi2Ti6O14 was further analyzed by cyclic voltammetry (CV). Figure 5(a) shows potentiostatic cyclic voltammograms at scan rates ranging from 0.1 to 1 mV/s. Pristine BaLi2Ti6O14 reduces while intercalating Li+ at 1.37–1.29 V (R1) and 1.16–1.11 V (R2) and oxidizes while deintercalating Li+ at 1.17–1.28 V (O1) and 1.48–1.55 V (O2). O1 can be resolved to two peaks which merge at higher scan rates. Figure 5(b) shows the variation of current for four redox peaks (R1, R2, O1, and O2) with square root of the scan rate in (V/s)0.5. Linearly fit with zero intercepts R1, R2, O1, and O2 gave slopes of −0.076, −0.028, 0.030, and 0.109, respectively. These slopes were used to calculate the diffusion coefficient as per Randal Sevchik equation.Reference Ding, Xu, Yao, Wegner, Fang, Chen and Lieberwirth27
 $${i_{\rm{p}}} = 2.69 \times {10^5} \times {n^{1.5}}A{D^{0.5}}C{\nu^{0.5}}\quad ,$$
where the i p, n, A, D, C, and ν represent the peak current in A, number of electrons utilized in the peak, electrode area of 2.324 cm2, diffusion coefficient in cm2/s, the concentration of the diffusing ion for each peak in mol/cm3, and scan rate in V/s. C is the concentration of lithium ion in a unit cell of BaLi2Ti6O14. For 1 Li+ ion in a unit cell, C is the ratio of moles of Li to the volume of the unit cell (2164.17 Å3) calculated from refinement, i.e., 0.006137 mol/cm3. C can then be written as
 $$C = 0.006137\left( {\# \;{\rm{of}}\;{\rm{L}}{{\rm{i}}^ + }} \right)\;{\rm{mol/c}}{{\rm{m}}^3}\quad .$$
FIG. 5. (a) CV of BaLi2Ti6O14 versus lithium half-cell cycled at current rates from 0.1 to 1 mV/s. Four distinct redox peaks were observed named as R1, R2, O1, and O2 in the sequence of their appearance. (b) Linear fit of the four peak currents to square root of the scan rate. (c) Schematic of calculated diffusion coefficient from slope obtained from fits in (b).
All Li+ ions in the unit cell are considered. This includes pre-existing two lithium ions in BaLi2Ti6O14 in addition to n lithiums exchanged corresponding to n electrons during the redox process. The reason why the two pre-existing structural lithiums are included is because the BVSE analysis confirmed their mobility as they were part of 1D migration pathways having a low energy barrier of 0.414 eV. The number of electrons, n, at each peak depends on the number of Li+ ions exchanged during that peak. n for R1 and O2 is assumed to be 1.28 based on the intake of around 52 mA h/g observed in 1st charge at 1.41 V in 4a/4b/8c sites as discussed later. Similarly, n for R2 and O1 is assumed to be 1.24 based on 50 mA h/g charge capacity stored in the slopes other than during and after the plateau in the 1st charge. Thus, the cumulative numbers of lithium ions present in the unit cell in R1, R2, O1, and O2 are 3.38 (2 + 1.28), 4.62 (2 + 1.28 + 1.24), 3.38 (4.62 − 1.24), and 2 (3.38 − 1.28). Although the O1 and R2 peaks are smaller than the sharp peaks, the area under the curve remains the same confirming equal charge exchange (close to 1.3 lithiums). Based on the above discussions, the diffusion coefficients of lithium ions at R1, R2, O1, and O2 are compared in Fig. 5(c). It is highest for the O2 peak as it has the least number of lithiums (2) amongst all redox peaks.
Diffusion coefficient values in the range of 10−11 to 10−12 cm2/s [Fig. 5(c)] were obtained for combustion prepared BaLi2Ti6O14. The ionic diffusivity can be enhanced by four standard ways: (i) changing crystallinity, (ii) doping, (iii) conductive coating, and (iv) particle downsizing. Combustion synthesis delivers carbon-coated small particles, which is favorable to obtain high diffusion coefficient. Following the diffusion analyses, the electrochemical performance was measured in standard Li- and Na-half-cell architectures.
The galvanostatic voltage–capacity profiles of combustion-made BaLi2Ti6O14 are shown in Fig. 6 cycled (i) at C/10 rate between a narrow potential window (1–2 V) and (ii) at C/20 rate between a wider potential window (0.5–2 V). In the former case, out of 120 mA h/g stored in the first cycle, 16 mA h/g was lost to the parasitic reaction, 62.6 mA h/g (1.55 Li+) was stored in the 4a/4b/8c sites at 1.41 V (inset) while 41 mA h/g (1 Li+) was stored in the vacant 8f sites. In the subsequent cycles, out of 87 mA h/g (2.12 Li+) extracted during the first charge, 53 mA h/g (1.3 Li+) could be extracted at 1.41 V [the inset of Fig. 6(a)] from the partly lithium filled 4a/4b/8c sites. Excellent capacity retention was recorded for over 120 cycles.
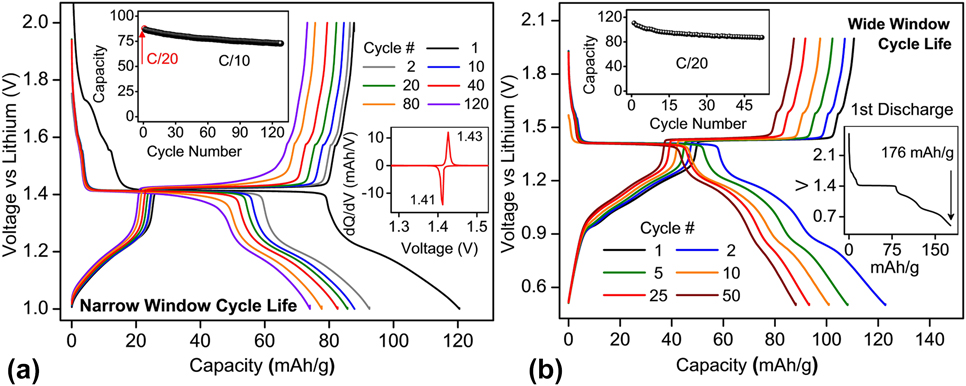
FIG. 6. Cycle life performance of BaLi2Ti6O14 versus lithium (a) at C/10 rate for a narrow voltage window of 1–2 V and (b) at C/20 for a wider voltage window of 0.5–2 V. A C/20 slow formation cycle precedes both tests. The insets show capacity retention, dQ/dV versus V, and first cycle losses.
When cycled in the wide 1.5 V potential window (0.5–2 V), the first discharge of 176 mA h/g was observed [the inset of Fig. 6(b)], out of which the first 17 mA h/g (0.4 Li+) was lost to the parasitic reaction, next 63 mA h/g (1.57 Li+) was stored in vacant 4a/4b/8c sites of lithium tunnels at 1.41 V while remaining 96 mA h/g (2.38 Li+) was stored collectively at (i) 2 different voltage regions in 8f sites and (ii) consumed to possible SEI formation. 111 mA h/g of capacity (2.75 Li+) could be extracted in the first charge, out of which only 51.78 mA h/g (1.28 Li+) could be removed at 1.43 V (low polarization of 0.02 V) from the partly filled 4a/4b/8c sites. 78% of total first charge capacity (87 mA h/g or 2.12 Li+) could be retained or reversibly extracted in the 50th charge cycle [Fig. 6(b) inset]. These results indicated (a) the same 1.3 Li+ can be extracted in the first plateau independent of potential window indicating reversibility in 4a/4b/8c sites remains unaffected and (b) reducing lower cut-off voltage significantly affects Li+ reversibility/capacity retention whose origins could be gradual lithium loss to unstable SEI formation and/or trapping in the inherent weakly reversible 8f sites.
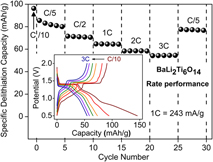
Following, the rate performance of combustion prepared BaLi2Ti6O14 was assessed by varying the current rate from C/10 to 3C. The corresponding capacity retention and voltage–capacity profiles are summarized in Fig. 7. Charge capacities of 96 mA h/g (2.38 Li+), 80 mA h/g (1.98 Li+), 71 mA h/g (1.76 Li+), 64 mA h/g (1.58 Li+), 58 mA h/g (1.44 Li+), and 55 mA h/g (1.36 Li+) were recorded at C rates of C/10, C/5, C/2, 1C, 2C, and 3C, respectively. Charge capacity reverted back to 77 mA h/g (1.9 Li+) upon decreasing the C rate to C/5.

FIG. 7. Rate performance of BaLi2Ti6O14 versus lithium at higher current rates up to 3C (726 mA/g). The inset shows voltage profile and their polarization at different C rates.
Overall, the electrochemical performance of BaLi2Ti6O14 prepared using rapid solution combustion synthesis was better than solid-state prepared BaLi2Ti6O14 without ball milling. It could be due to the formation of smaller particles with porous morphology. In our case, the electrochemical performance can be further improved by ball milling, doping (that improves electronic conductivity), and process optimization (co-fuel/oxidant-fuel ratio) until it can fully utilize the 1D low energy pathways.
Following the efficient (de)lithiation, the presence of open channels inspired us to gauge possible (de)insertion of Na+ ions into BaLi2Ti6O14. When cycled in a Na half-cell architecture, we observed reversible Na+ insertion for the first time (Fig. 8). The first discharge capacity was 195 mA h/g (4.83 Na+ insertion) with a plateau ∼0.15 V. In the subsequent cycles, a reversible capacity of 36 mA h/g (0.89 Na+) was observed with an average redox potential of 0.6 V. This preliminary result hints at the use of MLi2Ti6O14 family of compounds for sodium-ion insertion with proper material optimization.
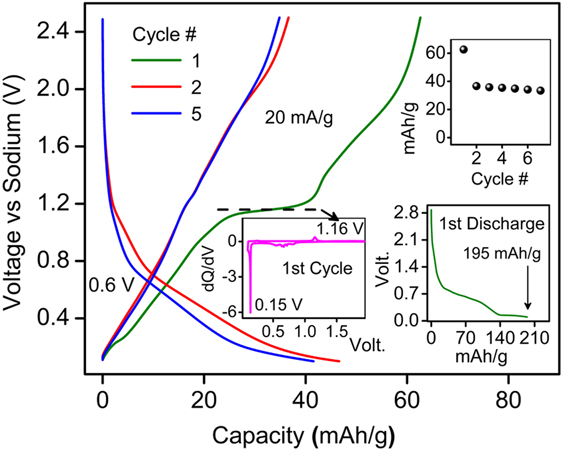
FIG. 8. Sodium activity in BaLi2Ti6O14 at 20 mA h/g in 1 M NaPF6 in 1:1 EC:DEC in the voltage range of 0.1 and 2.5 V. The inset shows capacity retention, first cycle loss, and dQ/dV versus V.
IV. CONCLUSIONS
Barium lithium titanate (BaLi2Ti6O14) was prepared by solution combustion synthesis by employing the lowest reported calcination temperature (approximately 800 °C) and soaking duration (approximately 2 h). The purity of titanate product was confirmed by Rietveld and electron microscopy analyses. The Li+ diffusivity was measured synergizing BVSE computation, impedance spectroscopy, and CV. BVSE analysis revealed lower activation energy barrier for 1D (0.414 eV) migration along c axis and higher activation energy barrier for 2D (1.281 eV) and 3D (1.574 eV) pathways. AC conductivity analysis showed a Jonscher’s type of behavior with a bulk conductivity value of 2.41 × 10⁻⁴ S/cm (at 300 °C) with an activation energy barrier of 0.68 eV. CV calculated the diffusion coefficient in the range of 10−11–10−12 cm2/s. With this feasible Li+ migration, reversible Li+ (de)intercalation was noticed in the combustion synthesized BaLi2Ti6O14 titanate involving a 1.4 V Ti4+/Ti3+ redox activity along with decent rate kinetics and cycling stability. Furthermore, reversible Na+ (de)intercalation (0.89 Na+) was observed for the first time. Combustion synthesis is proposed as a rapid and scalable synthesis route to form a variety of titanate anodes for secondary batteries.
Supplementary Material
To view supplementary material for this article, please visit https://doi.org/10.1557/jmr.2018.250.
ACKNOWLEDGMENTS
AC thanks the Ministry of Human Resource Development (MHRD, Govt. of India) for financial assistance. PB acknowledges the Department of Atomic Energy (DAE, Govt of India) for a DAE-BRNS Young Scientists Research Award (YSRA). The authors thank Professor Stefan Adams for his scientific help with BVSE analysis. The current work was financially supported by the Indian National Science Academy (INSA/CMR/PBB/0021).


 Open access