


1. Introduction
In the design of buildings in Antarctica, counter-measures to control deposition of snow are important. To reduce snow deposition around buildings erected on ice-free rocks, buildings with elevated floors, including those at Syowa station, have been constructed, At Syowa station (69°00’S, 39°35’E), buildings constructed from 1957 to 1966 were erected on exposed rock and have suffered from heavy snow deposits. Design concepts of elevated structures were applied in designing buildings which were constructed in 1967 and this procedure has been maintained. However, the design of these buildings was made on the basis of guesswork and neither scale-model experiments in wind tunnels nor observations on the growth of snow deposits were carried out.
The concepts of elevated building design were applied to the Australian Antarctic station at Casey; Styles and Melbourne (1968) reported on the occurrence of snow deposition around the buildings and wind-tunnel experiments. To predict the form of snow deposition around elevated buildings at Syowa station, Sato and Hannuki (1978) carried out wind-tunnel experiments, visualizing blowing snow and snowdrifts by means of soap bubbles.
The present study aims to elaborate on the basic design concept of elevated buildings in areas of drifting snow. The accumulation of deposits and the wind profiles around two elevated buildings at Syowa station were studied by the first author in 1978. In order to support the observed results, a series of wind-tunnel experiments of scale models was carried out. The results of the present study suggest the optimum floor height and building forms required to control snow accumulation around buildings to be erected on ice-free rock in Antarctica.
2. Measurements of Snow Deposition around Elevated Buildings
The meteorological records at Syowa station in 1978 reveal that air temperatures ranged from -35 to +6.2°C with a mean of -10.7°C, the average wind speed was 6.9 m s−1 with a maximum gust of 44.9 m s1, the number of days with maximum wind speed above 10 m s−1 was 220, the number of days of snowfall was 198, and heavy blizzards occurred on 62 days.
To observe the processes of deposition in the lee of elevated buildings at Syowa station, the observation hut (floor elevated by steel pipe trusses) and the ionosphere hut (floor elevated by concrete pillars) were selected. The observation hut was built on a fairly flat rock in alignment with the prevailing north-easterly wind direction and 39 bamboo poles for drift measurement were set on the lee side (Fig.l). The floor height h was 1.6 m and the building height (floor to roof) H was 3.0 m, therefore h/H is about 0.5. The ionosphere hut was on ground which had a slope descending to the north-east, where the difference between the prevailing wind direction and the hut alignment was about 17 . A total of 91 poles were set in the lee of the building (Fig.2.). The floor height ranged from 1.52 to 2.35 m and the building height was 2.85 m, therefore in this case h/H was in a range of 0.5 to 0.8.

Fig. 1. Observation hut and locations of drift-markers.
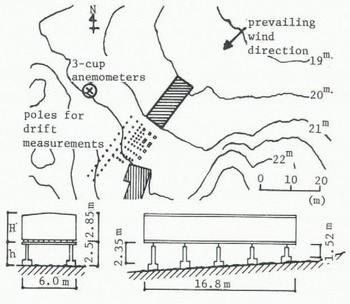
Fig. 2. Ionosphere hut and locations of drift-markers.
After each blizzard the forms of snow deposition were measured with the poles, and photographs were’ taken. Measurements for the observation hut were made on 25 occasions between 26 March and 26 November 1978, whereas for the ionosphere hut, 19 measurements were made between 7 April and 26 November. In both cases, there was little snow initially.
Figure 3 shows monthly profiles of snowdrift along the centre line in the lee of the observation hut. The snow deposition gradually increased with time, but sometimes decreased under the influence of changing wind direction. At its culmination on 12 November, the drift behind the hut exhibited a wind-scoop. The wind-scoop was formed because the drifting snow was blown off by strong winds passing under the floor of the hut. The length of the drift on the lee side, which was the affected side, was about 5 times the height of the hut, 5(H+h). The snow deposition exhibited a sharp ridge along the direction of the prevailing wind (see cross-section in Figure 3).
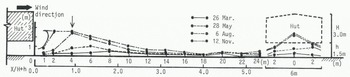
Fig. 3. The growth of snow deposits in the lee of observation hut.
The highest point of the ridge, about 1 m, was about 6 m from the back of the hut from April to June. The deposition increased gradually and the highest point of snow accumulation became gradually nearer to the hut. At the maximum height of 2.9 m on 12 November, the snow was 1 to 2 m behind the hut. The maximum volume of the deposit within the drift-marker area (4 × 24 - 96 m3) behind the observation hut was obtained on 12 November 1978 and was 86.7 m3; the volume then decreased because of the start of the melting season.
Four examples of the form of snow deposits in the lee of the ionosphere hut are shown in Figure 4. A fairly uniform deposit was observed along the direction of the prevailing wind. In this case, the wind direction is not parallel to the building. A snow-scoop formed behind the hut, which was similar to that of the observation hut. The maximum volume of the deposit within the drift-marker area (6 × 11 + 2(2 × 4) = 82 m2) behind the ionosphere hut was 186,4 m3 on 3 October 1978.
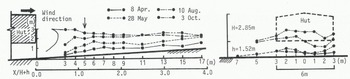
Fig. 4. The growth of snow desposits in the lee of ionosphere hut.
The details of snow deposition in 1978 are shown in Figure 5. The volume increased, on the whole, but there were slight decreases depending on the circumstances.
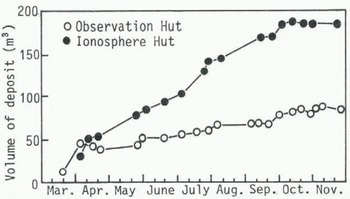
Fig. 5. Cumulative volume of snow deposits.
3. Measurement of the Wind Profiles Near the Buildings
To obtain the characteristics of the wind near the elevated buildings, a mast was erected near the ionosphere hut for the measurement of velocity profiles at five levels (1, 1.7, 2.8, 4.8, and 8 m) with three-cup anemometers (Fig.2.). The wind-run counter was installed in the ionosphere hut. Measurements were carried out from 17 February to 17 December 1978 at intervals of one minute for 212 cases, of 10 minutes for 63 cases and at two to 60 minutes for 44 cases.
The snow accumulation at the wind-profile pole was also measured several times, attaining the maximum depth of about 1 m in November. The change of the surface level due to snow accumulation was taken into account when plotting wind profiles. Reference MitsuhashiMitsuhashi (1982) reported that the observed wind profiles were well expressed by the logarithmic law, that is:
where Uz is the mean wind velocity at the height of Z, U*(x) is the friction velocity in the x-direction, k is von Karman’s constant (0.4), and ZO is the surface roughness length. The surface roughness lengths Z0, calculated from Equation (1) ranged from 10-4 to 1 m.
On the other hand, in architectural engineering, the following expression is widely usedt
where UG is the mean wind velocity at the height of ZG, and a is a power index. The power index calculated from Equation (2) ranged from 0.34 to 0.14 with the mean of 0.2. This mean value 0.2 falls between values for a smooth surface (0.1 to 0.125) and for the terrain in an urban area (0.33 to 0.5).
The results of measurements of wind profiles at Syowa station were considered in designing wind-tunnel experiments of scale models of elevated buildings.
4. Wind-Tunnel Experiments on Snow Deposition
To simulate snow deposition around the elevated buildings at Syowa station, a series of experiments were carried out with the closed wind tunnel at Nihon University, Tokyo. The available length for experiments was 5 m and the cross-section was 2 × 2 m. By adjusting the turbulence control grids, the natural wind profiles at Syowa station were simulated. Scale models of the observation hut (1/50) and (1/40) of the ionosphere hut, including the terrain configurations within a radius of about 40 m were used for the experiments. Since the models were bluff bodies, the conformity with the Reynold’s number was disregarded. In order to achieve similarity of wind profiles in the wind tunnel, the scale factor for the wind speed was taken to be equal to the 1/3 power of the length (Reference NemotoNemoto 1963). For example, for a mean wind speed of 30 m s −1 at a height of 10 m in the Antarctic, in the wind-tunnel experiments for the observation hut the mean wind speed at 0.2 m was set at 8.1 m−1 s and for the simulation of the ionosphere hut was achieved by 9 m s−1 at 0.25 m. It was ascertained that the turbulence spectrum in the wind tunnel was nearly the same as that of the natural winds. Wind directions against the buildings were changed: parallel, across and in between.
A hot-wire anemometer (two-channel, constant-temperature type) was used to measure wind profiles and turbulence intensities. Winds were measured at the locations of the drift-markers. To predict snow drifts in the lee of elevated buildings, two methods were adopted for the deduction of wind data.
The first method (a) is based on the application of turbulent diffusion theory on drifting snow phenomena, and the present study assumes that the flow regime in the wind tunnel replicates the blowing snow regime at Syowa station. It is assumed that the snow particles suspended in the air are transported by a constantly turbulent wind. In the vicinity of model buildings, the profile of blowing snow is expressed by the logarithmic law (Equation (1)) as in the case of natural wind profiles. It is assumed that the downward flux of snow caused by the Earth’s gravity is balanced with the upward transport by turbulent diffusion, that is:
where n is the drift density, WO the falling velocity, and K the eddy viscosity. WO was assumed to be constant (0.5 m s−1) at all levels.
Introducing Prandtl’s mixing length which is a linear function of height, the eddy viscosity K is expressed by
Integrating Equation (3) the following snowdrift flux (drift density) is obtained:
where the arbitrary function C(x, WO) results from n which is a function of flow direction x. However, the blowing snow in the Antarctic can continue for a long period, so the change of n in terms of flow direction can be neglected at the first step. In the present model experiment Z1 was taken as 0.8 × 10⁻² m and n1 = 100 g m. -3.
The rate of snowdrift transport Q (x) is expressed by:
where the lower integrand Z1 is taken as the limit of the lower height of blowing snow. To calculate the snowdrift transport on the upstream side of the building, Z1 is assumed to he equal to ZO , which was obtained from the wind-tunnel experiments (for the observation hut Z O = 3 × 10⁻² cm and for the ionosphere hut Z = 10−2 cm) and the upper integrand was 3H, because the drift intensity decreases rapidly in the upper air. The presence of a building influences the snowdrift transport in the upper air and in the flow direction. The difference in the snowdrift transport between Δx(=x2 - x1) is assumed to result in snow deposition:
From the result of measurements of wind profiles in the lee of buildings, the wind regime in the wind tunnel was classified into two domains which are shown in Figure 6. Domain (I), which is near the surface, indicates the layer where Equation (1) is applicable and the drift density is calculated from Equation (5). In the upper area (domain II), the air is turbulent and Equation (6) is not easily applicable for the calculation of drift density, so we assumed two uniform linear diffusion sources at the rear end of the building, both below the floor and above the roof. To obtain the snowdrift transport Q’ for the lower source, the integrands were the upper boundary of the domain (I) (about 1.5 cm) and (h + H/2); for the upper source Q” the integrands were (h + H/2) and 3H. From these two diffusion sources with different drift density and from wind profiles in the lee of the building, the snow deposition was calculated.

Fig. 6. Schematic representation of wind-tunnel experiment on snow deposition.
The second method (b) of prediction of snow deposition is by use of average wind profiles at drift-marker sites only. The form of deposition is deduced from isolines of threshold wind velocity which is 40% of the mean wind velocity. This value nearly corresponds to the threshold wind speed for the occurrence of snow drifting. In this case, the drift density is assumed to be uniform in the lee of the building where the turbulent energy becomes larger and there is a weaker region of wind near the surface of the ground.
Figure 7 shows the results of wind-tunnel experiments to predict the snow deposition in the lee of the observation hut. The experimental results by method (a) showed a linear decrease in deposition in the × direction, while the observation indicated a mounded deposit at a distance of about twice the building height. The positions of highest drift deposition in both methods were closer to the hut, and the slope of deposition in method (b) was somewhat steeper than that observed. The selection of a value of n greatly influences the deposition deduced from experiments. In the present experiments, the results obtained by method (b) agree fairly well with the observations; thus, method (b) may be useful in estimating the skirt configuration of the deposit in an improved experimental technique.

Fig. 7. Comparison of deposit in wind-tunnel experiments to that for the observation hut in the initial stages of growth (observed values are for April 1978).
Figure 8 summarizes the similar experimental results for the ionosphere hut. The wind-tunnel experiments did not agree well with the observation. The discrepancy may arise from the complex wind regime around the hut on the corrugated slope and the difference in the prevailing wind direction and the building alignment.

Fig. 8. Comparison of deposit in wind-tunnel experiments to that for the ionosphere hut in the initial stage of growth [observed values are for April 1978).
To improve method (a), wind-tunnel tests using magnesium carbonate powder to simulate blowing snow are in progress with an open jet wind tunnel.
5. Discussion
Wind-tunnel experiments on scale models of elevated buildings at Syowa station indicated the usefulness of estimating the forms of snow deposition in the lee of buildings. Similar experiments were carried out by Sato and Hannuki (1978). They measured wind-fields around model buildings and discussed the change in snow deposition in the lee of elevated buildings with respect to the change of floor height. When the floor height became higher than 44% of the building height (floor to the roof), retardation in growth of the deposition to the leeward became obvious. This suggests that the optimum floor height of the elevated buildings should be about 44% of the building height. But this experiment disregards the terrain configuration and the relative wind direction to the building. When taking these factors into consideration, it may be safe to take the optimum floor height about 44%.
The standard height of elevated buildings at Syowa station is 1.5 m, which is about 50% of the building height. This is a rule of thumb, but the appropriateness of this height is supported by the present wind-tunnel experiments. Further experiments and in-site observations will contribute to improved design concepts of elevated buildings to be constructed on ice-free rock in Antarctica.


