


Introduction
The referendum presented the UK electorate with a binary choice: to remain in or leave the EU by the decision of a simple majority. On 23 June 2016, 52 per cent voted to leave the EU, determining which of the futures the country would pursue. While our ‘modal’ forecast published in the UK chapter of the May Review was predicated on the assumption of a vote to remain, we published a set of detailed leave scenarios in Reference Baker, Carreras, Ebell, Hurst, Kirby, Meaning, Piggott and WarrenBaker et al. (2016) and Reference Ebell and WarrenEbell and Warren (2016) that illustrated how we expected the profile for the UK economy to change were an exit from the EU chosen. While not an exact replica of these leave scenarios, the forecast presented here has much in common with them. Indeed, data on post-referendum developments have done little to change our view about the mechanics of how this political-economy shock will crystallise over the course of the coming months and years.
We expect heightened uncertainty, a tightening of financial conditions and a spike in inflation due to the depreciation of sterling, all of which will generate a downturn in the UK economy. We forecast GDP growth to slow from 1.7 per cent in 2016 to just 1 per cent in 2017 (figure 1). Domestic demand is expected to contract by ¾ per cent next year as both consumer spending and private sector investment shrink. Offsetting this is a boost from net trade as the fall in sterling improves the competitiveness of UK exporters. This downturn is expected to be only temporary, with growth prospects ameliorating in 2018 and beyond.

Figure 1. GDP growth fan chart (per cent per annum)
There are two distinct channels through which we expect the decision to leave the EU to affect the UK economy's evolution. The first is a combination of heightened uncertainty and deterioration in financial conditions. These are only temporary and in aggregate weigh on domestic private sector spending and investment decisions (see Reference Baker, Carreras, Ebell, Hurst, Kirby, Meaning, Piggott and WarrenBaker et al., 2016). The second is the long-run impact that stems from the new relationship with the EU and the rest of the world (see Reference Ebell and WarrenEbell and Warren, 2016). At the time of writing, this future relationship with the EU remains uncertain. We have assumed that the relationship the UK migrates to is based on the UK re-joining the European Free Trade Association (EFTA). The process of withdrawal from the EU and initiating a new relationship with the EU is discussed in Box A. This is similar to the ‘Switzerland’ scenarios illustrated in Reference Ebell and WarrenEbell and Warren (2016). The paths for alternative relationships with the EU, based on their scenarios are reported in figure 1.

The ONS preliminary estimate for GDP suggests that economic growth increased from 0.4 per cent per quarter in the first quarter of this year to 0.6 per cent per quarter in the second. This estimate appears to suggest a robust pace of growth pre-referendum. However, NIESR's estimates of the monthly pattern of growth suggest otherwise; the robust growth in the quarter is attributable to month-on-month growth in April, with the economy falling back through the subsequent two months. Monthly data are noisy, and so should be treated with some degree of caution as one attempts to interpret developments in the fundamentals of the economy at this frequency. Nonetheless, the within-quarter profile for GDP is of particular interest given the presence of the referendum and the economic and political uncertainty generated by this event.
At the time of writing we are only a month past the referendum result. Data on the post-referendum period is sparse and comprises largely of ‘soft’ data from sources such as surveys of business sentiment and consumer confidence and the Bank of England's regional Agents' Summary of Business Conditions. Overall, what we do have points towards a significant deterioration in performance of the economy post-referendum. It will be some time before ‘hard’ data for the current period is published. For example, the ONS preliminary estimate of GDP for the third quarter will be published only towards the end of October, and even then it will be based on just 44 per cent of the eventual data, with the rest generated from the ONS nowcast. We expect the economy to shrink in the third quarter of this year, by 0.2 per cent. This is in stark contrast to the forecast conditioned on a vote to remain in the EU (figure 2). We do not expect a technical recession – two consecutive quarters where GDP declines – but the central projection for the final quarter of the year is best described as flat (with just 0.1 percentage point growth). Estimates derived from stochastic simulations using our global econometric model, NiGEM, suggest there is around a 50 per cent chance of a ‘technical recession’ at some point during the period between the third quarter of 2016 and the fourth quarter of 2017, inclusive.

Figure 2. Real GDP growth (per cent per quarter)
Box A. Article 50: withdrawing from the EU
The process for withdrawing from the EU is set out in Article 50 of the Treaty of the European Union (TEU). Any attempt to use an alternative avenue is likely to be over-ruled by the European Court of Justice, because the purpose of creating Article 50 in the Treaty of Lisbon was to create a clear mechanism for a member state to leave the EU.Footnote 1 Once a member state gives notice of its intention to withdraw to the European Council, there is a two-year period of negotiation within which to reach a settlement. The settlement is concluded by consent of the European Parliament and the EU Council by a qualified majority vote (20 of the remaining 27 member states and accounting for over 65 per cent of the total population of the remaining states) and the British government. If the settlement has not been agreed at the end of the two-year period, then either an extension to the negotiating period is agreed by unanimous consent of all other 27 member states or the UK leaves the EU without a settlement.
No country has left the EU. While Article 50 is admirably short, it is not very precise and the devil is likely to be in the detail. It is clear that the EU cannot force, or coerce, the UK to submit its Notice to Withdraw, but equally the UK cannot make any changes in trade or migration or other areas of policy which are governed by the EU until it has formally left the EU. Therefore, a prolonged delay in submitting a Notice to Withdraw extends the period by which the UK can make the changes promised during the referendum campaign. The government has indicated that it intends to submit its Notice to Withdraw in early 2017. During the two-year negotiating period, the UK will remain a full member of the EU except in regard to the EU's negotiating stance with regard to its own departure.
The Settlement Agreement is likely to be relatively short. The sort of issues that are likely to be included are cross-border arrangements, security arrangements and databases, transition arrangements, outstanding budgetary issues, legal and regulatory arrangements and an agreement on the vested rights of EU citizens and firms located in the UK and vice versa. Most importantly, the settlement must take “account of the framework of its future relationship with the EU”.Footnote 2 This clause refers to the future economic arrangement between the UK and the EU. Note that the legal document to support this possible new arrangement would be separate to the Settlement Agreement (see below).
Unresolved legal issues
Article 50 includes the requirement that a member state must withdraw “in accordance with its own constitutional requirements”.Footnote 3 This is particularly interesting for the UK which famously has an unwritten constitution. This raises a number of contrasting legal opinions. There are already three legal cases against the government on the basis of lack of appropriate procedure. For example, ‘Brexit means Brexit’ does not give any indication of Britons' preferences for the future economic relationship with the EU. In 1975 the UK had a referendum to join the European Community as a major commitment to a new economic relationship. This government has a mandate to withdraw from the EU, but it may not have a mandate to decide the terms of the new governance arrangement with our largest economic partner.
There are several areas of disagreement. First, should the UK hold a quick general election so that political parties can present their negotiating positions to the public, or should the UK hold a late general election once the negotiation is completed and the public can agree or disagree with the proposal on offer? A late general election would have to be held before the end of the Article 50 process, so presumably before the end of 2018. But such a delay would violate the Fixed Term Parliament Act introduced by the Coalition government in 2011.Footnote 4 Second, it may be desirable to vote in parliament before the Notice to Withdraw is submitted to the European Council, although the Prime Minister has prerogative powers in this regard. Third, can the UK rescind its notice to withdraw during the Article 50 process? It is quite possible that the EU changes to such an extent in the next two years that a different arrangement may emerge. It is probably the case that the UK could withdraw its notice to withdraw, but only with the unanimous agreement of the other member states.
Future trade agreements
If the UK does not reach an agreement with the EU on its future economic arrangements, the backstop position is the EU's Most Favoured Nation status under the World Trade Organisation (WTO). This would mean very modest tariffs on goods trade but far less access to services trade. However, the situation is somewhat complicated by the need for the UK to establish its own membership terms with the WTO as member, but no longer covered by the EU's membership. This will probably be less demanding than some suggest as the EU has not reviewed its membership terms after each round of enlargement and the WTO is unfortunately proving an ineffective enforcer of existing rules.
In all likelihood, the UK will have first to establish its new trade arrangements with the EU as the basis for agreements with other countries. Each of the UK's options involves a trade-off between degrees of access to the Single Market and control over economic policy levers. If the UK were to remain a member of the European Economic Area (EEA), the so-called Norway model, it would have access to, but would not be part of, the Single Market. The UK would not have a vote on the rules and regulations of the market or access to the same court in case of disputes. EEA membership involves accepting the free movement of labour, or at least with minimal temporary restrictions. UK exports would be subject to ‘rules of origin’ to tax the intermediate trade from outside of the EU. This would be invasive and expensive given the trend towards global value chains.
The second option is for the UK to re-join the European Free Trade Association (EFTA). This is similar to the EEA option, but with less access to the Single Market beyond goods trade. Switzerland is the most prominent EFTA member and is required to strike bilateral treaties with the EU to secure access to the Single Market for specific services only. This carries a significant cost as many services, for example financial services, are carried out through a third country such as the UK. In 2014 the Swiss voted in favour of restricting migration. The EU has made it clear that this is incompatible with access to the Single Market. Switzerland makes a smaller per capita contribution to the EU budget than Norway to reflect the lower level of market access. The legal document setting out the future UK economic arrangement with the EU must be unanimously agreed by all remaining 27 member states and ratified in many national assemblies.
Once the UK has left the EU it will have the freedom to negotiate its own trade agreements around the world. It will no longer be covered under the existing EU Preferential Trade Agreements which cover 53 mostly developing states. It will need to negotiate separate bilateral agreements. The UK would also need to consider if, and how, to be included in the US–EU Transatlantic Trade and Investment Partnership (TTIP) and other Free Trade Agreements currently under negotiation. The UK can seek to join regional trade agreements such as the Trans-Pacific Partnership, and enter into other negotiations such as the Trade in Services Agreement (TiSA).
The UK will be negotiating its own trade deals for the first time in over four decades. Yet it does so at a time when there is very little appetite for striking new multilateral trade agreements. Fifteen years after its launch, the Doha Round has fallen into abeyance and the stockpile of trade restrictions that contravene WTO agreements is rising. This climate raises challenges for the UK. According to the OECD, over half of the domestic value added of UK exports comes from the service sector. Trade agreements that deepen market access, including the right of establishment and a single rule book and mutual recognition, invariably enter into the domain of domestic policy. For example, TTIP has carve-outs for areas of national sensitivity, but its intrusion into domestic policy is deeply unpopular. Whether the UK has more success or less influence outside the EU remains to be seen.
This box was prepared by Angus Armstrong.
Note
1 Greenland (an autonomous territory of Denmark with roughly the same population as Tunbridge Wells) left the EU in 1985 under Article 48 of the TEU; originally article 236 of the European Economic Community.
2 Article 50(1) TEU.
3 Article 50(1) TEU.
4 This can be repealed by either a two-thirds majority in parliament (very unlikely) or a vote of no confidence in the government. It is difficult for a majority government to subject itself to a vote of no confidence.
As we have noted, the limited soft data suggests a deterioration in economic performance, and this has led us to a modal view of a decline in GDP in the third quarter. A deeper contraction in output in the near term poses a noticeable downside risk to the forecast. The signal we are able to extract from the coming months' data releases will guide us in the adjustments to the modal forecast we make. Adjusting our forecast in this way means we are rationally responding to new information, minimising the risk of introducing bias into our forecast process.
Uncertainty, in particular, is expected to weigh on business investment decisions this year and next. Uncertainty measures were elevated prior to the referendum, as NIESR's own uncertainty indicator reported in figure F1 shows (see Baker et al., 2016 and Box F). The outcome of the referendum has not led to a dissipation of uncertainty. Far from it; uncertainty remains elevated.
Box B. Immediate financial market movements post-referendum
Equities
As trading opened on 24 June, in the wake of the announcement that the UK had voted to leave the European Union, the FTSE 100 dropped by 8 per cent initially, to close the day down by 3.1 per cent (figure B1). However, by the following Wednesday the index had fully regained its post-Referendum losses in sterling terms and on 11 July closed at its highest value since August last year. Volatility, which had peaked a week before the referendum, is now at its lowest level this year.

Figure B1. UK equity indices, 1 June 2016=100
This recovery reflects the large number of companies in the 100 index which are diversified by having operations outside the UK, and have gained from having earnings denominated in currencies other than sterling. The 250 index by contrast is composed of a higher number of domestic companies, and the drop in this index in response to the vote was deeper and has not seen the same recovery. Bank stocks listed in the UK fell even more sharply, and credit default swap spreads on major UK banks increased (table B1). Many property-related equities were also affected in a similar manner.
Sterling
Conversely the fall in the value of the pound since the vote to leave has seen no reversal over the past weeks. As of 14 July the pound was down 9 per cent on a trade-weighted basis and 8, 10 and 10 per cent against the euro, dollar and yen respectively. Since the referendum short-term sterling option volatility has decreased markedly (figure B2).

Figure B2. Sterling volatility, 1 June 2016=100
The fall in sterling reflects a weaker outlook for the UK economy, uncertainty around the nature of the UK's future relationship with the EU, an increase in the relative risk premium (see the UK text in this Review), and expectations of looser monetary policy.
Interest rates
Figure B3 shows how far interest rate expectations have fallen since the referendum vote. Whereas pre-referendum market expectations were for the first interest rate rise to occur around the middle of 2017, as of 13 July the base rate was not expected to rise above 50 basis points until June 2021.

Figure B3. OIS forward curve
On 14 July the Monetary Policy Committee voted 8–1 to hold the benchmark interest rate at 0.5 per cent, contrary to market expectations which had priced in a more than 80 per cent chance of monetary policy being eased. However, the Bank signalled strongly that a rate cut can be expected at the next meeting on 4 August, coinciding with the publication of the quarterly Inflation Report. Expectations of interest rates rose slightly in response to this announcement but still reflect an expectation that rates will be held at record lows for the next few years. The pound regained around 1 cent against the euro and dollar and stock market indices rose, but the effects were muted given that the outlook is still for a monetary policy loosening in the near future.
The falls in OIS rates on 24 June were not matched by equal falls in the LIBOR, causing a large increase in the spread in the weeks following the referendum (figure B4). However the spread fell sharply on 14 July as spot rates jumped up after interest rates were unexpectedly held at 0.5 per cent.

Figure B4. LIBOR 3 months – OIS spot rate 3 months
Government bonds
Sovereign bond yields fell the day after the referendum as investors sought safe assets (figure B5), with the German 10-year bond yield dipping below zero and the Swiss bond yield (not shown) now negative all the way up to 50-year maturities. UK yields fell by more than in the Euro Area, reflecting both a fall in the expected path of policy rates and a fall in government risk premia. Italian and Spanish bond yields initially rose on 24 June, perhaps over concerns about their sovereign debt in the event of contagion to the Euro Area from a UK slowdown, but have subsequently fallen to below pre-referendum levels.

Figure B5. 10-year sovereign bond yields
Note: All data considered is up to 14 July.
This box was prepared by Jessica Baker.

Figure 3. CPI inflation rate fan chart (per cent per annum)
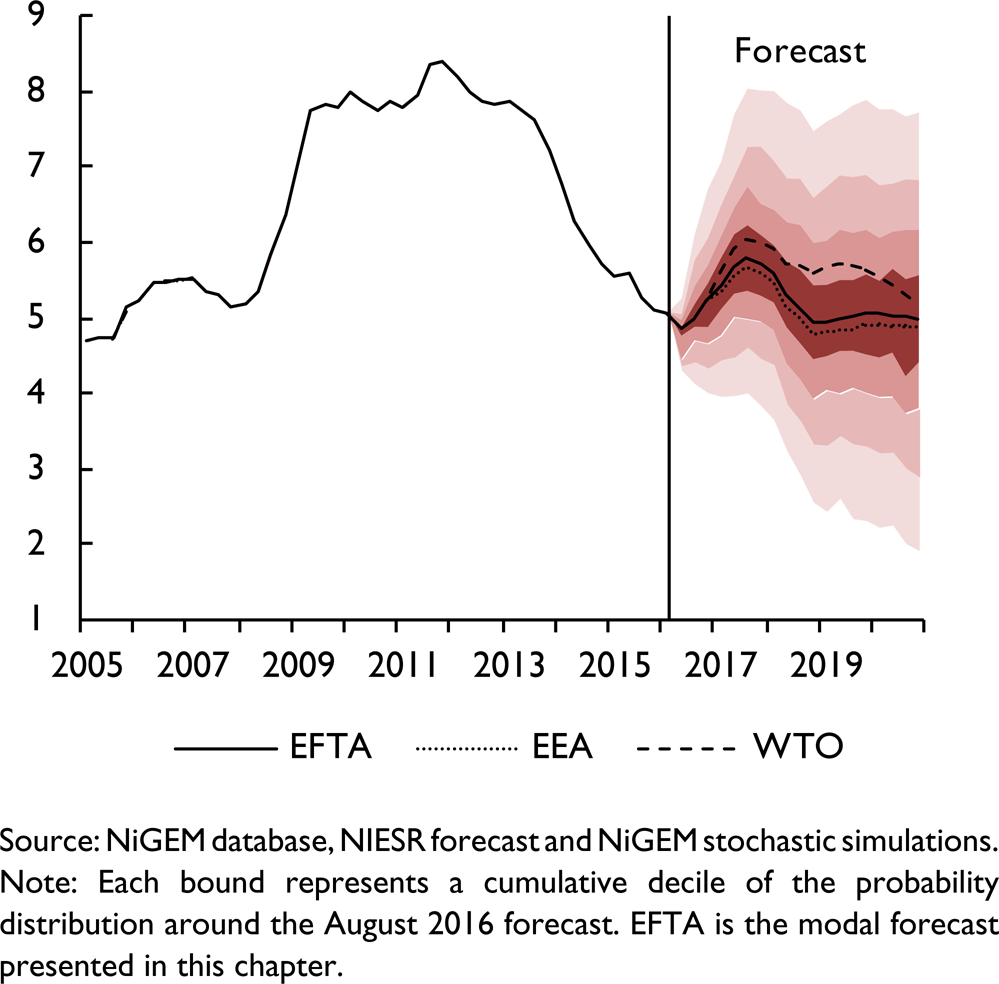
Figure 4. Unemployment rate fan chart (per cent of labour force)
The transition to a new Prime Minister has happened more quickly than expected, and this may help to alleviate some political uncertainty. Theresa May, the new Prime Minister, stated that “Brexit means Brexit” and has announced a new cabinet whose composition is designed to implement the UK's withdrawal from the EU and to develop its new relationships with the EU and the rest of the world. However, Article 50 of the Lisbon Treaty has not been triggered, and is unlikely to be until at least 2017. We expect uncertainty to persist throughout this year and only begin to decay in 2017. Crucially, we have assumed that the negotiation period lasts two years from the second quarter of 2017 and that a framework for the UK's future relationship with the EU is established by mid-2019 (see Box A for a discussion of the process of withdrawing from the EU).
Financial markets have been volatile since the referendum result (see Box B). There are signs of tightening financial conditions for some sectors. Commercial real estate prices have fallen rather sharply, while a rapid increase in withdrawals caused the temporary suspension of outflows in seven large commercial real estate funds. The prospects for the property market, generally, have deteriorated with forward looking indicators from RICS for both commercial and residential property prices suggesting declines in the near term. Additionally, share prices of listed property development companies have fallen markedly. The share prices of UK listed banks have also fallen sharply since 23 June. As Box B shows, the banking components of the FTSE Allshare Index declined by 7½ per cent to 14 July, compared to a rise of 3½ per cent for the broader Allshare index itself. What is more, the CDS prices of major UK banks have increased significantly. However, put into context the latter developments are not on the scale we experienced in the financial crisis, while the former are not on the scale, yet, of the commercial real estate price declines used by the Bank of England in their 2014 stress test (see Bank of England, 2016).
Nonetheless, these are still signs of tensions in financial and credit markets. We have assumed these tightening conditions peak at around 50 basis points across corporate borrowing risk premia and the equity premium, and that the wedge between household borrowing and deposit rates also widens by around 50 basis points in the fourth quarter of this year. As in Reference Baker, Carreras, Ebell, Hurst, Kirby, Meaning, Piggott and WarrenBaker et al. (2016) we assume risk premia remain elevated for six quarters from the third quarter of this year, before decaying towards zero at the rate of 50 per cent per quarter. In combination with elevated uncertainty, this weighs on investment over the next couple of years.
Sterling has moved sharply since May, and is now 10 per cent below its level against the dollar three months ago and 7 per cent against the euro compared with 3 months ago. We now expect the sterling exchange rate to finish 2016 at $1.33 and €1.19, with the trade-weighted effective exchange rate falling more than 13 per cent compared with the start of the year.
Sterling options-implied volatility spiked in the run-up to the referendum and, despite falling back, has remained elevated since, indicating a widening of the risk premium associated with sterling. Alongside this heightened perception of sterling risk, the anticipation of a monetary response to the referendum has also acted to depreciate the exchange rate. The loosening of the expected path of Bank Rate works through the uncovered interest rate parity (UIP) condition in our model to send sterling lower. In addition to this it is likely that the pricing in of additional balance sheet policies by the Bank of England is weighing on sterling, something we do not directly capture through the UIP specification.
As discussed in Reference Carreras and PiggottCarreras and Piggott (2016), this depreciation can be expected to provide stimulus to the economy akin to a further monetary loosening. The exact magnitude of this effect will depend on the ability of UK exporters to take advantage of the increased competitiveness, and their decision on how much of the newly acquired competitiveness to retain to build up margins.
We expect the unemployment rate to rise relatively modestly, from 4.8 per cent in the second quarter of this year to a peak of around 5¾ per cent in the middle of 2017. The exact magnitude will depend on how wage bargainers respond to the significant terms of trade shock and elevated inflation. Consumer price inflation is expected to peak just above 3 per cent per annum in the second half of 2017. In the long run, real producer and consumer wages will adjust downwards given the permanent loss of potential output that comes from leaving the EU. In the short run, the change in employment levels will in part depend on the degree to which employees resist the negative effect of the terms of trade shock. We have assumed that wages will be relatively flexible, as they have been since 2007, and that real producer and consumer wages adjust reasonably quickly, enabling employers to scale back their labour demand less aggressively. More downward real wage rigidity could well lead to less ‘labour hoarding’ and a sharper upward spike in unemployment. The corollary to our employment outlook is that productivity growth is expected to continue to disappoint. It also means that real consumer wages will not regain their peak until late 2024, two years later than had been projected had the UK voted to remain. Of course, such statements are inextricably linked to the future productivity performance of the economy. With the productivity puzzle remaining unresolved, this key domestic risk may well return to the fore once we have withdrawn from, and transitioned to a new relationship with, the EU.
Both the Prime Minister and the Chancellor of the Exchequer have indicated that they will ignore the primary target of the Fiscal Charter: to achieve an absolute surplus in 2019–20. The Charter does contain a ‘knock-out’ clause, which allows for the primary target to be suspended if growth over a four-quarter period is expected to drop below 1 per cent. However, it is for the Office for Budget Responsibility (OBR) rather than the government to determine whether the knock-out should be invoked. On the basis of our forecast, the requirements for this knock-out to come into effect would indeed be met. However, the announcements by the Prime Minister and Chancellor effectively consign the Charter to history. As we noted previously, the current Fiscal Charter is unnecessarily inflexible (Treasury Committee, 2015), while the inclusion of government investment inside the boundary of the primary target potentially constrains otherwise productive investment by the state. A new fiscal framework providing the Chancellor with forward looking flexibility and supportive of capital spending would be welcome, with the Autumn Statement at the end of the year a plausible moment at which to announce a change. It is in the Autumn Statement that we expect the OBR, in their first post-referendum forecast, to announce that they do not expect the government to achieve an absolute surplus in 2019–20.
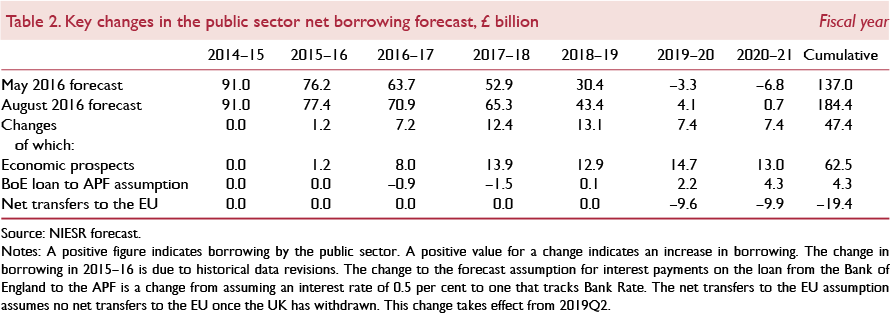
The fiscal projections presented here are based on announced fiscal plans and suggest that an absolute surplus will not be achieved over the course of this parliamentary term, given how we think the economy will evolve. Over the period 2016–17 to 2020–21 we expect the government to borrow an additional £47 billion. This includes the assumption that the government no longer pays into the EU budget from the second quarter of 2019, lowering the overall borrowing requirement by approximately £20 billion over the period 2019–20 to 2020–21. But as a per cent of GDP, public sector net borrowing is forecast to ease to 3.7 per cent of GDP in 2016–17 and drop below 3 per cent in 2018–19. The stock of gross debt does pass through 90 per cent of GDP by the end of 2017, but debt dynamics, with a nominal rate of growth of 4 per cent per annum, mean that the debt stock, as a per cent of GDP, drops rather rapidly, even with borrowing persisting through to 2020–21. By the end of our forecast horizon, the debt to GDP ratio is projected to have dropped by close to 9 percentage points.
Such borrowing developments should not dissuade the Chancellor from utilising fiscal instruments to support the economy, especially if the downturn proves worse than we expect, and given the record low borrowing costs the sovereign currently enjoys. Given the increased demand for safe assets after the referendum, it appears that any increase in the supply of gilts will be absorbed by the market.
It would seem that any fiscal response will be announced in the Autumn Statement towards the end of the year, a decision that may limit the instruments the Chancellor is able to use. The preference would be to expand capital expenditure, boosting much needed spending on productivity enhancing infrastructure, or social housing. However, by the end of the year, temporary adjustments to the tax system may prove more tempting, especially given the reduced lags in their impact.
In the meantime, the government is effectively leaving short-term macroeconomic stabilisation to the nine members of the Monetary Policy Committee (MPC). We expect a 25 basis point reduction in Bank Rate at their August meeting, and a further 15 basis point reduction at their November meeting. This conventional response could well be combined with a further round of quantitative easing and possible additional support for the banking sector via the Funding for Lending Scheme. We discuss the possible monetary policy response to the expected economic slowdown in the monetary conditions section of this chapter.
Monetary conditions
The monetary stance underpinning this forecast is significantly looser than that which we were assuming three months ago. In the immediate aftermath of the referendum result, market expectations of the future path of overnight rates fell back and began to price in a high probability of a 25–40 basis point cut in the summer of 2016 (figure 5). Expectations that this loosening would begin in July were disappointed by the outcome of the MPC's most recent meeting, although the minutes published alongside the policy decision provide clear forward guidance that, should the economy look to be slowing down as expected, a monetary loosening will probably be implemented at the August meeting.
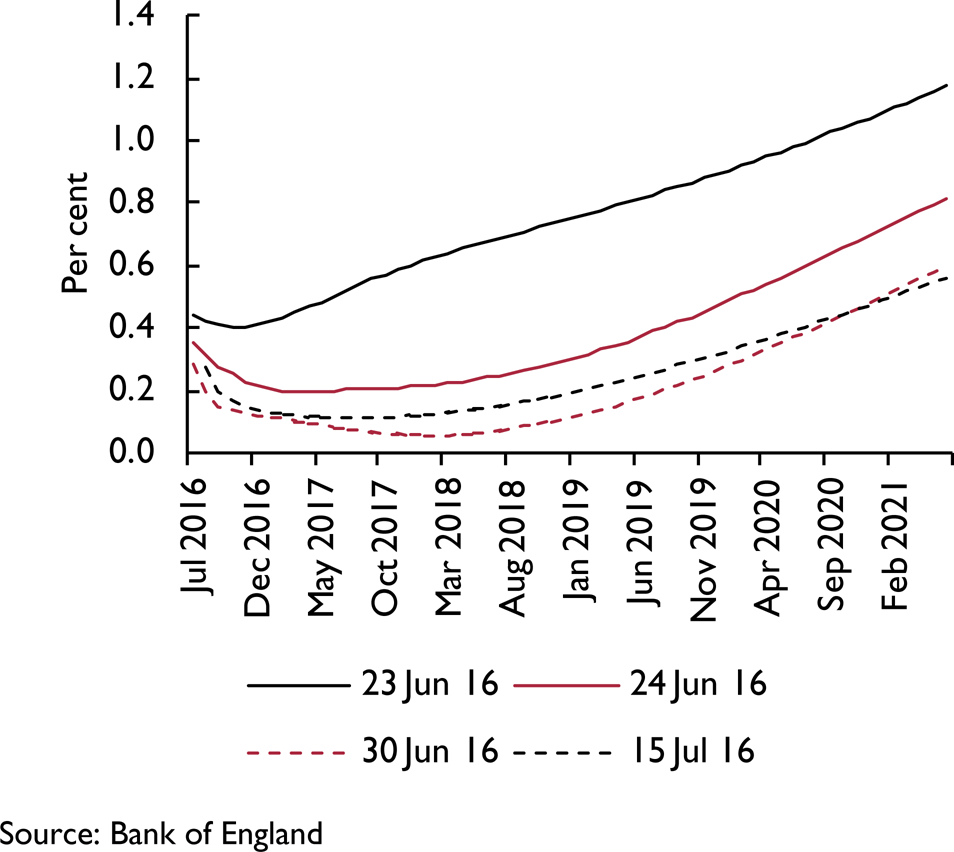
Figure 5. Changing market expectations of future overnight interest rates
A reduction in Bank Rate would appear to be the first logical step in the monetary policy response to the economic slowdown, and this has been strongly signalled by the MPC since the referendum. In the financial crisis of 2008 the MPC were of the view that the lower bound for Bank Rate was ½ per cent, but have now repeatedly communicated that this is no longer the case and that they are willing to cut below this level should the economic outlook require it. However, it would appear that the lower bound for Bank Rate has dropped only marginally, to zero. This gives room for a maximum of a 50 basis point cut before the primary instrument of monetary policy is constrained. A simulation of such a policy move using our global econometric model, NiGEM, suggests that it could add as much as ¾ per cent point to the level of GDP (figure 6).

Figure 6. GDP impact of monetary policy options
Our current forecast is predicated on a 25 basis point cut in Bank Rate at the August policy decision, with a second cut to 10 basis points in November. There remains a significant degree of uncertainty around the exact timing of the second cut, or even whether August may see a cut immediately to 10 basis points, but the likelihood is that by the end of this year, Bank Rate will be at its effective lower bound.
Complementing the traditional monetary instrument is likely to be some form of balance sheet expansion. With a precedent for buying UK government securities already firmly established by the previous quantitative easing programmes, this would seem the obvious candidate for a further programme. Such asset purchases work by reducing the premia built into long-term interest rates over and above the expected path of short-term interest rates. Reference Lloyd and MeaningLloyd and Meaning (2016) estimate these term premia for UK sovereign debt, suggesting that there remains scope for them to fall at longer horizons by as much as 100 basis points before they fall outside of the historic range (figure 7). A simulation of such a move in NIGEM implies that this could stimulate GDP by just over ½ of a percentage point (figure 6).

Figure 7. UK sovereign term premia
However, there are a number of important caveats to this assessment. First, in the past when term premia have been this low, or lower, the level of interest rate expectations has been much higher, leaving overall yields at positive levels. Now, were term premia on 10-year gilts to be reduced to zero, or even become marginally negative, all else equal, the 10-year yield would fall to 0.2 per cent or lower. It is not obvious that this is something that is desirable, and it certainly is not costless. For instance, given that the government liability curve is used to discount the future liabilities of corporate pension funds, a flattening of this yield curve implies an increase in pension fund deficits. Reference Baker, Bloom and DavisThe Pension Protection Fund (2015) calculates that just a 30 basis point reduction in gilt yields would increase the combined deficits of defined benefit pension schemes by £61.4 billion based on combined deficits of £285.3 billion reported at the end of March 2015.
Second, in the original QE programme, in order to reduce the yield by around 100 basis points, the Asset Purchases Facility (APF) had to make purchases of around £200 billion, or approximately 30 per cent of the outstanding gilt market. To achieve the same impact now it is likely that they would have to buy more than this, since part of the original effect was via a reduction in interest rate expectations, which now have little room to be squeezed further. Additional purchases of £300 billion would imply the APF holding over half of the existing nominal gilt stock, and given the desire to target purchases to medium and longer-term securities, far in excess of this for some gilt issues. This would almost certainly have consequences for market functioning at a time when investors are looking to hold secure, liquid assets (Reference Lloyd and MeaningLloyd and Meaning, 2016). For these reasons, the 100 basis point reduction in term premia is likely to provide an overestimate of the maximum impact of further purchases of gilts.
The other notable instrument of policy since the financial crisis has been forward guidance (see Reference Dale and TalbotDale and Talbot, 2013). With interest rate expectations muted and the forward OIS curve flat, it would seem that there is little scope to stimulate the economy by communicating a commitment to hold Bank Rate lower for longer. That does not mean that there is no role for forward guidance in the current policy action. With uncertainty currently one of the main drags on the economy, clear forward guidance of the MPC's reaction function would help to reduce at least one element of that uncertainty and could therefore lead to more activity. With a large range of potential future outcomes, the most useful action from the Bank of England may be to clarify what options it has available to it, and the circumstances under which each would be applied. Markets and investors can then place their own judgements on the relative likelihood of each outcome, and will be able to respond accordingly as it becomes more certain which state of the world will prevail.Footnote 1
Combining the 50 basis point reduction in Bank Rate (as an illustrative scenario, given we assume only a 40 basis point reduction in our forecast) with the purchase of £200 billion gilts (the maximum level of balance sheet expansion we think possible drawing from the gilt market) in a NiGEM simulation suggests there is scope for monetary policy to increase the level of GDP by 1½ per cent at the 2-year horizon before these policy tools reach their limits. Were the negative shock to the economy to be more severe than this, policy would find itself in deficit and needing to look for more novel instruments. Possible options include: venturing into negative interest rates, purchases in sterling corporate bond markets, direct lending to banks via a new funding for lending scheme, ‘helicopter money’ or monetary financing of fiscal stimulus. These policy options need to be more comprehensively assessed, both within the Bank and by external parties, and it should be a priority of the Bank of England to begin to communicate its thinking and invite a dialogue on each of them.
One difficulty with all the policy options mentioned above is that they operate with a lag, and so if implemented in the second half of 2016, their stimulatory impact would begin to become apparent in mid to late 2017. Given that we expect the slowdown to be most pronounced in the second half of 2016, it would appear there is little monetary policy can do to offset the near-term weakness. Additionally, the rising oil price and the dramatic recent depreciation of sterling are likely to introduce a significant near-term inflation. This will complicate the narrative of loosening monetary policy in the near term and makes clear communication of the transitory nature of the inflationary shocks essential. However, with subdued demand growth expected throughout 2017, there is nonetheless a role for monetary stimulus.
Given the uncertainty around additional measures, we have not included an assumption for an expansion of the asset purchase programme, or other measures into our central projection. However, one consequence of the looser path for Bank Rate is that it delays the point at which the Asset Purchase Facility is allowed to begin unwinding, pushing it almost beyond our published forecast horizon; to late 2021. Given that the APF's loan from the Bank of England pays Bank Rate, the expected reduction in the main policy rate will also reduce the cost of funding the existing QE asset holdings and have a positive effect for the public finances, leading to increased remittances back to the Treasury of around £2½ billion cumulatively by the end of fiscal year 2017–18.
Prices and earnings
The consumer price index rose 0.5 per cent in the 12 months to June 2016. While still extremely weak by historic standards, there are a number of factors that suggest this will be the first part of an acceleration of price growth over the near term. First, we have a more aggressive rise in oil prices on our baseline compared to the one we assumed in the May 2016 Review. Dollar oil prices have risen since May, with Brent crude exceeding $50 a barrel in early June. Despite prices falling back somewhat in recent weeks, the Energy Information Administration projections which we build into our forecast now expect prices to be just over $46 by the end of 2016, roughly $10 higher than we had pencilled in at the same point for our May forecast. As detailed in Box C, this upward revision adds inflationary pressure equivalent to roughly ⅓ and ½ of a percentage point to the 12-month inflation rate through the end of 2016 and 2017 respectively. A downside risk to our inflation forecast is the possibility that the more recent fall back in oil prices proves to be persistent rather than short-term volatility.
Second, sterling's recent depreciation is forecast to persist as expectations of relatively looser monetary policy in the UK and heightened sterling risk have led us to revise down the outlook for sterling against the dollar to an average of $1.38 in 2016 and $1.33 in 2017. Against the euro, we now expect sterling to lose ground and fall to an average of €1.24 this year and €1.19 next. This will directly add inflationary pressure through the imported component of the consumption basket (see Box C), but it will also further exacerbate the oil price increase when viewed in sterling terms (figure 8).

Figure 8. Dollar and sterling oil price developments since May 2016
As a result of this we have revised up our forecast for CPI inflation this year to ½ per cent, and for next year to 2½ per cent. Within this we expect at least a few months in which inflation is in excess of the 3 per cent upper bound for the monetary target in the second half of 2017. Although this should be short-lived, it will require Governor Carney to write at least a couple of letters to the Chancellor explaining why the target range has been breached and why policy is not tightening.
Consistent with June's increase in consumer prices, RPI inflation was 1.6 per cent in the twelve months to June, up from 1.4 in May and 1.3 in April. There are also signs of building price pressures in the production chain, with the persistent deflation in total and core input prices for UK producers subsiding from 4.4 and 2.2 per cent respectively in the twelve months to May, to just 0.5 and 0.4 per cent in the twelve months to June. This is before the recent depreciation of sterling which is almost certainly going to push up on the imported component of UK producers' inputs.
The wedge between RPI and CPI is expected to narrow due to falling house prices and stable effective mortgage rates. The 12-month growth rate differential is forecast to fall from just over 1 percentage point at the moment to closer to ½ a percentage point by the end of next year. As many benefits and investments are tied to RPI inflation, this will have the effect of bringing growth in earnings from those sources more into line with the increase in the cost of the official consumption basket that has National Statistics status.
Core inflation has remained relatively stable in the last three months, growing 1.4 per cent in the twelve months to June, in line with the average rate between 2001 and the end of 2008.
The price of the labour input for firms increased with the index of labour costs per hour growing 2.7 per cent in the first quarter of 2016 compared with the same period in 2015. Most of this came from wage costs per hour, which grew 2.6 per cent, while the movement was even starker in the private sector, where labour costs per hour increased by 3.3 per cent year-on-year in the first quarter of 2016. Growth in public sector labour costs per hour remained relatively subdued at 1.1 per cent for the same comparison. These developments are reflected in the earnings data with the regular pay metric for average weekly earnings increasing by 2.2 per cent in the twelve months to May 2016 after recording 2.3 per cent in April and 2.2 per cent in March. With low inflation expectations at the one-year ahead horizon, this low level of nominal earnings growth is not as inconsistent with a tightening labour market as one may at first expect, and means that real earnings growth is relatively close to the average observed in the pre-crisis period. What will be crucial in the near-term evolution of earnings is how wages respond to the impending inflation discussed previously. If workers build this in to their wage bargaining then we should expect to see nominal earnings growth accelerate rapidly. If not, then the real value of earnings will quickly lose ground, reducing the purchasing power of those earnings for households. This in itself represents a downside risk to our forecast as it would be likely to weigh further on demand.
The shock of the vote to leave the EU requires a real wage adjustment. In the forecast we expect to see real producer wages lower by approximately 1½ per cent in 2017 relative to the remain counterfactual. The upside of this flexibility in real producer wages is that it minimises the degree to which unemployment increases. More real wage rigidity poses a downside risk to our forecast for the unemployment rate over the forecast period.
Real consumer wages are expected to contract marginally in 2017, falling 0.3 per cent compared with 2016, largely driven by higher inflation rather than weaker nominal wage growth. This does delay the point at which we expect real consumer wages to reach their previous peak, now forecast to happen in late 2024.
Box C. Changes to key assumptions over the past three months: implications for the inflation forecast
The past three months have seen considerable changes in some of the key series which underpin our forecast. For instance, the USD oil price rose significantly between April and June and, despite it falling back somewhat in recent weeks, the Energy Information Administration's projections that we build into our forecast are around 20 per cent higher for 2016, 2017 and 2018. Sterling has also moved dramatically against the dollar, reaching a 31 year low of $1.28/£. The move in the exchange rate amplifies the dollar increase in oil prices and so intensifies the inflationary impact of sterling-adjusted oil prices.
Sterling has not only depreciated against the dollar, but against a broad basket of currencies, with the trade-weighted effective exchange rate down more than 10 per cent compared to our forecast in May's Review. This lower level is expected to persist for the duration of our forecast horizon.
Expectations of monetary policy have softened across the UK, but also in the US and Euro Area. The greatest easing relative to three months ago is priced into Bank Rate, as the Bank of England is now expected to cut to near zero per cent over the coming months and maintain this stance for years, rather than months. There is also an expectation of other measures such as an extension of QE and the Funding for Lending Scheme.
Alongside these developments is a heightened level of uncertainty (see Box F) compared with our baseline forecast from May, which was conditioned on a vote to ‘remain’ prevailing in the referendum on membership of the European Union. Under that state of the world, we had projected an immediate reduction in uncertainty from the third quarter of 2016, falling to the historical average by early 2017. Conditioned on the post-referendum data and the current communication surrounding a delay to triggering Article 50, we have updated this assumption such that the level of uncertainty remains at the current elevated level until early 2017, and then begins to dissipate gradually over a two-year horizon. Even then we continue to assume that any post-EU settlement will have a negative impact on income compared to the ‘remain’ counterfactual.
To see the impact of these developments, we introduce each change in assumption to our forecast baseline from May, first one at a time, and then all simultaneously. The results of this exercise are in shown in figure C1.

Figure C1. Inflationary implications of changes in major assumptions compared with May 2016 Review
The clear implication is that the near-term outlook is considerably more inflationary as a consequence of recent developments. The largest driver is the depreciation of sterling, although it should be noted that this estimate is likely an upper bound as some pass-through from import prices to consumers may be delayed, or even permanently absorbed by importing firms. In our simulation, the peak inflationary impact from the depreciation of sterling comes in the middle of 2017, before abating later in the year and into 2018. Given the lags associated with monetary policy, the looser expected stance does not begin to stoke inflationary pressure until early 2018, and into 2019. Similarly, the disinflationary impact of heightened uncertainty takes time to emerge as delayed or cancelled investment decisions weigh down on demand.
When taken together, the additional inflationary impact is around 2½ percentage points compared to our forecast in May. This would imply a brief spell of inflation in excess of 3 per cent in the first half of 2017, but this is likely to be short-lived as the exchange rate effect dies out.
This box was prepared by Jack Meaning.
Components of demand
The ONS's preliminary estimate of GDP indicates that output grew by 0.6 percentage points in the second quarter of 2016, a period ending one week after the EU referendum took place. This was in line with NIESR's monthly estimate of GDP, published on 7 July. Growth was robust in services and production industries while the construction and agriculture sectors contracted slightly. There has been little evidence of uncertainty damping economic activity in the run-up to the referendum.
We expect output to contract by 0.2 per cent in the third quarter of this year as falling domestic demand reduces GDP growth by 0.5 percentage point. Of this, 0.4 percentage point is due to a reduction in investment, while net trade is forecast to add 0.3 percentage point, while household consumption adds 0.2 percentage point.
Uncertainty surrounding the UK's exit from the EU is expected to continue to weigh on investment, which subtracts 0.3 and 0.5 percentage point from GDP growth this year and next respectively. Consumption, which grew strongly in the first half of 2016, is expected to add 1.5 percentage points to GDP growth this year before subtracting 0.1 percentage point next year due to rising import prices and declining real incomes.
Government spending plans are set out in nominal terms. Since around two thirds of government expenditure is measured on an output only basis (Reference PopePope, 2013) – for example, number of students in the education system – the government spending deflator is largely unaffected by inflation due to rising import prices if volumes remain fairly constant. In addition, the majority of government consumption is accounted for by the public sector wage bill and public sector wage increases have been capped at 1 per cent per annum until 2019. Thus higher inflation will not erode government spending in real terms to an appreciable degree. We expect government consumption to add 0.2 and 0.1 percentage points to GDP growth this year and next, respectively.
Net trade deducted, on average, 0.6 percentage point from GDP growth over the period 2012–15 and has continued to do so in the first quarter of 2016, subtracting 0.2 percentage point from output. Recent data from the ONS May 2016 UK Trade release suggest that net trade has added to output growth over the second quarter of 2016; the volume of goods exports has increased by 2.2 per cent between the three months to February 2016 and the three months to May 2016, while the volume of goods imports has only increased by ½ per cent. Differentiating by geographical area, the volume of goods exports to EU countries increased by £2bn while that to non-EU countries increased by £2.5bn. The muted increase in the volume of imports is explained, for the most part, by a reduction of imports from non-EU countries of £0.2 billion.
The weakness of the external sector is intimately linked to anaemic growth of our largest trading partner, the EU (figure A3). After eight years, the volume of goods exports to the EU reached its pre-recession level in May 2016. Looking ahead, uncertainties derived from the recent UK referendum are likely to weigh on demand from EU countries, dragging on the capacity to expand export volumes despite the recent sterling depreciation. We have maintained our forecast of a contribution of net trade to output of 0.3 percentage point compared to our previous Review, whereas we have revised the contribution for 2017 upwards by 1 percentage point to 1.8. The latter revision is explained by a fall in sterling which will improve the competitiveness of UK exporters and an expectation of a significant drop of import volumes driven by a contraction in consumer spending. This is discussed at length in the Household sector section of this chapter. The interested reader is referred to Box D for an analysis of the long-term implications of the outcome of the referendum on trade from a gross value-added perspective.
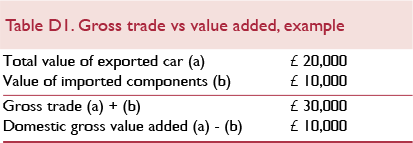
Box D. Weighing EU exit using gross value-added trade
A key question in the wake of the referendum to leave the European Union is what will be the impact on UK domestic output of reduced trade with the EU? A direct answer can be estimated using data on the domestic gross value-added (GVA) from exports collected by the OECD.Footnote 1
Domestic GVA from exports is a good measure of how much the domestic economy benefits from trade. This measure subtracts the value of imported inputs, leaving us with just the economic activity that took place in the UK. Table D1 illustrates this with the example of a car destined for export which has been assembled in the UK using components imported from abroad. Gross trade is the sum of the value of the exported car plus its imported components. Domestic value-added is the value of the car minus the value of the imported components. This value-added accrues to UK households as wages and firms as profits.
In 2011 (the most recent year for which data are available), total UK GVA was $2,286bn. The domestic GVA component of UK exports was $563.1bn, so that 24.6 per cent of the UK's total GVA was related to exports. This is illustrated in the first column of table D3. Breaking down further by sector (column 1 of table D3), services exports account for 14 per cent of total UK GVA. FIRE and business service exports are the most important of the service sectors, accounting for 8 per cent of total UK GVA, while other service exports account for 6 per cent. Goods exports (manufacturing, mining and utilities) account for 11 per cent of the UK's total GVA.
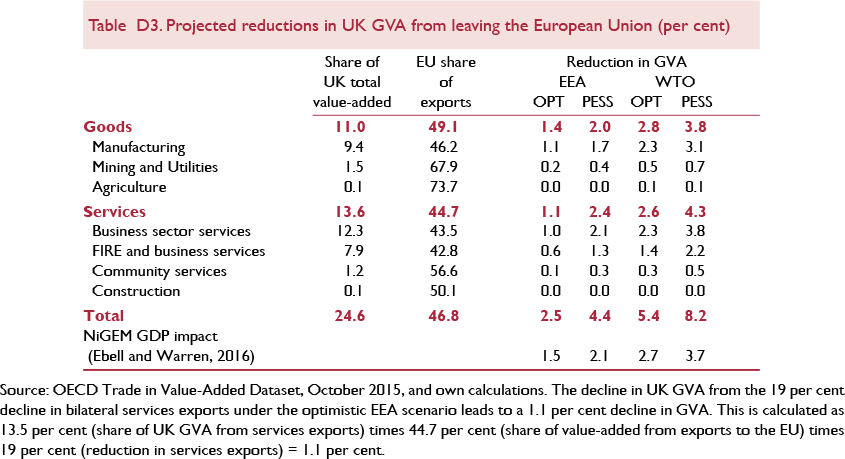
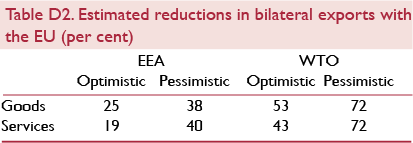
Next, we try to project the potential impact on UK GVA of two key scenarios for the UK's future relationship with the European Union. We do this by combining the GVA data with estimates of the reductions in exports in goods and services to the EU from the academic literature on empirical gravity models (table D2).Footnote 2 We focus on two key scenarios for the UK's future relationship with the EU: EEA membership and a WTO status with no free trade agreement with the EU.
Table D3 gives the projected reduction in GVA from the loss of access to EU export markets for the EEA and WTO cases. We find that the direct impact of export declines on GVA in the EEA scenario is expected to result in declines in UK GVA of between 2.5 per cent and 4.4 per cent relative to remaining in the EU. In the WTO scenario, the projected decline in UK GVA lies between 5.4 per cent and 8.2 per cent. These are long-run impacts, which would fully materialise after the UK has fully adjusted to its new status outside the EU.
The projected reductions in UK GVA are somewhat higher than the estimates of long-run declines in GDP relative to the baseline of remaining in the EU derived from NiGEM in Reference Ebell and WarrenEbell and Warren (2016). The main reason is that using GVA data, we are able to account for the fact that trade is concentrated in higher value-added sectors such as financial intermediation and business services. This means that the GVA measure is capturing some of the impact on productivity, as we are accounting for the fact that higher productivity sectors, like financial intermediation, might be among the hardest hit by reductions in exports due to leaving the EU. Our NiGEM analysis in Reference Ebell and WarrenEbell and Warren (2016), on the other hand, does not differentiate between between high and low value-added sectors, and the core sectors do not include a productivity decline due to Brexit.
This box was prepared by Monique Ebell.
Notes
1 OECD Trade in Value-Added database, last updated October 2015.
2 Reference Ebell and WarrenEbell and Warren (2016) provide more detail on the gravity estimates of reductions in EU trade under EEA and WTO scenarios.
The UK's real effective exchange rate increased by 15 per cent over the period 2013–15. During the first half of this year it lost almost 8 per cent of its value as sterling depreciated by 6 per cent in the run-up to the referendum and lost an additional 9 per cent in the three weeks following the outcome of the referendum. We expect the real effective exchange rate to return to the 2013 level by the end of this year (figure 9).

Figure 9. Real effective exchange rate and competitiveness
The appreciation in the UK's real effective exchange rate, from the middle of 2013, was accompanied by a decrease in export price competitiveness. The decline in competitiveness was smaller in relative terms than the appreciation of the real effective exchange rate; a pass-through of less than 50 per cent, slightly less than suggested by estimates from the IMF (2015) who find that around 60 per cent of real effective exchange rate movements are passed through to export prices in the first year, falling to around half in the long run. We observe the same phenomenon when we compare the magnitude of the depreciation of the real effective exchange rate and the increase in export price competitiveness during the period between 2007 and 2009. One reason for this result could be that exporters took advantage of the depreciation to build up their margins after the onset of the Great Recession, especially given the large amount of uncertainty that surrounded that period and that, when sterling recovered part of the ground lost, they buffered against the potential losses in competitiveness by narrowing their margins.
Engrained in our forecast is an assumption that price competitiveness declines, in relative terms, by less than the real effective exchange rate (figure 9), which can be explained by exporters absorbing part of the depreciation into wider profit margins. Were exporters to decide to maintain profit margins, growth in export volumes could be larger than we have predicted.
Household sector
The June 2016 Quarterly National Accounts release by the ONS introduced a series of data revisions derived from methodological improvements in the way owner-occupied imputed rental is calculated, data updates on wages and salaries from HM Revenues and Customs and revised household gross operating surplus estimates. As a result, the saving ratio, which includes the adjustment for changes in net equity of households in pension funds, has been revised upwards by 1.4 and 1.9 percentage points in 2014 and 2015, respectively, to 6.8 and 6.1 per cent (see the July 2016 ONS Economic Review report).
Real personal disposable income (real income henceforth) grew by 3.5 per cent in 2015. We forecast real income growth of 4 per cent for this year, partly explained by a strong data outturn for the first quarter of 2016, which saw real income growing by 5.4 per cent on an annual basis, and expect a strong second quarter, supported by favourable dynamics of employment and low energy prices. However, our view is one of more subdued growth in the second half of this year and next, as households' purchasing power is eroded by a negative terms of trade shock derived from the recent depreciation of sterling and elevated inflation. We have revised our forecast for growth in real income for 2017 downwards, by 1.4 percentage points, to 0.8 per cent.
In June 2016 the ONS published for the last time the seasonally adjusted mix-adjusted house price index that feeds into our forecast. It has been replaced by a broader measure, which we will refer to as the UK house price index. The new UK house price index draws from data on mortgage and cash property transactions, as opposed to mortgage data only. It has expanded the set of property attributes, in particular floor space of property, to model house price data and it has moved from a weighted arithmetic mean to a geometric mean to average house prices (see ONS, 2016). The latter modification makes the new house price index less sensitive to extreme valued property, which may be important if cash transactions are correlated with the value of property.
According to the new UK house price indices, house prices increased, on average, by an annual rate of 8.2 per cent in the three months to May 2016 compared to 7.4 and 5.9 per cent in the three months to February and November, respectively. The Halifax and Nationwide indices, which act as leading indicators, suggest that house price inflation has marginally eased off recently. According to Halifax, house prices increased, on average, by an annual rate of 8.5 per cent in the three months to June 2016 compared to 9.9 and 9.7 per cent in the three months to March 2016 and December 2015, respectively. The figures reported by Nationwide are 4.9 per cent in the three months to June 2016 compared to 5.0 and 4.0 per cent in the three months to March 2016 and December 2015, respectively.
The strong performance of house prices during the first half of the year is, at least partly, explained by the strong reaction of demand for house purchases to the April 2016 increase in the Stamp Duty tax rate for buy-to-let properties and second homes announced in November's 2015 Autumn Statement. As expected, after a policy-induced surge in demand, activity in the market has softened markedly since our May Review. Data on the volume of residential property transactions from HM Revenues and Customs show a decline to around 89 thousand in April and May 2016 after a peak of 153 thousand in March 2016; a level slightly below the average level of transactions in the year to February 2016 of 103 thousand per month, see figure 10. This decline in activity is in accordance with previous episodes of sudden increases in the number of transactions induced by changes in policy, such as the December 2009 spike associated with a temporary increase in the lower threshold of the Stamp Duty Land Tax and the other peak in March and April 2012 that coincided with the ending of the first time buyer's Stamp Duty tax relief.

Figure 10. Residential property transactions (thousands, seasonally adjusted)
Data from the June 2016 Bank of England Money and Credit report show that mortgage approvals for house purchasing experienced a marked decline in March and April 2016, when approvals fell by 3.1 and 6.2 per cent, month-on-month, respectively, and have only partially recovered part of the volume loss in May 2016 with a 1.3 per cent increase. The difference between the data on property transactions and mortgage approvals is explained by the spike in the value of loans secured on property, which increased by 32 per cent – around £4 billion – in March 2016 according to data from the British Bankers Association. As with property transactions, the flows into the stock of loans secured on property have declined to levels slightly below those observed in the year to February 2016 (figure 11).

Figure 11. Monthly mortgage loans and capital repayments (£billion)
Given the robust dynamics of house prices during the first half of this year, we expect house price growth of 5.5 per cent for 2016. In contrast, we have slashed our forecast for next year and now expect house prices to decline by 3.6 per cent in 2017. This forecast is based on various pieces of evidence. First, most recent indicators suggest that activity in the housing market has declined. Data from the Royal Institute of Chartered Surveyors' (RICS) on buyers' enquiries, a proxy for demand, show a sharp decrease in May and June 2016 (figure 12). Instructions to sell, a proxy for supply, have also fallen sharply but our view is that the demand effect will dominate. Second, price expectations, which are highly correlated with 6-months-ahead inflation,Footnote 3 have also declined (figure 13). Third, various house builders associations have experienced strong declines in stock market value (figure 14), which may be indicative of pessimism around the housing sector. Finally, our view is that the increase in uncertainty that has accompanied the outcome of the UK referendum may have introduced delays in consumer's plans to purchase property. A drop in mortgage rates following the expected decline in Bank Rate could offset the decline in demand. However, our view is that mortgage rates will decline by less than Bank Rate and the magnitudes involved will not suffice to compensate for the dynamics in demand.

Figure 12. Buyer enquiries and instructions to sell (net balance, seasonally adjusted)

Figure 13. Price expectations (net balance, seasonally adjusted) and 6 months-ahead house price inflation

Figure 14. Stock market price index
Aggregate demand in the first quarter of 2016 was sustained by consumer spending, which contributed 1.7 out of the 2 percentage points annual growth in GDP. Data from June 2016 Retail Sales release, which provides a timely indicator and comprises around one third of total private expenditure, suggest that the rate of expansion of private expenditure will remain strong in this quarter: retail sales volumes grew by 1.6 per cent in the second quarter of 2016; the figures for the first quarter of 2016 and last quarter of 2015 were 1.2 and 1.1 per cent, respectively. However, we expect various channels to weigh down on consumer spending during the remainder of this year and next. Negative wealth effects coming from the expectation of a fall in house prices coupled with the pass-through of the depreciation of sterling to consumer pricesFootnote 2 should put downward pressure on consumer spending. On top of this, we project an increase in the spread between deposit and borrowing rates available from financial institutions as mortgage rates decline by less than our projected path for Bank Rate. Finally, as suggested by OECD (2016), heightened economic uncertainty should increase precautionary savings. The recent pick-up in demand for notes and coin may be some evidence of this latter effect (see the Commentary in this Review). We expect consumer spending to grow by 2.3 per cent this year and to contract by 0.1 per cent in 2017.
Our forecast for softer consumer spending and the projected rise in precautionary savings are driven by an increase in economic uncertainty, part of which may surface in labour markets leading firms to postpone hiring plans. This has brought us to revise our projection for the saving ratio upwards. We expect a saving ratio of 6.5 and 7.9 per cent this year and 2017, respectively. As a result, we forecast households deleverage at a faster pace than previously expected. We expect the debt to income ratio to decline by 2½ percentage points by the end of 2016, from a ratio of 139 per cent of income in 2015. Furthermore, we project income gearing – the share of income households devote to interest payments – to remain at historically low levels given the new projected path of Bank Rate (figure A5).
Supply conditions
Uncertainty has risen markedly following the EU referendum (see Box F). We would expect this to weigh on capital spending and hiring decisions but at the time of writing, there is little data available from which to gauge the extent to which this is happening. According to the Bank of England's Agents' Summary of Business Conditions, in the month prior to the referendum, investment and employment growth intentions in both manufacturing and services were little changed, although all four series have been on a downward trend since the third quarter of 2014 (figure 15). These series indicate modest growth in business investment, and largely unchanged employment over the coming twelve months. Since the referendum, the majority of firms contacted by the Bank do not expect the referendum result to affect their capital spending in the near-term, but around a third expect some negative impact over the coming twelve months. The CBI Investment Intentions Survey reports that the most cited factors limiting investment in the second quarter of 2016 were uncertainty over future demand (46 per cent of respondents) and low net return (39 per cent of respondents). The proportion of respondents citing these factors is around the average over the past two years.

Figure 15. Investment and employment intentions
Box E. FDI and growth
Foreign direct investment (FDI) is the change in the stock of total capital owned by non-residents and its impact on economic growth can typically be split into two separate issues. In the short run, a sustained level of FDI inflows can add support to a sequence of current account deficits negating the need for currency depreciation. The durability of FDI inflows relative to other forms of capital inflows may also reduce the risk of excessive currency volatility.Footnote 1 In the longer run, FDI may be closely related to economic growth. Strong net FDI inflows, other things being equal, may be associated with a higher exchange rate than would otherwise obtain and may act as a conduit, via transitional dynamics, for a higher level of long-run income per head. The converse is likely to be true with a reversal in FDI being associated with a sustained exchange rate depreciation and lower than normal levels of economic growth.
A pioneering paper by Reference Borensztein, De Gregorio and LeeBorensztein et al. (1998) suggested that FDI provides an important vehicle for transferring technology from abroad, providing that a minimum level of human capital (or some other initial conditions) is in place, and may have substantive multiplier effects for, rather than just crowding out, investment. Reference CriscuoloCriscuolo (2005) further suggests that domestic manufacturing firms that are foreign affiliates make an important absolute contribution to labour productivity growth in the UK compared to domestic firms. But this is not a complete picture because data on services are rather rudimentary, even though they account for some 60 per cent of FDI flows in developed countries.Footnote 2 And over 85 per cent of inward FDI to the EU, for which the UK is the largest destination, is related to services and nearly 80 per cent of that is related to financial services.Footnote 3 The early parametric estimates (possibly reflecting any or all of vertical and horizontal spillovers, market size and dynamic benefits from competition) seemed to be in the order of a 0.5–0.8 per cent increase in the growth rate from a 1 percentage point increase in the ratio of FDI to GDP ratio but these have been revised down to something nearer to 0.1–0.2 per cent.Footnote 4
One clear problem for such aggregate studies is to be sure that they identify a causal link because FDI flows may simply be part of the transmission mechanism, or part of a complex set of inter-related economic structures and institutions, rather than a cause of growth per se. To illustrate, imagine a country, in the aftermath of a set of reforms in its product and labour markets, which is transitioning to a higher level of output per head under a process of capital deepening. If it is an open economy, that capital may flow rapidly in from abroad in the form of FDI and will tend to lead to an appreciation in the exchange rate. The process of capital deepening will tend to induce a temporary increase in the rate of economic growth until the new capital–output ratio has been reached, whereupon growth in income per head will tend to depend solely on the rate of technological process.
Alongside its relatively strong economic performance in the past quarter of a century compared to mainland Europe, the UK has been a strong net recipient of FDI since the early 1990s. The stock of FDI assets at end-2014 was some £1.2bn and of liabilities was £1.4bn (Reference LaneLane, 2015), and in each case over 40 per cent the source or destination of this FDI is the EU. Not only is the UK a final destination for FDI in the EU, the UK has been the biggest single recipient of FDI inflows in the EU with some 20 per cent of all inflows since 1993. Should an exit from the EU permanently lower UK GDP, we might reasonably expect FDI to act as part of the transmission to a lower level of GDP or economic activity, along with a lower exchange rate. Although FDI flows are noisy and hard to measure, a disorderly or extended process of exit from the EU therefore may further disrupt FDI flows and add further downward impetus to economic growth.
This box was prepared by Jagjit Chadha.
Notes
1 Catao and Milesi-Ferretti (2013).
A more dismal picture of the economy is presented by the post-referendum Deloitte CFO survey which indicates that optimism fell markedly in the second quarter of 2016.Footnote 4 The net balance (proportion of CFOs reporting that they feel more optimistic about prospects for their company compared to three months earlier minus the proportion who feel less optimistic) reached −69.9, the lowest level on record. Accordingly, planned investment and hiring have fallen sharply with net balances (proportion of firms planning to increase capital expenditure/hiring minus proportion planning to decrease over the next twelve months) of −78.7 and −81.9 respectively.
The Bank of England's Credit Conditions Survey (conducted before the referendum) reports that the overall availability of credit to corporates has remained broadly unchanged over the past nine quarters. The Deloitte CFO survey indicates that credit conditions have been benign in recent years, although availability of credit has decreased marginally in the first half of this year.
Since 1993, the UK has received around a fifth of all FDI inflows to the EU (see Box E). FDI inflows are associated with long-run economic growth. Reference Borensztein, De Gregorio and LeeBorensztein et al. (1998) suggest that FDI may facilitate the transfer of technology from abroad and have a multiplier effect on investment. There is a risk that capital inflows may slow after the UK leaves the EU, relative to the counterfactual situation of remaining. The extent to which this occurs will depend on the UK's future trading relationships. Reference Ebell and WarrenEbell and Warren (2016) estimate that in the central scenario, where the UK's trading relationship with the EU becomes like that which exists between the EU and Switzerland, FDI inflows to the UK will drop by between 11 and 23 per cent in the long run which translates into a decline in private sector investment of 1.7–3.4 per cent.
Government bond yields reached record lows in early July as investors sought to minimise risk and central banks globally seemed likely to keep interest rates low for longer. This has offset a rise in corporate borrowing costs and as a result we are forecasting a drop in the user cost of capital in the second half of 2016. However, the effect of uncertainty on domestic demand is expected to dominate. Business investment was down 0.6 per cent in the first quarter of 2016 compared to the previous quarter. Our forecast is for business investment to contract by 3.8 per cent this year and around 5 per cent next year. Government investment plans are assumed to be unchanged from the March Budget with a contraction of 4.7 per cent expected this year.
The Bank of England's Agents' Summary of Business Conditions indicates that recruitment difficulties have eased in recent months but remain above normal levels (figure 16). There is however concern over a potential reduction in labour supply, in particular from firms that are heavily reliant on Eastern European labour. Figure 17 shows the level of long-term migration to the UK of EU and non-EU migrants over time. At present there is uncertainty over what leaving the EU means for migration levels since it depends on the outcome of negotiations over access to the single market. In the year ending December 2015, net long-term migration to the UK by citizens of other EU countries was 184 thousand compared to 188 thousand citizens of non-EU countries.

Figure 16. Recruitment difficulties

Figure 17. Long-term international migration to UK, previous 12 months
The unemployment rate fell to 4.9 per cent in May, down from 5 per cent in April. However we are expecting unemployment to increase in the near term as declining investment weighs on GDP growth. Employment is likely to be cushioned somewhat by a lack of downward real wage rigidity, as happened during the Great Recession. Reference Holland, Kirby and WhitworthHolland et al. (2010) estimate that for the UK, a decline in real wages of 1 per cent results in an offset in employment of around 0.9 per cent.
The less severe unemployment outlook comes at the expense of labour productivity growth, which we now expect to increase by just 0.9 per cent in 2017, largely as a result of capital shallowing. In terms of output per hour, labour productivity increased by 0.5 per cent in the first quarter of 2016 compared to the previous quarter. Hourly productivity is around 17 per cent below the level expected if pre-downturn trends had continued. A downside risk to our forecast is that meaningful productivity growth will fail to materialise. HM Treasury (2016) assumed a link between openness and productivity growth in its assessment of the long-run impacts of leaving the EU on the UK economy, but we have not built such an assumption into our forecast.
Public finances
The outlook for the public finances is currently more uncertain than usual, with the incoming Chancellor intimating that he may use his first Autumn Statement to “reset” the government's economic policy, but as yet giving very little guidance as to what this might entail.
As always, our forecast is conditioned on announced spending and taxation policy, meaning that we have not attempted to pre-emptively build in policy changes that the Autumn Statement may bring about. As such, our forecasts for total managed expenditure and tax rates are almost entirely unchanged from May.
Despite this, our forecasts for the headline fiscal aggregates have moved notably from those we published three months ago. Government borrowing as a percentage of nominal GDP now reduces much more slowly and fails to reach a surplus until 2021–22. This leads the gross government debt stock to rise to just over 90 per cent of GDP in 2017, before easing back to around 77½ per cent of GDP in 2021. Public sector net debt is forecast to follow a similar profile, peaking at just under 87 per cent of GDP, before reaching just under 75 per cent of GDP at the end of fiscal year 2021–22. Given the sharp fall in the share prices of UK banks, we have made no allowance for further sales of the government's equity stakes in Lloyds Banking Group and RBS, over the forecast horizon reported. Such asset sales could lower the debt trajectory by more than we currently project, were they to be used for debt repayments.
A number of factors influence this revision, with a broad breakdown presented in table 2.
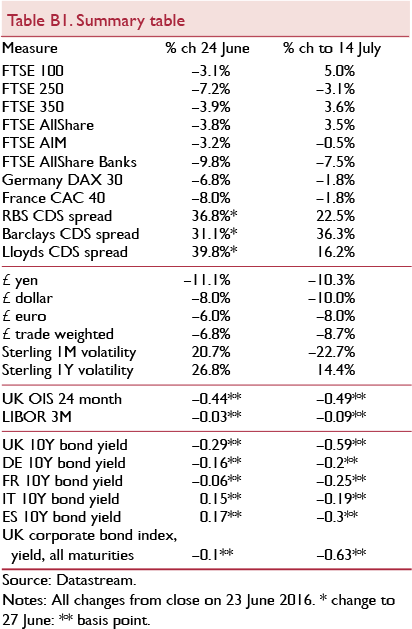
First, as with the rest of our forecast, the fiscal projections are influenced by the referendum and by the decision to leave the EU. There is a direct effect as a result of the UK no longer being required to pay into the EU budget, which we assume happens from the second quarter of 2019. Assuming all of this money is allocated to improving the fiscal balance, this lowers the government debt stock by just under £20 billion by 2021, relative to where it would have been. This assumption perhaps flatters the public finances. There is a reasonable chance that the UK will have to contribute to the EU budget in exchange for access to the single market, as is currently the case with Switzerland. There are also a series of indirect effects attributable to the referendum. The economic slowdown lowers the tax base and increases the expenditure burden associated with transfers and benefit payments. With no offsetting changes to discretionary policy, these automatic stabilisers will weigh on the fiscal balance and increase the government debt stock. Partially attenuating this, the monetary policy response to the slowdown, and the concurrent fall in term premia on UK sovereign debt, reduce gilt yields and thus lower the burden of government interest payments. Meanwhile, the additional inflationary pressure acts to offset the subdued growth in real output, leaving nominal output growth broadly unchanged. Taken together these referendum-related effects increase government borrowing by just over £62 billion.
Lastly, we have made a judgemental change to the evolution of the fiscal impact of the Asset Purchase Facility (APF); see Kirby and Meaning (2015) for a discussion of the fiscal implications of asset purchases by the Bank of England. The loan to the APF from the Bank of England was previously assumed to be charged interest at a rate of ½ per cent per annum, in line with current Bank Rate, for the duration of our forecast. However, more appropriate is that this rate of interest should vary in line with movements in Bank Rate over the monetary cycle. This implies that the expected cut in Bank Rate will lower the rate payable on the £375bn loan from ½ per cent to closer to 0.1 per cent by the end of the year. By increasing the margin earned by the APF on the assets it holds, this will increase the remittances back to the Exchequer by around £1 billion in 2016–17 and £1½ billion in 2017–18. However, as Bank Rate tightens in the medium term, the effect will flow in the other direction, increasing the funding cost of the APF and negatively affecting the fiscal position. By 2021–22, the net effect of this judgemental change amounts to an additional £4½ billion of borrowing.
In total, these changes increase government borrowing by around £50 billion over our forecast horizon. This is broadly consistent with the estimates derived prior to the referendum by Reference Armstrong, Lisenkova and LloydArmstrong et al. (2016). However, these estimates should be seen as a definite lower bound to the additional borrowing that may occur over the current parliamentary term as a consequence of leaving the EU. For instance, were any of the money saved from the removal of the EU budget contribution to be used to offset the reduction in EU spending on the UK, this would lower the saving from that channel and increase the additional borrowing required. Similarly, if there is an expansion of discretionary fiscal policy to offset the forecast economic slowdown, this would also add to the £50 billion figure.
Saving and investment
In table A9 we disaggregate the saving and investment positions of three broad sectors of the economy: household, corporate and general government. If a sector's investment is greater than its saving, it is a net borrower requiring external financing from the rest of the economy. This relationship can be aggregated to the level of the economy as a whole, where investment greater than saving requires net financing from the rest of the world. It is not possible to draw inferences about optimal levels of investment from the current account, rather just immediate funding requirements of the economy.
The household sector remains a net borrower from the rest of the economy. However, due to revisions in the underlying data series for both household saving and investment, current estimates of the net borrowing position suggest it is significantly smaller than these data suggested just three months ago. In 2015, the household sector is now judged to have borrowed 0.7 as opposed to 2.4 per cent of GDP in our forecast published in May 2016. This is largely due to revisions to household saving, for further details see the Household Sector section in this chapter.
We predict a modest increase in household saving in 2016 up to 4.6 from 4.3 per cent of GDP in the previous year. This is largely driven by a greater than proportional fall in the growth rate of consumption expenditure than that of real personal disposable income in the second half of the year as domestic demand conditions deteriorate. This increase in saving is expected to continue throughout our forecast period as real personal disposable income growth outpaces that of consumption. By 2021 we expect household saving to be around 8 per cent of GDP, a significant upward revision from our May forecast, where we had forecast household saving to be 4 per cent of GDP. Throughout our forecast period we expect household investment to remain stable. By 2021 we expect household investment to be around 5½ per cent of GDP. Given our projected paths for household investment and saving, this implies that we now expect households to be net lenders to the rest of the economy, lending around 2 per cent of GDP; this is in contrast to our May forecast where households were expected to remain net borrowers through to the end of the forecast period.
The underlying data which determines the saving and investment positions of the corporate sector were also revised. Investment was revised upward slightly while saving has been revised downward significantly. For example, in 2015 the corporate sector was judged to have saved 9.3 compared with 10.9 per cent of GDP in the May forecast. This implies that the corporate sector was a net borrower of 0.7 per cent of GDP from the rest of the economy, reversing the persistent trend from 2002 of this sector being a net lender to the rest of the economy. We expect a further fall in corporate saving this year, to 7.3 per cent of GDP. Despite a slight rebound in 2017 and 2018 to over 8 per cent of GDP, the general trend throughout the forecast period is for declining corporate saving. By 2021 we expect corporate saving to be around 6 per cent of GDP.
In the near term the increased investment risk premia coupled with weak domestic demand conditions lead corporate investment to fall slightly as a proportion of GDP in 2017 to 8.6 per cent from 9 per cent in the previous year. We expect corporate investment to pick up as the economy recovers from the slowdown, leading to an increase in the proportion to GDP from 2019 onwards. By 2021 we forecast corporate investment to be 9.1 per cent of GDP.
We therefore expect the corporate sector to remain a net borrower from the rest of the economy throughout our forecast period, requiring 2.1 per cent of GDP in 2016. This reduces to 0.4 per cent of GDP in 2017. As growth begins to accelerate from 2018 onwards we forecast corporate sector net borrowing to increase, reaching between 3 and 3½ per cent of GDP by 2021.
The general trends for saving and investment in the government sector remain broadly in line with those in our May forecast. Government investment is expected to be stable throughout the forecast period at around 2½ per cent of GDP. Meanwhile, government saving is still expected to switch from dissaving to positive saving. The main difference between our current and previous forecasts is the timing of this shift to positive saving. We now expect the government to continue dissaving throughout 2017, whereas in May we expected the saving position to be neutral. This change is caused by a reduction in tax receipts and an increase in transfers due to the expected slowdown in growth post-referendum. The general government sector is now forecast to start saving from 2018, and saving increases throughout the forecast period as fiscal consolidation persists in a more benign environment for economic growth. By 2021 we expect government sector saving to rise to between 3 and 3½ per cent of GDP. This implies that up until 2019 the government sector remains a net borrower from the rest of the economy. On the basis of current tax and spending plans and the outlook for the economy, we do expect the saving and investment positions of the government to balance in 2020.
Aggregation of the three broad sectors of the economy implies a markedly different path for the whole economy current account of the balance of payments compared to our May forecast, where we expected the UK economy to require significant financing from the rest of the world throughout the forecast period. We now forecast 2016 to be the peak of the deficit with the UK expected to require 6 per cent of GDP in external financing, after which this falls sharply to 3.2 and 1.1 per cent of GDP in 2017 and 2018. By 2020 the current account is forecast to be broadly in balance.
In recent years the UK economy has seen a widening of the current account deficit, a process which started in the second quarter of 2011. In the final quarter of 2015, the current account deficit reached a high of 7.2 per cent of GDP, and despite shrinking marginally in the first quarter of 2016, it remains historically large. Between the first quarter of 1955 and the second quarter of 2011, the current account deficit averaged 0.8 per cent of GDP, however more recently it has averaged 4.5 per cent of GDP.
The key constituent of the deterioration of the current account is the primary income account. From the beginning of 2000 to the second quarter of 2012, with the exception of three consecutive quarters from the final quarter of 2008, the primary income account had recorded a surplus. However, since the third quarter of 2012 the primary income account has been in deficit reaching the widest level on record in the final quarter of 2015, equivalent to 3.2 per cent of GDP, principally due to an increased deficit on direct investment. The ONS (2016b) has estimated that this deterioration is partly due to a fall in the rates of return on foreign assets which peaked in 2011 at 7 per cent on an annualised basis but have fallen every year since. In 2015 the ONS estimates they had fallen to 4.8 per cent on an annualised basis, and early estimates suggest that these have fallen further in the first quarter of 2016.
Reference LaneLane (2015) suggests that this fall in the primary income account is a result of previously UK-owned firms redomiciling to another country, leading to a fall in the direct investment assets and corresponding rise in liabilities. However there would also be a corresponding increase in the portfolio equity asset position. In this case there would be a deterioration of the primary income account but no subsequent change in the net international investment position. The implication of Reference LaneLane's (2015) argument is that the deterioration in the current account does not reflect accurately debt sustainability. IMF (2016) highlights a number of possible causes of the fall which affect both sides of the balance on direct investment. It cites the reduction in the marginal effective corporation tax rate from 30 per cent in 2007 to 21 per cent in 2015 which may have increased inward direct investment. It further suggests that the differentials in rates of return between assets and liabilities may be a result of weak growth in major partner countries, namely Euro Area economies. It also notes that before the referendum IMF estimates suggested the exchange rate was overvalued in the region of 12–18 per cent. The IMF's analysis suggests that at least part of the deterioration should be temporary.
Given that the exchange rate depreciated sharply after the referendum in nominal effective terms, this should lead to an improvement in the primary income account through the revaluation effects as receipts from assets denominated in foreign currency have increased in value. In our forecast this revaluation leads to a level shift in net factor income (figure 18), which now returns to surplus in 2018. While the depreciation of the exchange rate has moved back towards the IMF's pre-referendum calculations of fair value, the structural change to the economy that the vote for withdrawal from the EU constitutes may mean that the exchange rate still does not reflect a true equilibrium value.

Figure 18. Primary income and trade balances of the current account
Alongside the improvement in primary income balance we also expect an improvement in the trade balance, as the depreciation and subsequent increase in the domestic price of imported goods leads to a contraction in import volumes. The risks to the current account are largely on the downside. Any realisation of risks which lead to slower recovery in the primary income account or net exports remaining weak, would lead us to expect to see the deficit persist for longer.
Medium-term projections
Our medium-term projections describe the evolution of the economy from its current position of disequilibrium back towards its long-run equilibrium. However, the vote for withdrawal from the EU implies a significant impact on both the short run trajectory of the economy, and also the nature of the long-run equilibrium. For the purposes of our forecast we assume that the UK negotiates an EFTA type trade deal with the EU. However, given that at present there is no clear indication about the preferred trade deal once the UK has negotiated a withdrawal from the EU, this means that that this long-run equilibrium itself is necessarily uncertain. Reference Ebell and WarrenEbell and Warren (2016) provide an assessment of what the long-run impacts of three different trade models imply for the UK economy. They find that the in the long run, the EEA-type trade model is the least detrimental, while that of the WTO trade model is the most detrimental with the level of GDP expected to be 1.8 and 3.2 per cent lower than the remain counterfactual. The EFTA-type trade model, as is assumed in the current forecast, lies between these two estimates, with the level of GDP 2.1 per cent below the remain counterfactual in the long run.
It is generally true that certain factors that affect the future path of the economy can be predicted with some degree of accuracy over the medium term. These include broad demographic changes such as an ageing population and the general trend of continued net inward migration. However, the current government has committed to a policy which seeks to reduce net inward migration to less than 100 thousand citizens per annum. In the year ending December 2015, net long-term migration to the UK from non-EU countries stood at 188 thousand citizens (figure 17), which suggests this policy will be hard to implement. Therefore, the future levels of net inward migration add a further layer of uncertainty onto our medium-term projections.
The path to this long-run equilibrium is also uncertain as shocks, which are by definition unpredictable, will undoubtedly move the economy away from the path presented in table A10. We choose to depict the uncertainty of both the future equilibrium and the path which the economy takes to get there via a fan chart. Figure 1 depicts the possible future GDP paths encompassing three possible trade deals discussed in Reference Ebell and WarrenEbell and Warren (2016); this shows that the probability of a full year's contraction is one in ten, as is the probability that growth is greater than 2 per cent in 2017.
Productivity growth is the key determinant of the change in living standards over the longer run. Compared to our previous forecast, we have revised our near-term forecast for growth of output per hour worked downward to 0.9 per cent in 2017 and 0.7 per cent in 2018, from 2 per cent and 1.6 per cent respectively. This is largely a result of relatively robust employment growth supported by weaker real producer wages, which helps to partially offset the impact of weak economic growth. Between 2021 and 2025, we project an average rate of productivity growth of 1.7 per cent, in line with our previous forecast. The path for productivity in the medium term implies relatively little in the way of recovery, as the bounce back which would normally be expected is offset by the transition phase to the new trading model.
The transition to a new trading model has implications for the openness of the UK economy. Openness, as measured by total trade as a proportion of GDP, is flat in this forecast compared with growth in the counterfactual remain case. OECD (2016) and HM Treasury (2016) postulated a positive link between the openness of an economy and the productivity performance, which poses the key downside risk to our productivity forecast. In the event of this downside scenario materialising we should expect to see lower productivity growth in both the short and the long run.
Our revised monetary policy projections now incorporate reductions in Bank Rate in August and November 2016, rather than the increase we had assumed in our previous forecast, as the Bank of England seeks to provide stimulus to the economy given the expected slowdown throughout the remainder of 2016 and 2017. Bank Rate is expected to remain flat throughout 2017 at 0.1 per cent and we now assume that the first increase in Bank Rate will occur in the first quarter of 2018. Over the period 2021–25 we forecast that Bank Rate will average 3 per cent. There are risks to both sides of this forecast. On the downside, if the impact of the UK withdrawal from Europe is more severe than we have anticipated Bank Rate could remain at 0.1 per cent for longer. Conversely, on the upside, should the impact on productivity be more negative than we have forecast, then the negative output gap which exists in our forecast would be significantly smaller in magnitude, the subsequent persistent inflationary pressure could lead the MPC to tighten policy sooner.
The paths for exchange rates are determined by interest rate differentials. However, in the near term, risk may also play an important role. The immediate aftermath of the referendum saw a sharp depreciation of sterling, by around 6.5 per cent in nominal effective (trade-weighted) terms. The majority of this shift in exchange rates is expected to be permanent, however, as the Bank of England begins the process of gradual interest rate normalisation from the first quarter of 2018, sterling gradually appreciates. Through the years 2021–25 we expect sterling, on average, to appreciate by a quarter of a per cent per annum.
The near-term outlook for consumer price inflation is driven by the post referendum depreciation of sterling, and the upward pressure that stems from revisions to the assumed path for oil prices, based on EIA forecasts. The consequence of these changes to our forecast is that we have revised our forecast for consumer price inflation upward significantly, to 2.5 and 2.8 per cent per annum in 2017 and 2018 respectively, up from 0.9 and 1.9 per cent per annum respectively. As discussed in the Prices and Earnings section of this chapter the impact of these is expected to be temporary. As these effects drop out from the calculations inflation begins to moderate back towards the Bank of England's 2 per cent inflation target, where it remains on average between 2021 and 2025.
Our forecast for average earnings in 2016 and 2017 is broadly consistent with our May forecast with growth of 2.2 per cent per annum in each year. The key difference between these forecasts is that inflation is significantly higher in the current forecast. This means that our forecast for real wages is significantly lower than that of May, with a slight contraction in 2017 of 0.3. Between 2021 and 2025, we forecast earnings to grow at around 2.9 per cent per annum on average, revised downwards from 3.3 per cent in May.
The forecast slowdown of GDP leads to a slight increase in unemployment in 2017, to an average of 5.6 per cent, up from 5 per cent, on average, in 2016. However, this remains close to where we believe the long-run level of unemployment for the UK lies. As the economy begins to recover from the slowdown we expect unemployment to decrease slightly, averaging around 5.1 per cent between 2021 and 2025.
Public sector net borrowing is expected to fall throughout our forecast period but at a slightly slower rate than in our May Review, largely resulting from weaker tax receipts via the automatic stabilisers. We now expect the government to borrow 0.2 per cent of GDP in 2019, compared to lending 0.3 per cent of GDP to the rest of the economy. However, this simply postpones the return of public finances to balance, with this being achieved a year later. Public finances are expected to remain in balance over the period 2021–25. Public sector net debt is expected to fall from a peak of 86.8 in fiscal year 2016–17, to an average of 70.3 per cent of GDP over the period 2021–25.
Box F. Recent developments in uncertainty measures
The outcome of the referendum on the UK membership of the EU has been accompanied by a surge in uncertainty in many key political and economic aspects that are crucial in shaping the future economic landscape of the country. We review the predictions that economic theory has offered on the effects of uncertainty on economic activity and discuss the recent evolution of measures of uncertainty.
An early strand of the literature captured in the work by Reference OiOi (1961), Reference HartmanHartman (1972) and Reference AbelAbel (1983) suggested that, contrary to common belief, uncertainty could lead to higher investment if marginal returns to investment were convex. Later on, Reference BernankeBernanke (1983), Reference PindyckPindyck (1988) and Reference DixitDixit (1989) showed that under the presence of sunk costs to investment, which render marginal returns to capital concave, a firm will delay investment projects following an increase in uncertainty as there will be value in waiting. Investing triggers a cost that cannot be recovered and therefore it is optimal for the firm to wait until the realisation of the uncertain outcome ensures sufficiently high expected returns.
Reference Leahy and WhitedLeahy and Whited (1996), using firm-level data, found empirical evidence of uncertainty exerting a negative influence on investment, thus giving support to the strand of work that suggested a negative influence of uncertainty on investment. Recent work includes Reference Chadha and SarnoChadha and Sarno (2002), who suggest that aggregate price level uncertainty, which is determined by the choice of monetary regime, may play an important role in the firm decision to delay investment; Reference BloomBloom (2009), who finds that higher uncertainty causes firms to delay investment and hiring as well as declines in productivity growth as the rate of reallocation of resources from low to high productivity firms is inhibited; Reference Bloom, Floetotto, Jaimovich, Saporta Eksten and TerryBloom et al. (2014), who find similar results within the context of a DSGE model extended to include uncertainty shocks and Reference Fernández-Villaverde, Guerrón-Quintana, Kuester and Rubio-RamírezFérnandez-Villaverde et al. (2015), who find that volatility in fiscal shocks also induces negative effects on economic activity within a New Keynesian model framework. There seems to be a consensus that uncertainty drives firms to delay their investment plans, which leads us to look into the recent evolution of several measures of uncertainty. Our own composite index of uncertainty, estimated at quarterly frequency, is displayed in figure F1. Although the low frequency of the index prevents it from capturing, except only marginally, recent movements in the underlying measures since the referendum, it is already apparent that uncertainty has increased rapidly. Reference ChadhaChadha (2016) explains how the various economic forecasts of the impact of a vote to leave the European Union may tend to increase uncertainty.

Figure F1. NIESR uncertainty index
Individual series
We look into the individual components of the composite index to obtain a more detailed picture. Figures F2 and F3 provide the within-month standard deviations of the FTSE 100 and 250 indices. Standard deviations on the index may provide information on the degree of uncertainty affecting demand and supply conditions in the UK as it reflects the difficulties that investors face at producing an accurate forecast of the future present discounted value of listed firms. We also look at different segments of firms included in the FTSE index given that each index comprises very different types of firms. Most importantly, the FTSE 100 index is made up of large firms that operate, to a large extent, in international markets and whose main revenue sources are in US dollars, which implies that their business model is less exposed to downturns in the UK domestic market. By contrast, the other index offers a more accurate description of the stock market travails that the average UK public listed firm faces.

Figure F2. FTSE 100: within-month standard deviation

Figure F3. FTSE 250: within-month standard deviation
As expected, higher volatilities have materialised to a very small degree when we restrict our sample of firms to the 100 largest. However, once we include firms that are more domestically oriented, volatilities do indeed seem to have increased in the past months, which suggests that (i) uncertainty measures focused on the largest firms may provide inadequate measures of domestic based uncertainty and (ii) the market perceives that UK oriented firms are subject to a larger degree of risk.
Another salient measure of uncertainty is 3-month ahead option implied sterling volatility. This series derives a measure of uncertainty from the price of contracts that agree on a value of the sterling exchange rate in three months' time. As can be seen from figure F4, sterling volatility has spiked up on the run-up to and after the referendum. That volatility has not subsided since the referendum suggests that investors are still unsure about the possibility of sterling being subject to further large adjustments. We can estimate time-varying measures of volatility for any asset price and these often underpin the implied volatilities in option prices. The VIX is one such index based on the US S&P 500. To the extent that financial prices are efficient, such measures may inform us about instantaneous financial price volatility but somewhat less about ‘true’ economic uncertainty.

Figure F4. Three-month ahead option implied sterling volatility
Text-based measures
All the measures we have reviewed so far have focused on financial market uncertainty. An alternative measure of uncertainty is a text-search based measure such as the Economic Policy Uncertainty index (EPU) by Reference Baker, Bloom and DavisBaker et al. (2015), reported in figure F5. This measure is constructed from the number of times a certain set of words appears in newspaper articles. As such, it reflects the level of concern in a country about a certain topic, which Baker and his co-authors interpret as a proxy for perceptions of uncertainty.

Figure F5. Economic Policy Uncertainty Index (EPU)
The EPU index for the UK has reached an historical high in June 2016, having already climbed up significantly in May 2016. A possible caveat is that since some large events take place in an economy, such as the financial crisis or the referendum, the population becomes more self-aware of these topics and, thus, the media outlets serve this demand by increasing the frequency of the set of words.
Conclusion
Hardly ever has the distinction between uncertainty and risk, as outlined in Reference KnightKnight (1921), been as relevant as in the present context. He defined risk as an event in which the probability distribution of the outcome is known, while uncertainty is defined as that event where each possible outcome is so dissimilar that it is impossible to assign probabilities. Political uncertainty currently gripping the country around our future relationship with the EU and the form and shape that our future trade deals with the rest of the world may take is one such example of the difference between uncertainty and measurable risk. Indeed the news that we will have a lower income from the decision to leave the EU is a risk to the outlook for the UK, but because we do not know exactly what form that exit will take, and when, we are left with considerable uncertainty.
In the presence of uncertainty, conventional measures of risk become less informative, because agents are unsure of how to translate the uncertainty into probability distributions. Nevertheless, this does not mean that uncertainty is not having an effect on the economy, quite the opposite.
This box was prepared by Oriol Carreras and Rebecca Piggott.
Notes
1 The VIX peaked at 25.8 on the day after the UK referendum. This compares to peaks of 40.7 following China's stock market crash on 24 August 2015 and 80.9 at the height of the Great Recession.


