INTRODUCTION
Over the past two decades, researchers from a range of disciplines have argued that archaeological and palaeoecological data should have a role to play in defining past processes that have an impact on the sustainability of modern practices (e.g., Costanza et al., Reference Costanza, Graumlich, Steffen, Crumley, Dearing, Hibbard, Leemans, Redman and Schimel2007). This has led to a variety of suggested methodologies, including the use of historical data to validate the outcomes of predictive computer modelling (e.g., Barton, Reference Barton2016), and the use of case studies to help define key social, technical, or environmental factors that can act to improve or inhibit systemic resilience (e.g., Nelson et al., Reference Nelson, Kintigh, Abbott and Anderies2010) or sustainability (e.g., Butzer and Endfield, Reference Butzer and Endfield2012). These are ambitious aims that require highly interdisciplinary approaches, the proponents of which often cite archaeology’s ability to define change over long periods and large spatial areas as the discipline’s greatest potential contribution to sustainability studies (Redman and Kinzig, Reference Redman and Kinzig2003).
Others, however, have suggested an alternative yet complementary approach, whereby detailed archaeological data such as geoarchaeological examinations can be employed to help define how individual farming practices functioned and changed through time (Sandor et al., Reference Sandor, Norton, Pawluk, Homburg, Muenchrath, White, Williams, Havener and Stahl2002; Homburg and Sandor, Reference Homburg and Sandor2011). Doing so can act to put modern landscapes and farming practices in their historical context (e.g., Hall et al., Reference Hall, Trujillo, Nakase, Strawhacker, Kruse-Peeples, Schaafsma and Briggs2013; Morrison, Reference Morrison2015) and can correct simplistic assumptions that evidence of cultural continuity constitutes evidence of sustainable resource use (Stump, Reference Stump2010) or that the abandonment of a practice demonstrates that it was necessarily unsustainable (for a discussion of which, see, e.g., Balée and Erickson, Reference Balée and Erickson2006).
The research reported here takes this geoarchaeological approach and is predicated on the recognition that cultivation not only alters landscapes but also alters both the structure and geochemical properties of soil (Entwistle et al., Reference Entwistle, Abrahams and Dodgshon1998). These modifications can affect agricultural potential in the short and long term, producing legacy effects that may be detectable centuries later by soil science and geoarchaeological techniques (Wilson et al., Reference Wilson, Davidson and Cresser2008). Understanding these changes and their potential impacts on agricultural systems in either the past or the present requires techniques that can detect (and if possible quantify) processes that take place at a range of spatial and temporal scales. Spatial scales range from landscape-level alterations, such as deforestation and soil erosion, to highly localised changes in soil structure, chemistry, and biological activity. Temporal scales can range from a few weeks to a few decades in the case of modifications such as the application of fertilizers, to those that can have legacies lasting years, centuries, or even indefinitely in the case of irreversible processes such as swamp drainage or peat extraction.
The geoarchaeological research and results presented here focus on Engaruka in northeastern Tanzania, an abandoned irrigated and terraced landscape that covers ~2000 ha and was occupied for ca. 400 yr prior to abandonment in the eighteenth century AD (Westerberg et al., Reference Westerberg, Holmgren, Börjeson, Håkansson, Laulumaa, Ryner and Öberg2010). The results include stratigraphic evidence demonstrating that much of the former cultivation area was artificially created by the construction and periodic extension of check dams to capture alluvial sediments, as well as studies of geochemistry and soil micromorphology that record distinct differences in the irrigation regimes employed in different fields or within the same plots at different times. Although focussed on an abandoned agricultural landscape, these techniques of investigation can also be profitably applied to areas that continue to be farmed, thereby providing a direct archaeological contribution to assessments of sustainability.
Site location
Engaruka is located in northeast Tanzania to the immediate east of the Crater Highlands, centred at 2°59.9′S, 35°57.4′E. The sediments on the site are formed from volcanoclastic parent material, forming alluvial fans in the southern area of the site and alluvial plains in the central and northern areas. The parent material is composed predominantly of calcitic basalt, feldspathoid nephelinite, calcium-rich plagioclase, pyroxene, and olivine, with potential additions of volcanic material from four nearby volcanoes (Fig. 1) that each produce a specific mineral signature (Mattsson et al., Reference Mattsson, Nandedkar and Ulmer2013). Soils in the area have been classified as Eutric Leptosols (Jones et al., Reference Jones, Breuning-Madsen, Brossard, Dampha, Deckers, Dewitte, Gallali, Hallett, Jones and Kilasara2013), but Westerberg et al. (Reference Westerberg, Holmgren, Börjeson, Håkansson, Laulumaa, Ryner and Öberg2010) also note areas of well-developed Andisols along the line of the Engaruka River. The Andisols primarily comprise 2:1 smectite swelling clays.

Figure 1 (colour online) The location of Engaruka within northeastern Tanzania and the location of the control sample site in relation to the volcanic tufts and the Crater Highlands. m asl, meters above sea level.
With sufficient water, these soils are favourable for agriculture (Westerberg et al., Reference Westerberg, Holmgren, Börjeson, Håkansson, Laulumaa, Ryner and Öberg2010). Current average rainfall is just 400 mm per year, however, meaning that farming today is only possible with supplementary irrigation drawn from the perennial Engaruka River, the catchment of which receives ~1000 mm of rain annually. Modern irrigation is thus reliant on water flowing down the Engaruka from the adjacent highlands (Fig. 1), but during wet years, agricultural production is also possible using water from three other watercourses (the Lochoro and Makuyuni to the north of the Engaruka and the Olemelepo to the south; Fig. 2), which in years of heavy rains flow during the two wet seasons (February to May and October to December).

Figure 2 (colour online) Map highlighting the extent of the 2000 ha site, the location of the North and South Fields (left), and an aerial image of section 11 and section 4 in the South Fields area (right).
Research background
Multiple archaeological surveys conducted by Sutton (Reference Sutton1978, Reference Sutton1998) have mapped abandoned artificial irrigation channels that drew water from all of these watercourses (Fig. 2), as well as from a now permanently dry river gorge with no local name—dubbed the “Intermediate North Gorge” by Sutton (Reference Sutton1978). This observation of abandoned irrigation channels leading from what are now dry or unreliable water sources (e.g., Sutton, Reference Sutton1998, Reference Sutton2004) has led to two hypotheses relating to the sustainability of the historical agricultural system: (1) that farming at Engaruka was probably always impossible without artificial irrigation, and (2) that declining river flows were probably the reason the agricultural system and associated settlements were abandoned (for discussions of which, see Sutton, Reference Sutton1998; Stump, Reference Stump2006; Westerberg et al., Reference Westerberg, Holmgren, Börjeson, Håkansson, Laulumaa, Ryner and Öberg2010).
Although this hypothesis of abandonment attributable to diminishing water supply is also the preferred interpretation here, this is not in itself sufficient to conclude that the system proved unsustainable because of the actions of the site’s inhabitants. This is because a reduction in the amount of water flowing within the Engaruka and adjacent streams could have been caused by a range or combination of factors, of which Sutton (Reference Sutton1978) lists deforestation within the river catchments, seismic disturbances to the watercourses, or regional climatic change. Of these potential factors, deforestation through tree felling or burning could be reasonably seen as an unsustainable practice if it can be causally related to hydrologic decline. The same could clearly not be said of seismic activity or of regional fluctuations in rainfall.
Any attempt to assess the sustainability of the agricultural system at Engaruka thus requires an interdisciplinary approach. Westerberg et al. (Reference Westerberg, Holmgren, Börjeson, Håkansson, Laulumaa, Ryner and Öberg2010), for example, combined radiocarbon dates from previous excavations within the abandoned settlements at Engaruka with a dated pollen core from Lake Emakat located 15 km to the northwest (as indicated in their fig. 4). This research concluded that the former agricultural system should be seen as resilient, arguing that the use of irrigation allowed farming throughout a comparatively dry period between ca. AD 1500 and 1670 (for pollen data, see Ryner et al., Reference Ryner, Holmgren and Taylor2008; for resilience, see Westerberg et al., Reference Westerberg, Holmgren, Börjeson, Håkansson, Laulumaa, Ryner and Öberg2010). However, this apparent correlation of archaeological and palaeoenvironmental data is merely suggestive of systemic sustainability and resilience because it is unclear how the inhabitants of Engaruka responded to these apparent changes in the rainfall regime. Were major phases of terrace and irrigation construction a response to drier conditions, for example, or were they primarily a means of exploiting opportunities created during wetter periods?
Research objectives
The archaeological fieldwork and sediment analyses reported here were designed to assess whether irrigation features and agricultural fields at Engaruka were constructed during periods of high or low water availability, and thereby to provide details essential to an assessment of the system’s sustainability. To achieve this, the project builds on the results of excavations carried out in the ~900 ha of abandoned fields to the north of the Engaruka River (Stump, Reference Stump2006). Based entirely on stratigraphic data for the sequence of field construction, these excavations demonstrated that agricultural plots in this area were built by capturing alluvial sediments entrained within canalized streams. On the basis of satellite imagery and ground surveys, it was thought probable that much of the field area south of the Olemelepo stream was also built through sediment capture (Stump, Reference Stump2006).
The specific aim of the fieldwork and analyses reported here was thus to test this hypothesis through excavation and geoarchaeological investigations and to provide further details of irrigation and cultivation practices. Doing so supports a broader project aim of questioning the role that archaeological and palaeoecological data can play in assessments of sustainability.
MATERIALS AND METHODS
Excavation methods
The fieldwork was carried out between September and October 2014. Archaeological excavation was undertaken by the removal and recording of individual lithographic units (i.e., layers within the stratigraphic sequence with distinct colours, textures, structures, or compositions of silt, sand, and clay). Where possible, the units were removed in the reverse order of their deposition. Each unit was assigned a unique record number, starting at 4000 to distinguish these from the numbers assigned during previous excavations. Events evidenced by the removal of a deposit (including erosion events and human actions such as digging of an irrigation canal) were assigned a record number in the same sequence. Sediment samples taken from within lithographic units were assigned unique numbers from a distinct number sequence, allowing multiple samples to be taken from individual units. However, for the sake of clarity, all samples are referred to here by reference to deposit record number only, where necessary distinguishing between upper, middle, and lower subsamples (e.g., deposit 4015_U).
Comparative off-site controls were collected from sediments adjacent to the seasonal Selela River, located 23 km to the south of Engaruka (Fig. 1). These control sediments are derived from similar volcanoclastic parent material and are located within an alluvial fan similar to those at Engaruka. There is, however, no evidence of former cultivation at the location of the control samples. It should be noted, however, that the process of sedimentation at the control location is not the same, but equivalent because they are both alluvial, the difference being that the alluvium from Engaruka was artificially captured (as the results will show; see also Stump, Reference Stump2006).
Soil sampling and macroanalysis
Undisturbed soil samples and bulk soils were collected in Kubiena tins (85×50×6 mm) from two excavated cross sections at Engaruka and from one exposed gully section at the control location (this gully having been cut back 1 m to avoid the risk of recent contamination). The undisturbed soil samples were removed from within and between lithographic units, with bulk soil samples collected directly behind the undisturbed soil sample locations. Macromorphological analysis was undertaken in the field through colour differentiation, semiquantitative particle-size characterisation of the coarse fraction, and hand texturing of the fine material. Measurements of pH were made on the bulk soil samples in the field using a HANNA Hi-98127 pHe44 pH tester (Table 1).
Soil micromorphology
Soil thin sections were air dried at 40°C and impregnated with polyester resin using standardised processing procedures (http://www.thin.stir.ac.uk [accessed July 29, 2016]). The soil blocks were mounted on glass slides, lapped, and then polished to 30 µm thickness. Each thin section was characterised using plane polarized light and cross-polarized light on an AxioScope A1 binocular microscope with rotary stage. Micromorphological classification (Table 2) was based on those proposed by Bullock et al. (Reference Bullock, Federoff, Jongerius, Stoops, Turina and Babel1985) and Stoops (Reference Stoops2003), with a coarse/fine limit of 50 µm.
Geochemical analysis
Quantitative analysis of archaeological sediments was carried out to measure nine inorganic elements commonly reported as being associated with anthropogenic activity and arable augmentation (Aston et al., Reference Aston, Martin and Jackson1998; Holliday and Gartner, Reference Holliday and Gartner2007; Wilson et al., Reference Wilson, Davidson and Cresser2008, Reference Wilson, Davidson and Cresser2009; Alexander et al., Reference Alexander, Cowley, Cussans, Davies, Dunwell, Goldberg, Halliday and Poller2012). These are: aluminium (Al), phosphorus (P), potassium (K), calcium (Ca), chromium (Cr), manganese (Mn), iron (Fe), zinc (Zn), and strontium (Sr).
The soils were air dried and sieved (2 mm), with Al, K, Ca, Cr, Mn, Fe, Zn, and Sr then analysed using an Olympus DELTA portable x-ray fluorescence (pXRF) analyser with an operating frequency of 530 MHz CPU, mounted in a flex stand. Standards—SiO2, National Institute of Standards and Technology (NIST) 2710a, and NIST 2711a (Montana II Soil)—were used to identify beam drift, with the calibration of the analyser undertaken prior to analysis. Five replicates were measured per sample for quality control. Because of significantly lower quantification limits, total P content was analysed using inductively coupled plasma optical emission spectrometry (ICP-OES) with a Perkins Elmer Optima 5300 OES using standard operating procedures (ChemTest, SOP 2430).
Data analysis
Grubbs’s (Reference Grubbs1969) test was used to inspect the data for outliers and to determine whether the data had a normal distribution. The Pearson correlation coefficient was used to measure the degree of linear association between variables. Correlation coefficients (r 2) presented in the text are statistically significant (P<0.05).
Results of pXRF and ICP-OES measurements were analysed using factor analysis by principal components analysis (PCA). Only factor loadings higher than 0.7 or more negative than −0.7 (i.e., with an r 2 of at least ~0.5, and therefore 50% of variance associated with a given principal component [PC]) are discussed in the text. PCA was done with the Minitab17 software using Varimax rotated solutions. Differences between the PCA sample scores at the three locations (section 4, section 11, and controls) were tested using analysis of variance.
Particle-size analysis (PSA) and magnetic susceptibility (MS)
PSA was undertaken using a Malver Mastersizer Hydro 2000 NU Laser Granulometer (MEH/MJG 180914) applying general purpose multigrade sand as a standard (40–100 µm).
The loose bulk soil samples were placed in ∼15 mL plastic containers and then weighed in grams to two decimal places. Low-frequency (0.465 kHz±1%) measurement was performed on the dry samples using a Bartington Instruments MS2, consisting of a Magnetic Susceptibility Meter MS2 and MS2B Dual Frequency Sensor. The sensor was calibrated using deionised water. Five replicates of all measurements were taken to estimate variability, and the mean calculated to determine the MS (units are expressed as SI); all measurements were calculated as follows:
 $$\chi \,{\equals}\,{{{\rm mass}} \over {10}}{\rm expressed}\;{\rm as}\;\chi \left( {{{10^{{{\minus}6}} {\rm m}^{3} } \mathord{\left/ {\vphantom {{10^{{{\minus}6}} {\rm m}^{3} } {{\rm kg}}}} \right. \kern-\nulldelimiterspace} {{\rm kg}}}} \right)$$
RESULTS
Stratigraphy
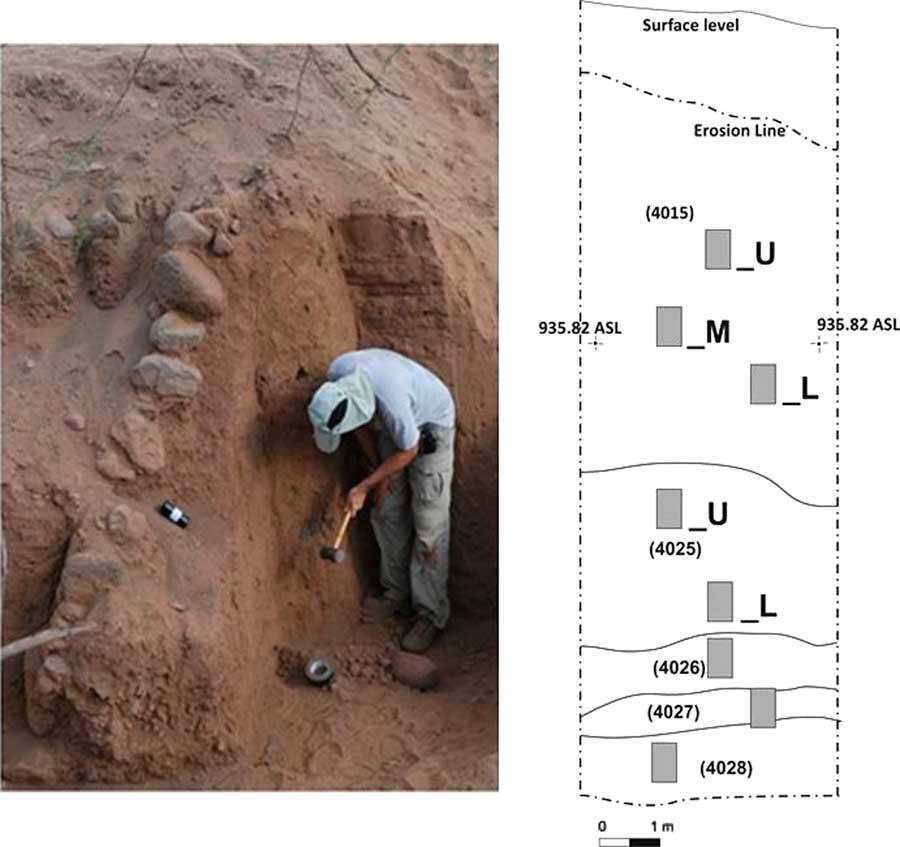
Excavation focussed on an open area centred at 3°0.745′S, 35°57.453′E (Fig. 2), a location previously interpreted as probably representing the remains of sediment traps (Stump, Reference Stump2006). A total of 18 cross sections were excavated to investigate deposits associated with drystone walls—these drystone walls being visible either on the surface prior to excavation (as in the wall marked as 4000 in Fig. 2) or exposed in the side of a head erosion gully initiated by the heavy rains of the 1997–1998 El Niño (this gully is visible oriented roughly east to west in Fig. 2). The stratigraphic results from section 4 and section 11, the representative cross sections, are summarized subsequently (Fig. 3; location in Fig. 2).

The earliest depositional event evidenced in section 4 is a layer of well-sorted gravels (deposit 4028). This predates the deposition of compact gravelly sand (deposit 4027), which was followed successively by the deposition of sediment layers 4026, 4025, and 4015, the last of which is homogenous to a depth of 1.2 m and is capped by a 150-mm-deep layer that forms the current ground surface.
Viewed in isolation, this stratigraphic sequence is simple and straightforward, but to understand it requires interpretation of how these deposits relate to the drystone wall to the immediate east of these sediments (Fig. 3, left). The wall is more than 2 m high and is inclined upslope (i.e., to the west) at an angle of approximately 70°. This means the wall is not self-supporting and is supported instead by the sediments behind it. The stratigraphic sequence of deposition of this wall and the deposits to its immediate west is therefore as follows: deposition of layer 4028, construction of the founding two or three courses of the wall, accumulation of deposit 4027 behind these wall courses, the construction of the next two or three courses of the wall, accumulation of deposit 4026 behind these new courses, and so on. This process was repeated to allow the accumulation of deposits 4025 and 4015.
The wall in section 4 is a succession of check dams, with the deposits listed previously being layers of alluvium accumulating within a sediment trap.
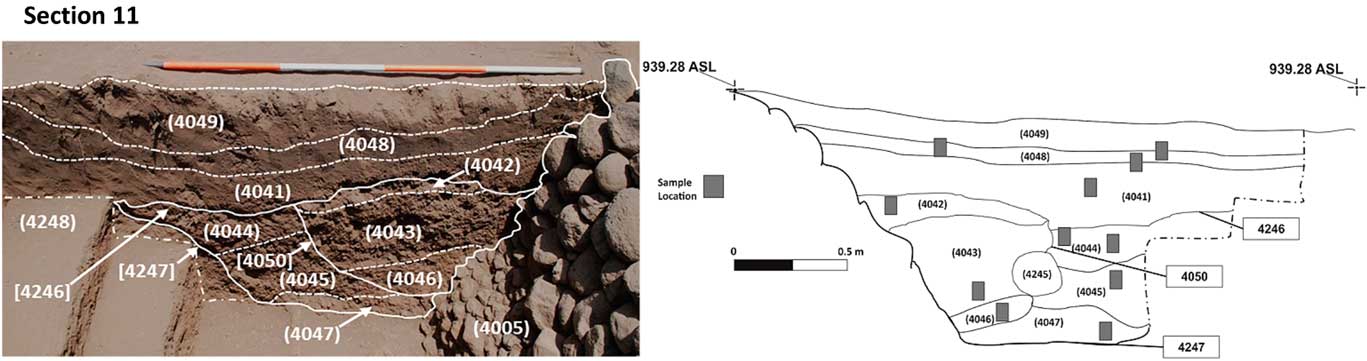
The stratigraphic results and interpretation of the excavation of section 11 are shown in Figure 4, the location of which is shown in Figure 2.

The stratigraphic sequence in section 11 is similar to that of section 4, though this cross section examined deposits accumulating in front of, rather than behind, a check-dam wall. As in section 11, the wall in section 4 was undoubtedly built in several phases as sediments accumulated behind and in front of it. Indeed there are evident changes in the size of stones used in the lower and upper courses of this wall (Fig. 4, left), an observation that provides supporting evidence for the interpretation that further courses were added to this wall periodically. For the purposes of this simple summary, however, the wall can be regarded as a single event—assigned record number 4005.
Following its construction, wall 4005 was buried by a succession of deposits. Five of these (4248, 4044, 4041, 4048, and 4049) are composed of fine sands, clays, and silts, whereas four others (4047, 4045, 4043, and 4042) contain much higher concentrations of gravel. Deposit 4245 refers to three large stones (one of which is recorded in the south-facing section; Fig. 4, right) that formed a boundary between deposit 4043 to their west and deposits 4045 and 4044 to their east.
The interpretation of the stratigraphic results shown in Figure 4 is as follows: The first evidence of human intervention is the construction of the lower courses of wall 4005. These courses are then buried by alluvial deposit 4248. An irrigation canal was then excavated into 4248, with this canal (recorded as event 4247 in Fig. 4) employing wall 4005 as its upslope side. Water flowing within this canal successively deposited the ditch fills 4047, 4045, and 4044. These ditch fills were then partially dug away to create a new, narrower irrigation canal: 4050. This was followed by the deposition of fine gravels and silty clays (4046) within the new canal. Large stones (4245) were then placed against the downslope (eastern) side of canal 4050 to prevent erosion. Ditch fills 4043 and 4042 were then deposited. An erosion event (numbered as 4246 in Fig. 4) then partially eroded the upper fills of both the earlier and later irrigation canals. Thereafter, a series of fine sediments (4041 and 4048) were deposited and are interpreted here as deliberate accumulations within a sediment trap. The final deposit in this sequence (4049) is predominantly aeolian and is interpreted as dating to after the abandonment of this field. This final event left only the upper course of sediment trap wall 4005 visible on the surface.
Both section 4 and section 11 are thus interpreted here as cross sections through sediments deliberately captured behind drystone check dams, with section 11 also including evidence of two successive irrigation canals. The sediment analyses presented subsequently support and refine these interpretations.
Field description and soil macromorphology
Soil macromorphological field observations and soil pH from section 4, section 11, and the control samples are reported in Table 1.
Table 1 Summary of the soil field descriptions.

Light grey-brown, friable, poorly developed soils, with a low frequency of coarse mineral material, were observed in the upper events of section 4 (above deposit 4015), section 11 (deposits 4049 and 4048), and in the upper 30 cm of the 2.3-m-deep profile excavated at Selela (sample number Selela2). The amount of fine clay minerals increased with depth in section 4 (~20% of fine material composition) but not in the controls. Within the control profile, the proportion of course material increased with depth. Distinct boundaries and strongly developed soil structure were observed in the control profile. Coarser material was identified in the lower deposits of section 4 (4027 and 4028). Boundaries between deposits within this profile were diffuse, except between deposits 4015 and 4025.
Micromorphological observations
A summary of the soil micromorphology is presented in Table 2. Coarse mineral material observed in samples shows high frequencies of basalt (~30%), olivine (~15%), pyroxene (~10%), biotite (~10%), and plagioclase (~5%). Coarse organic material was observed predominantly in the upper deposits at all three sample locations (Figs. 5a and 6d), as well as in deposit 4025 within section 4. The most common organic material was modern root fragments, which, along with fungal schlerotia (Fig. 6a), were most common in the upper levels.

Figure 5 (colour online) Pedological features observed in section 4. (a) Event 4015 displayed spherical excremental pedofeatures (ExPf) (plane polarized light [PPL]). (b) Events 4026 and 4025 both displayed calcitic pendent coatings (CalC) that formed below subangular blocky peds within the channel voids (V) (cross-polarized light [XPL]). (c) Fe-impregnated hypocoatings (HyC) observed on the large granular peds of event 4015 (PPL). (d) Dusty calcitic crystalline coatings (Dc) developed in the edges of chamber voids (V) and redoximorphic nodules (N) located within the fine material (Fm) (XPL).

Figure 6 (colour online) Pedological features observed in section 11. (a) Event 4041 shows fungal schlerotia (FuSch) within the fine material (Fm) (plane polarized light [PPL]). (b) Crystalline calcitic intercalations (CaIn) formed within the Fm and coarse fractions of basalt (Ba) in event 4044 (crosspolarized light [XPL]). (c) Event 4044 exhibited hydrologic soil features in the form of calcitic crystalline coatings developed on the surface of chamber voids (V) (XPL). (d) Dusty coatings (Dc) developed on the outer edge of orthic and disorthic redoximorphic nodules (AgN) within in the Fm (PPL).
Table 2 Summary of the micromorphological observations.

Notes: Frequency levels: *, low; **, moderate; ***, high; ****, very high. Voids: Ch, channel; Chb, chambers; cp, complex packing voids; Cr, cracks; v, Vughs. Peds: A, angular; Gr, granular; SAB, subangular block. b-Fabric: p-S, partially striated; S, striated. c/f, coarse-to-fine ratio; XPL, cross-polarized light.
The excavated sections at Engaruka and the controls include evidence for the presence and movement of water within sediments. However, these features are far more frequent in section 4 and section 11 than in the controls. Dusty and calcitic crystalline coatings are observed on the inner side of chamber voids, and dusty and calcitic crystalline inclusions can be seen in the fine matrix (Figs. 5d and 6b and c). The coatings and the inclusions both formed through the suspension of fine clay and calcite particles in water that travelled through the voids and micropores of the peds before the water evaporated. The development of pendant calcite coatings (Fig. 5b) demonstrates saturation of the soil in the lower of the two subsamples of event 4025 (4025_L) and in 4026, both in section 4. Iron impregnation features in the form of hypocoatings were observed on the outer edges of both subangular and granular peds in layers 4015_U and 4027 in section 4 (Fig. 5c). These features are indicative of repeated rapid fluctuations in soil saturation (Lindbo et al., Reference Lindbo, Stolts and Vepraskas2010). The development of redoximorphic nodules (Fig. 6d) occurs in seasonally waterlogged soils. Orthic (in situ) redoximorphic nodule pedofeatures were observed in greater frequencies within section 4 (>20%) and section 11 (~20%) than in the controls (5%).
PSA and MS
PSA analysis indicates that there was a higher level of clay particles in the upper deposits of both section 4 and section 11; this was not seen in the control samples. Higher proportions of medium and fine gravels were identified in the lowest deposit of section 4 (4028) when compared with other samples in this section and in the section 11 deposits resulting from fast flows within the irrigation canals (4047, 4043, and 4042).
MS and particle-size results (Fig. 7) show that the highest variability of MS is in section 4 (536.8±582.1) with deposit 4026 exhibiting the highest reading (SI 1947.3). Section 11 and the control samples display lower variability (SI 525.6±122.3 and SI 504.6±55.0).

Figure 7 Magnetic susceptibility (MS) and particle-size analysis of section 4, section 11, and the control samples.
Soil geochemistry
Silicon concentrations vary in the range 147.7–203.3 g/kg (see Supplementary Table 1). Concentrations of Fe are high, up to 113.3 g/kg, with similar patterns shown by Zn, Mn, and Cr, although in lower concentrations. Contents of Ca range between 12.2 g/kg and 61.3 g/kg, and Sr varies from 0.6 g/kg to 1.0 g/kg. The highest concentrations of Ca and Sr are in the lowermost deposit from section 4 (4028), and the lowest concentrations are in the controls. However, Ca and Sr do not covary (r 2=0.46).
Concentrations of K show a different vertical variation, with the control samples showing the highest contents (14.9 g/kg in C4), whereas the lowest concentrations are in deposit 4043 in section 11 (10.7 g/kg) and in 4015_L in section 4 (11.0 g/kg).
The highest concentrations of P are found in sample 4042 (2.4 g/kg) from section 11, with this section also having a higher average concentration of P than section 4 and the controls. Sample 4015_L of section 4 has the lowest concentration of P in this profile and also for all sample locations (1.4 g/kg).
The results of the PCA show that the first three PCs account for 82.1% of the variance. PC1 (46.8%) relates, with high positive loadings, to Fe, Mn, Zn, and Cr. Scores for PC1 are positive for all samples from section 11 and the bottom sample of section 4 (4028), and they are negative for the rest of the samples of section 4 and the controls (Figs. 8 and 9). PC2 (20.4% of the variance) relates to Ca and Sr contents, both with high positive loadings. All samples from section 4 have positive scores in PC2 (except 4015_L, which is close to zero), in contrast with the three control samples, which have negative PC2 scores. PC3 (14.9%) relates almost exclusively to K and so is not discussed here as this is a single element that is related primarily to the control samples and not the irrigation landscape at Engaruka.

Figure 8 Vertical variation in the distribution of Fe, Mn, Zn, and Cr represented by principal component (PC) 1 (46.8%); Ca and Sr represented by PC2 (20.4%); and K represented by PC3 (14.9%).

Figure 9 (colour online) Principal components analysis accounting for 67.1% of the variability in the data shown in score plot (top) and loadings plot displaying the correlations between variables (bottom).
DISCUSSION
Stratigraphy
Through this investigation, it is now recognised that the landscape at Engaruka was not only irrigated (a fact first recognised by Sutton [Reference Sutton1978]) but also built using the careful manipulation of water and the sediments entrained within it. This was known from previous excavations in the fields to the north of the Engaruka River (Stump, Reference Stump2006), but the capture of sediments over 2 m deep in the South Fields area of the site occurred on a far grander scale.
Stratigraphically, the conclusion that these sediments have been captured behind artificial drystone check dams rests on the fact that the walls recorded through excavation are inclined upslope and are far too high to be self-supporting. Indeed, two or three courses of wall would seem to be the maximum that could be self-supporting given the style of construction. This means that no more than 20 cm of sediments was captured in any single depositional event, and that the process of wall construction and sediment accumulation must have proceeded in phases. Moreover, because there are no discernible breaks in the line of the wall (i.e., each new courses rests on the top of the previous course), it would seem that the amount of sediment captured at any one time was never sufficient to bury the structure, and that consequently at least the upper course of the wall was always visible prior to the next phase of construction. Given the sheer volume of sediments that ultimately accumulated behind and in front of these walls, it is impossible to imagine that these sediments were transported manually. On stratigraphic grounds alone, therefore, alluvial deposition is the only feasible process at this topographic location.
Because we can infer that the wall was built in phases of no more than three courses at a time, deep homogenous layers such as 4025 and 4015 in section 4 should, strictly speaking, be stratigraphically divided into at least two distinct events. To do so, however, would be somewhat arbitrary given that it was not possible to discern on the basis of observation how many courses where added to the wall each time it was raised. The internal homogeneity of these deposits in terms of soil macromorphology is nevertheless significant because it demonstrates that the process and regime of deposition were consistent during the period these sediments were laid down (i.e., that water flow rates and the method of channelling flows onto the field area remained constant). A distinct boundary between 4025 and the overlying 4015 demonstrates that some change in these variables took place at this time, but thereafter the homogeneity of 4015 for a depth of more than 1.2 m shows no change in the depositional process for a period that encompassed at least three episodes of wall construction.
The stratigraphic results from section 11 demonstrate that this area was also formed by capturing sediments, although in this example the check-dam wall was also used as one side of an artificial watercourse. Given its location and association with former agricultural plots, this watercourse can be surmised to have been an irrigation canal, a supposition that is also supported by the soil micromorphology results.
Soil macromorphology and micromorphology
Microscopic pedofeatures indicative of different water regimes were observed in the Engaruka samples and in the controls. These hydrologic features include redoximorphic nodules, iron hypocoatings, and pedant calcitic coatings. Redoximorphic nodules are pedofeatures used by the U.S. Department of Agriculture, Natural Resources Conservation Service (2010) as indicators of seasonal waterlogging of soils, whereas iron hypocoatings develop in conditions of rapid fluctuations of soil saturation (Lindbo et al., Reference Lindbo, Stolts and Vepraskas2010). The development of pendant calcite coatings demonstrates saturation of the soil (Durand et al., Reference Durand, Monger and Canti2010). Calcitic inclusions and coatings are indicative of evaporation of soil water (Stoops, Reference Stoops2003).
The control samples contain redoximorphic nodules and calcitic coatings and inclusions, demonstrating that these soils experienced wetting and drying and evaporation of soil water. This is to be expected given the position of the samples within an alluvial fan formed by a seasonal river. However, these features are observed at lower frequencies in the controls compared with the samples from section 4 and section 11, where their presence is related to water management.
Section 11, when compared with the controls, has a slightly higher frequency of hydrologic and evaporation pedofeatures. Frequencies are highest in the deposits within the two canals (4042, 4043, 4044, 4045, 4046, and 4047) and are lower in the deposits that postdate the abandonment of the later canal: 4041, 4048, and 4049.
Water management is clearly evidenced in section 4, which not only shows pedofeatures characteristic of wetting and drying, but also includes pendant calcitic coatings demonstrating water inundation. Hypocoatings and redoximorphic nodules only occur together in deposits 4015_U and 4027, and when seen together, they are clear evidence of rapid wetting and drying. The highest frequency of redoximorphic nodules is seen in 4015_M. Although in this deposit these nodules are not associated with hypocoatings, the presence of redoximorphic pedofeatures is sufficient to indicate irrigation of this layer.
Both 4028 (that predates the construction of the check-dam wall) and 4026 have high frequencies of redoximorphic nodules. However, 4026 also has a high frequency of pendant calcitic coatings indicative of protracted inundation. These pendant coatings are also present in the overlying deposit 4025_L, although in slightly lower frequencies.
Taken together, the micromorphology results, summarised in Table 2, add significant details to our understanding of the agricultural activity at Engaruka. It has long been recognised that the fields at Engaruka were irrigated (Sutton, Reference Sutton1978), but it is now clear that irrigation techniques within fields changed through time. This is clearest in section 4, with the earliest cultivated level (4027) displaying evidence of rapid wetting and drying, whereas the subsequent deposits in the sequence (4026 and 4025_L) were subject to prolonged inundation, leading to the development of pedofeatures characteristic of paddy fields (Durand et al., Reference Durand, Monger and Canti2010). This was followed by a period again characterised by wetting and drying (4025_U), though not to the same extent as evidenced in 4027. This was followed by the phased deposition of 4015, the lower subsample from which (4015_L) includes no micromorphological evidence of water management, but thereafter the data demonstrate a return to an irrigation regime characterised by rapid wetting and drying of this agricultural plot.
Prolonged irrigation can, however, cause salinization that can detrimentally affect agriculture and thereby limit its long-term sustainability (Gregory, Reference Gregory2012; Shahid et al., Reference Shahid, Taha and Abdelfattah2013). Despite reliable proxies for irrigation and evaporation, there is no evidence of salt crusting from the micromorphology. This may suggest that despite high levels of water and evaporation at Engaruka, farming practices served to avoid or counteract the detrimental effects associated with long-term irrigation.
PSA and MS
The PSA and MS results are consistent with the stratigraphic field descriptions and with sediment variability and composition. As discussed previously, the deposits are alluvial: they are formed through the deposition of sediments carried by water, and the differences in water regime, and therefore in sedimentation patterns, would lead to differences in particle-size distribution.
The control samples contain a higher level of gravels (17.5%±8.1) than the averages of section 4 (8.5%±4.5) and section 11 (9.3%±8.2). The controls also have lower clay contents: 0.68%±0.1 compared with an average of 2.8%±3.8 for all of section 4 (or 1.4%±0.7 without sample 4015_U) and 1.0%±1.0 for all samples in section 11. This indicates that water flow rates were faster at the control site, as opposed to a slower managed regime at Engaruka. The particle-size distribution in the controls indicates a more heterogeneous sedimentation pattern that reflects an unmanaged water flow.
However, there is also a heterogeneous particle-size distribution within section 4 and section 11. Section 11 has a higher level of sands than section 4, especially fine sands, whereas section 4 has a higher proportion of clay and silt (Fig. 7). These differences result from distinct formation processes occurring in both sections: section 4 developed within a sediment capture field (therefore a slower water regime), whereas the predominant process in the formation of section 11 was the infilling of an irrigation canal, as demonstrated in the stratigraphy section.
Deposit 4043 in section 11 has relatively low levels of fine sand and a relatively high proportion of coarse sand and fine gravel in comparison with other samples in this section. As identified in the stratigraphic results, deposit 4043 corresponds to the fill of a narrower irrigation canal (4050) created by the cutting away of previously deposited sediments. Similar volumes of water in a smaller canal would increase the velocity of the water flow, thus preventing deposition of finer sediments and resulting in a proportionally larger coarse fraction.
The lower deposits in section 4 (4026, 4027, and 4028) have higher levels of coarse sands in comparison with the upper samples of this section (4025 and 4015) and also with section 11 and the controls. Increased levels of coarse sand in the lower deposits of section 4 are indicative of higher water velocity, enabling mainly the deposition of the coarser sand particles, as evidenced particularly in deposit 4026. In contrast, the upper deposits (4025 and 4015) of section 4 contain the highest levels of clays (Fig. 8), which express a reduction of water-carrying capacity. Given the location of section 4 towards the centre of a very large group of fields formed by sediment accumulation, it is doubtful that the reduction in flow inferred in the upper layers reflects reduced availability of water. It is therefore conjectured here that it reflects an improved ability to capture only the fine sediments that are most desirable for agricultural production.
A positive correlation was found between the fine-sized fractions and Fe content in section 4 (fine sand, r 2=0.90; silts, r 2=0.95; and clay, r 2=0.88). These correlations have been calculated excluding sample 4028 because this deposits predates the construction of the check-dam wall and has a much higher Fe content that the rest of the deposits in this section. This relationship between Fe and fine material indicates that the fine fraction is probably composed mainly of secondary Fe oxides, implying a high degree of weathering.
The average of the MS values is similar for section 4 and section 11 (SI 536.8±582.1 for section 4 and SI 525.6±122.3 for section 11), and slightly higher than for the controls (SI 504.6±55.0). From these results, it is noticeable that section 4 has a large standard deviation, the higher variability being almost exclusively attributable to sample 4026. In fact, if this sample is removed from the calculations, the average for section 4 is reduced to SI 335.3±249.8. This result also shows that the minerals of section 4 are generally much less magnetic than those in section 11 and the controls. In relation to this, MS correlates negatively with Fe in section 4 (r 2=0.90, again excluding sample 4028), and positively with the proportion of sand (r 2=0.58). If these results are considered together with the higher Fe content in finer fractions, it is deduced that (1) section 4 is generally more weathered than the sand-rich deposits from section 11; (2) the majority of Fe released upon weathering is forming secondary oxides with low magnetism (see Grison et al., Reference Grison, Petrovsky, Stejskalova and Kapicka2015), such as goethite or hematite; and (3) the high MS in deposit 4026 in section 4 would be attributable to inherited fresh material, most likely magnetite, which is a ferrimagnetic mineral, and previous studies have demonstrated that magnetite is usually more abundant in the sand fractions (Viana et al., Reference Viana, Couceiro, Pereira, Fabris, Fernandes Filho, Schaefer, Rechenberg, Abrahão and Mantovani2006).
Despite MS being frequently used as a proxy for wetter soil conditions (Balsam et al., Reference Balsam, Ellwood, Ji, Williams, Long and El Hassani2011), the results of this work show no evidence of a relationship between MS and inundation features, as identified by micromorphological observations. It could, however, be considered a proxy for water management in this case study, as it was found to be related with sediment particle size and therefore with changes in the flow of irrigation water.
Soil geochemistry
Concentrations of Si are low compared with mean continental crust concentrations (Schlesinger, Reference Schlesinger1997), but similarly low levels are recorded from the Crater Highlands (McHenry et al., Reference McHenry, Mollel and Swisher Iii2008). These low levels result from chemical weathering leading to the dissolution of silica (see Alexander et al., Reference Alexander, Heston and Iler1954; Xu, Reference Xu2009; Taboada et al., Reference Taboada, Rodríguez-Lado, Ferro-Vázquez, Stoops and Martínez Cortizas2016) allowing Si in solution to leach out from the soil profile.
The geochemistry results (ST 1) recorded high concentrations of Fe in the Engaruka and control samples consistent with the basaltic lithology (Schaetzl and Anderson, Reference Schaetzl and Anderson2009). The soil Fe concentrations probably result from high levels of ferromagnesian minerals (e.g., pyroxene and olivine) from the volcanoclastic parent material.
The results of the PCA (Figs. 8 and 9) show that the loadings in PC1 are positive for all variables except for K, which has a slightly negative loading (with most of its variability related to PC3). However, only Fe, Mn, Zn, and Cr, all of them metallic elements typical of ferromagnesian minerals, have loadings above 0.7 (Fig. 9). As the mineralogy of the parent material is quite homogeneous for all samples (as observed in micromorphological analysis), the higher abundance of these elements seems to result from sedimentary (chemical differentiation derived from grain-size selection) or pedogenetic processes. Main soil formation processes in this environment would comprise weathering leading to the release of large amounts of Fe into soil solution. The released Fe would form secondary oxides as Fe is largely immobile at the soil pH values recorded here (Jansen et al., Reference Jansen, Nierop and Verstraten2003, Reference Jansen, Nierop and Verstraten2005), whereas alkaline cations are highly mobile at these pHs (Martínez Cortizas et al., Reference Martínez Cortizas, García-Rodeja Gayoso, Nóvoa Muñoz, Pontevedra Pombal, Buurman and Terribile2003; Chesworth et al., Reference Chesworth, Camps Arbestain, Macías, Spaargaren, Spaargaren, Mualem and Morel‐Seytoux2008). Repeated cycles of wetting and drying and the consequent development of redoximorphic features (Lindbo et al., Reference Lindbo, Stolts and Vepraskas2010) are probably also contributing to this process. All these mechanisms may or may not occur concurrently and could affect the samples within the same section to varying degrees.
Because samples from section 11 have the highest scores in PC1 (Figs. 8 and 9), it follows that they are also the more Fe (and Mn, Zn, and Cr) rich. It has been demonstrated previously that particle size in section 11 is coarser than in section 4 with a larger proportion of sand, and that sand-sized materials would be composed of inherited fresh minerals or rock detritus (i.e., ferromagnesian silicates, feldspars, basalt, and crystalline Fe oxides) (Table 2). A higher frequency of the most Fe-rich minerals would account for larger amounts of Fe. In contrast, the controls and section 4 (except its bottommost sample) have negative scores in PC1. It is tempting to conclude that these results are explained by differences in degree of weathering given that section 4 has more clay, and the controls are almost certainly significantly older than both sections at Engaruka. However, this tentative interpretation has to be treated with caution because different sedimentation rates could contribute to this effect.
The assemblage of variables loading in PC2 (Ca and Sr have high positive loadings, whereas Al loads negatively) is interpreted as a proxy for postdepositional calcification processes. The Ca would be dissolved in upper soil layers, translocated, and precipitated in the lower deposits. Support for this is provided by the relationship between PC2 sample scores and Ca/Al and Ca/Sr molar ratios (r 2=0.71 and r 2=0.56, respectively; ST 1). The lack of micromorphological evidence for an upwards movement of Ca from the layers below by capillarity would further corroborate this. Samples from section 4 vary from close to zero to positive scores in PC2, indicating different degrees of calcification. Concentrations of Ca are higher in the lower deposits, with the highest scores in samples 4027 and 4028. The samples from section 11 are affected to a lesser degree by calcification processes, with positive PC2 scores only in the samples that are deliberately captured sediments for agriculture (4041 and 4048) rather than the canal fill deposits (Fig. 8). In comparison, the control samples have negative scores in both PC1 and PC2 and are therefore less affected by Fe enrichment and calcification when compared with section 11 and section 4.
From the analysis of variance of PC1 and PC2 scores, it can be asserted that the geochemical differences between the three sampling locations is significant (P<0.05). Because the differences in parent material and climate are negligible, the different pedogenic trends are most likely related to different land uses and/or management in the three locations: an uncultivated area, a terrace field, and an irrigation canal.
Phosphorus contents are generally higher in section 11 than in both section 4 and the control samples. The variations within each soil could be attributed to three different processes: (1) original levels of P in the source sediment were higher, perhaps because of differences in the parent material; (2) the irrigation water had large amounts of dissolved phosphate that would precipitate in soils, thus leading to P enrichment in some samples; or (3) irrigation has produced the dissolution and leaching of P in some samples, therefore producing P depletion. Evidence from micromorphological observation indicates no significant differences in the mineralogical composition of the parent material, as all the samples have basaltic lithology (Table 2). However, the micromorphological study also rules out the second and third hypotheses, as no soluble P salts have been observed. Further work would be necessary to understand the processes leading to the higher content of P in section 11, for example by comparing changes in the concentration of P with results of P speciation, total organic carbon, nitrogen isotopes, or with proxies for the sources of organic matter (e.g., Leinweber and Schulten, Reference Leinweber and Schulten1999; Jardé et al., Reference Jardé, Gruau, Mansuy-Huault, Peu and Martinez2007; Shahack-Gross et al., Reference Shahack-Gross, Simons and Ambrose2008).
Implications for the resilience and sustainability of agriculture at ancient Engaruka
Faced with evidence of an irrigated agricultural landscape that was abandoned relatively recently, it is tempting to conclude that this landscape was always agriculturally marginal, and that even a slight reduction in water availability would be sufficient to force its abandonment (see, e.g., Sutton, Reference Sutton2004). The data presented here force a reassessment of this view, demonstrating that evidence for the use of irrigation in what is now a semiarid environment does not mean that farming would have always required supplementary irrigation. In contrast, it is now clear that water was formerly available in sufficient quantities not only to irrigate fields but also to build them. Moreover, having constructed fields through sediment capture, there was evidently sufficient water to keep some plots inundated (as demonstrated by the presence of micromorphological pedofeatures characteristic of paddy fields) while apparently avoiding the salinization of soils (as evidenced by the lack of salts more soluble than calcium carbonate within the micromorphological observations).
Given that an ability to adapt to changing conditions without fundamentally changing the manner in which a system functions is in essence the definition offered for resilience within socioecological systems (e.g., Walker et al., Reference Walker, Holling, Carpenter and Kinzig2004), the ability of farmers at Engaruka to manage water and sediments on a massive scale while attempting to maintain soil fertility and avoid salinization could be seen as evidence that the system was resilient. However, as highlighted in the introduction, temporal and spatial scales matter in questions of resilience or sustainability: it is possible to enact procedures that improve sustainability at a decadal scale but which cannot be maintained over centuries, and it is possible to prioritise economic sustainability and resilience in one part of a landscape to the detriment of ecological sustainability and resilience here or elsewhere.
Research undertaken at Konso in Ethiopia offers an example of this, because here the construction of very similar sediment traps to those at Engaruka was facilitated by the loss of all of the topsoil and most of the subsoil from adjacent hillsides (Ferro-Vázquez et al., Reference Ferro-Vázquez, Lang, Kaal and Stump2017). The improvement in economic productivity gained by the deliberate capture of fine clays and silts in irrigable sediment traps located next to rivers was thus achieved at the expense of wide-scale soil erosion nearby. The evidence here suggests a similar process took place at Engaruka, with the importation of fresh sediments providing benefits within the field system, whereas the loss of soil upslope is likely to have caused detrimental impacts in the areas from which these sediments were derived. Within the fields themselves, sustainability was enhanced because the repeated capture of fine material created fields that were easier to till, and the replenishment of fields with fresh sediments derived from fertile Andosols may have acted both to avoid salinization from irrigation and mitigate the effects of prolonged cultivation on soil fertility. Actions that sustained the irrigated cultivation of crops for several centuries at Engaruka may, therefore, have ultimately proved unsustainable because they relied on soil erosion within the catchments of the rivers that supplied both water and sediments to the site.
For the moment, this scenario must remain a hypothesis pending further work. Of the essential sources of additional data, the need for better dating is the most pressing. This is because without direct dating of the fields themselves it is impossible to relate episodes of field construction and cultivation with palaeoclimatic data (e.g., Ryner et al., Reference Ryner, Holmgren and Taylor2008). Given that the capture of vast quantities of sediment is not possible without erosion elsewhere, relating periods of check-dam construction to climatic fluctuations would also be necessary to discern whether climatic changes triggered or exacerbated this erosion.
Nevertheless, even without absolute dates it is clear that the majority of the total field area at Engaruka was built during periods of high water availability, because most of the fields north of the Engaruka (Stump, Reference Stump2006), and much of the field area south of the Olemelepo, are now known to have been built from captured alluvium. This lends support to the assertion by Westerberg et al. (Reference Westerberg, Holmgren, Börjeson, Håkansson, Laulumaa, Ryner and Öberg2010) that much of the irrigation infrastructure at Engaruka was built during a period of wetter than modern conditions after ca. AD 1670. This having been said, the argument that Engaruka was highly resilient on the grounds that it appears to have survived a period of drier conditions prior to AD 1670 (Westerberg et al., Reference Westerberg, Holmgren, Börjeson, Håkansson, Laulumaa, Ryner and Öberg2010) remains difficult to support until we understand how the community responded to this dry period.
Potential archaeological contributions to resilience and sustainability studies
The geoarchaeological results presented here emphasise that abandonment of a system is not synonymous with failure, and that defining the reasons why a system failed or was abandoned is rarely straightforward. This study has focussed on a site that has been described as unsustainable by some writers and as resilient by others. In doing so, it has illustrated that assessments of sustainability require details of how a system functioned, the resources available, the environmental context, and how all these factors changed through time. Indeed, a full assessment of sustainability would also require consideration of social interactions and trade networks, none of which have been discussed here for the current case study. Gathering and assessing these details requires a highly interdisciplinary approach, and this is true both of assessments of sustainability in the past and of assessments of modern practices. Without these details it is impossible to assess how systems can be maintained over long periods (i.e., remain sustainable) or how communities respond to changing conditions (i.e., display resilience).
CONCLUSIONS
The abandoned site of Engaruka in northeastern Tanzania is used here to illustrate how a detailed knowledge of the construction and operation of an agricultural landscape is essential to understand the sustainability of the practices employed.
Most of the fields at Engaruka were built by capturing vast amounts of alluvial sediments behind thousands of drystone check dams. Stratigraphic data clearly identify successive construction phases of the sediment trap walls, repeated capture of alluvial sediments, and utilisation of artificial channels and canals for crop irrigation and sediment transport.
With some check dams eventually accumulating sediments more than 2 m deep, it is clear that water availability was high at the time these sediments were mobilised and captured (at least seasonally), and this demonstrates that the fields were built in a period or periods when the local rivers carried flows significantly higher than seen today.
Micromorphological pedofeatures preserved within these sediments indicate that some fields were kept permanently inundated, meaning that water remained available after the episodes of sediment deposition. However, not all fields were kept inundated, with some showing evidence of repeated wetting and drying.
There is no evidence of salinization of soils, a known problem in areas irrigated for prolonged periods. It is hypothesised that repeatedly accumulating new sediments onto agricultural plots avoided this problem.
PSA and MS demonstrate that the rate of water flow also varied through time and provide evidence for a managed water regime both in field locations and within irrigation canals.
The causes and dates of the mobilisation of sediment are unknown. Without these data, it is premature to conclude—as had been prevalent in the past—that the inhabitants of Engaruka mismanaged local resources to the point where abandonment of the site was inevitable.
It has been demonstrated that archaeological investigations as part of broader interdisciplinary analyses can provide data essential for understanding historical sustainability.
Deep accumulations of agriculturally favourable sediments like those identified here are not unique to Engaruka. By highlighting the existence and function of these sediments, studies of historical practices can contribute to an understanding of their role and their potential in existing agricultural systems.
Acknowledgments
The Archaeology of Agricultural Resilience in Eastern Africa (AAREA) project is funded by the European Research Council under the European Union’s Seventh Framework Programme Starter Grant Scheme (FP/200702013/ERC); Grant Agreement No. ERC-StG-2012-337128-AAREA was awarded to DS in February 2014. Many thanks to Maria Gehrels (Environment Department, University of York) for her assistance and support with laboratory work. The authors are grateful to Cruz Ferro-Vázquez for detailed comments on the manuscript and for insightful discussions. The research in Tanzania was carried out under a research permit issued by the Tanzanian Commission for Science and Technology and an excavation license issued by the Antiquities Unit of the Ministry of Natural Resources and Tourism. The help and support provided by both these agencies is gratefully acknowledged.
Supplementary material
For supplementary material/s referred to in this article, please visit https:/doi.org/10.1017/qua.2017.54