


1 Introduction
Recent years have witnessed a marked increase in the use of machine learning tools to advance social science research (Barberá et al. Reference Barberá, Boydstun, Linn, McMahon and Nagler2021; Benoit, Munger, and Spirling Reference Benoit, Munger and Spirling2019; Greene, Park, and Colaresi Reference Greene, Park and Colaresi2019; Grimmer, Roberts, and Stewart Reference Grimmer, Roberts and Stewart2021; Rheault and Cochrane Reference Rheault and Cochrane2020; Rodriguez and Spirling Reference Rodriguez and Spirling202 2). However, little attention has yet been paid to the possible applications of large-scale generative language models like GPT-2 (Radford et al. Reference Radford, Wu, Child, Luan, Amodei and Sutskever2019), T5 (Raffel et al. Reference Raffel2020), or GPT-3 (Brown et al. Reference Brown2020) to advancing scientific understanding of human social and political behavior. These models are complex conditional distributions over natural language that are used to generate synthetic text. When trained at scale, they exhibit a remarkable ability to capture patterns of grammar, cultural knowledge, and conversational rhythms present in natural language (Adiwardana et al. Reference Adiwardana2020; Dai et al. Reference Dai, Yang, Yang, Carbonell, Le and Salakhutdinov2019; Radford et al. Reference Radford, Wu, Child, Luan, Amodei and Sutskever2019), and have become so convincing that the texts they generate are largely indistinguishable from those generated by humans (Brown et al. Reference Brown2020). We propose that these models can be used as surrogates for human respondents in a variety of social science tasks.
Our argument begins with a different take on a commonly-recognized problem with artificial intelligence tools: their penchant for replicating the racial, gender, economic, and other biases of their creators. Most discussions of this “algorithmic bias” treat it as a singular, macro-level feature of the model, and seek ways to mitigate negative effects (Barocas and Selbst Reference Barocas and Selbst2016; Mayson Reference Mayson2018; Panch, Mattie, and Atun Reference Panch, Mattie and Atun2019). We suggest it is better understood as a complex reflection of the many various patterns of association between ideas, attitudes, and contexts present among humans. Our studies show that the same language model, when properly conditioned, is able to produce outputs biased both toward and against specific groups and perspectives in ways that strongly correspond with human response patterns along fine-grained demographic axes. In other words, these language models do not contain just one bias, but many. This means that by conditioning a model on simulated “individuals” with targeted identity and personality profiles, it is possible to select from among a diverse and frequently disjoint set of response distributions within the model, each closely aligned with a real human subpopulation. We call the degree to which a model can accurately reflect these distributions its degree of algorithmic fidelity.
High algorithmic fidelity in language models is crucial for their use in social science as it enables researchers to extract information from a single language model that provides insight into the different patterns of attitudes and ideas present across many groups (women, men, White people, people of color, millennials, baby boomers, etc.) and also the combination and intersection of these groups (Black immigrants, female Republicans, White males, etc.). As yet, however, the extent of algorithmic fidelity in large-scale language models is unexplored. In three studies, we provide evidence that the GPT-3 language model (Brown et al. Reference Brown2020) satisfies what we argue are the four essential criteria of algorithmic fidelity. We obtain this evidence by conditioning GPT-3 on thousands of sociodemographic backstories from real human participants in multiple large surveys in the United States: the 2012, 2016, and 2020 waves of the American National Election Studies (ANES) (ANES 2021), and Rothschild et al.’s “Pigeonholing Partisans” data (Rothschild et al. Reference Rothschild, Howat, Shafranek and Busby2019). We condition the model to generate one “silicon subject” for each human study participant, and then ask these simulated subjects to complete the same tasks that were required of human participants. To assess algorithmic fidelity, we explore the degree to which the complex patterns of relationships between ideas, attitudes, and contexts within our silicon subjects accurately mirror those within the human populations. The results from our tests provide the first extensive, systematic exploration of the degree of algorithmic fidelity in a large-scale language model, laying the groundwork for the use of these models broadly in social science.
These studies also provide initial examples of just a few of the myriad potential ways language models can be used in social science research once algorithmic fidelity in a given domain is established. In Study 1, we ask our GPT-3 surrogates to list words describing outgroup partisans and show how closely these words mirror those listed by their human counterparts. In Studies 2 and 3, we explore the relationships between various demographics, attitudes, and reported behaviors. Our results show the same patterns of relationships among GPT-3 surrogates and their human counterparts. For all three of these studies, we explain how a researcher might use only the information from GPT-3 to more effectively study human populations. These results suggest that in the realm of U.S. politics, researchers can confidently use a GPT-3 “silicon sample” to explore hypotheses prior to costly deployment with human subjects. GPT-3 can thus be used both in theory generation and testing.
This paper makes five important contributions: (1) it conceptualizes algorithmic fidelity and identifies four criteria to assess it; (2) it introduces silicon sampling, a methodology by which a language model can generate a virtual population of respondents, correcting skewed marginal statistics in the training data; (3) it introduces a novel approach to conditioning on first-person demographic backstories to simulate targeted human survey responses; (4) it presents compelling evidence for the existence of algorithmic fidelity in the GPT-3 language model in the domain of U.S. politics and public opinion; and (5) it provides examples of how the model can be used for social science research in this domain.
2 The GPT-3 Language Model
The GPT-3 language model holds particular promise as a social science tool. Released by OpenAI in 2020, GPT-3 has 175 billion parameters and was trained on more than 45 terabytes of text, making it one of the largest generative language models ever created. Texts generated by GPT-3 are strikingly difficult to distinguish from authentic human compositions.
Formally, language models like GPT-3 are a conditional probability distribution $p(x_n|x_1,\ldots , x_{n-1})$
over tokens, where each
$p(x_n|x_1,\ldots , x_{n-1})$
over tokens, where each $x_i$
comes from a fixed vocabulary. By iteratively sampling from this distribution, a language model can generate arbitrarily long sequences of text. However, before it can generate text, a language model like GPT-3 requires “conditioning,” meaning that it must be provided with initial input tokens comprising
$x_i$
comes from a fixed vocabulary. By iteratively sampling from this distribution, a language model can generate arbitrarily long sequences of text. However, before it can generate text, a language model like GPT-3 requires “conditioning,” meaning that it must be provided with initial input tokens comprising $\{x_1, $
…
$\{x_1, $
… $, x_{n-1}\}$
. We refer to this conditioning text as the model’s context.
$, x_{n-1}\}$
. We refer to this conditioning text as the model’s context.
Conditioning a language model on different contexts reduces the probability of some outputs and increases the probability of others. For example, given the context $\{x_1,x_2,x_3\}=$
“Can you come,” a language model might assign high probability to
$\{x_1,x_2,x_3\}=$
“Can you come,” a language model might assign high probability to $x_4$
=“home,” and low probability to
$x_4$
=“home,” and low probability to $x_4$
=“bananas,” but changing a single word in the context to
$x_4$
=“bananas,” but changing a single word in the context to $\{x_1,x_2,x_3\}=$
“Can you eat” reverses that. At each generative step, the model estimates a probability distribution corresponding to the likelihood that any given token in the vocabulary would have been the next observed
$\{x_1,x_2,x_3\}=$
“Can you eat” reverses that. At each generative step, the model estimates a probability distribution corresponding to the likelihood that any given token in the vocabulary would have been the next observed $x_i$
if the model were reading a pre-written text. Using a distribution function, it selects one of the most probable candidates, the new
$x_i$
if the model were reading a pre-written text. Using a distribution function, it selects one of the most probable candidates, the new $x_i$
is appended to the conditioning context, and the entire process repeats. This continues until a pre-specified number of tokens has been generated, or until an external factor causes the process to stop. Because GPT-3 selects output tokens probabilistically, it can generate many possible continuations for a given context.
$x_i$
is appended to the conditioning context, and the entire process repeats. This continues until a pre-specified number of tokens has been generated, or until an external factor causes the process to stop. Because GPT-3 selects output tokens probabilistically, it can generate many possible continuations for a given context.
3 Algorithmic Fidelity
We define algorithmic fidelity as the degree to which the complex patterns of relationships between ideas, attitudes, and sociocultural contexts within a model accurately mirror those within a range of human subpopulations. The core assumption of algorithmic fidelity is that texts generated by the model are selected not from a single overarching probability distribution, but from a combination of many distributions, and that structured curation of the conditioning context can induce the model to produce outputs that correlate with the attitudes, opinions, and experiences of distinct human subpopulations.
This does not imply that the model can simulate a specific individual or that every generated response will be coherent. Many of the known shortcomings and inaccuracies of large language models still apply (Bender et al. Reference Bender, Gebru, McMillan-Major and Shmitchell2021; Marcus Reference Marcus2020). However, by selecting a conditioning context that evokes the shared sociocultural experience of a specific demographic group, we find that it is possible to produce response distributions that strongly correlate with the distribution of human responses to survey questions from that demographic.
Our conception of algorithmic fidelity goes beyond prior observations that language models reflect human-like biases present in the text corpora used to create them (Barocas and Selbst Reference Barocas and Selbst2016; Caliskan, Bryson, and Narayanan Reference Caliskan, Bryson and Narayanan2017; Garg et al. Reference Garg, Schiebinger, Jurafsky and Zou2018; Mayson Reference Mayson2018; Panch et al. Reference Panch, Mattie and Atun2019). Instead, it suggests that the high-level, human-like output of language models stems from human-like underlying concept associations. This means that given basic human demographic background information, the model exhibits underlying patterns between concepts, ideas, and attitudes that mirror those recorded from humans with matching backgrounds. To use terms common to social science research, algorithmic fidelity helps to establish the generalizability of language models, or the degree to which we can apply what we learn from language models to the world beyond those models.
How much algorithmic fidelity in a language model is enough for social science use? We suggest at a minimum a language model must provide repeated, consistent evidence of meeting the following four criteria:
Criterion 1. (Social Science Turing Test) Generated responses are indistinguishable from parallel human texts.
Criterion 2. (Backward Continuity) Generated responses are consistent with the attitudes and sociodemographic information of its input/“conditioning context,” such that humans viewing the responses can infer key elements of that input.
Criterion 3. (Forward Continuity) Generated responses proceed naturally from the conditioning context provided, reliably reflecting the form, tone, and content of the context.
Criterion 4. (Pattern Correspondence) Generated responses reflect underlying patterns of relationships between ideas, demographics, and behavior that would be observed in comparable human-produced data.
These criteria represent four qualitatively different dimensions on which a model must have fidelity to human responses if researchers are to have confidence in the ability of the model to generate reliable surrogate human responses. A lack of fidelity in any one of these four areas decreases confidence in its usability; a lack of fidelity in more than one decreases confidence further. We do not propose specific metrics or numerical thresholds to quantify meeting or missing these criteria, as the appropriate statistics will depend on varying data structures and disciplinary standards. Instead, we suggest the best metric is repeated support for each criteria across multiple data sources, different measures, and across many groups.
In the following studies, we take this approach in examining support for these criteria within GPT-3 in the domain of U.S. politics and public opinion. Decades of research in political science provide a robust literature identifying expected relationship patterns between political ideas, concepts, and attitudes (Berelson, Lazarsfeld, and McPhee Reference Berelson, Lazarsfeld and McPhee1954; Burns and Gallagher Reference Burns and Gallagher2010; Campbell et al. Reference Campbell, Converse, Miller and Stokes1960; Cramer Reference Cramer2020; Druckman and Lupia Reference Druckman and Lupia2016; Hutchings and Valentino Reference Hutchings and Valentino2004). We leverage these as a basis for comparison.
4 Silicon Sampling: Correcting Skewed Marginals
Applying language models to social science research raises an obvious question: how can we compensate for the fact that the demographics of internet users (on which the model was trained) are neither representative of most populations of interest nor demographically balanced, and that language models are trained on internet snapshots acquired at a fixed point in time?
We propose a general methodology, which we term silicon sampling, that corrects skewed marginal statistics of a language model. To see what needs correcting, imagine trying to use GPT-3 to assess marginal probabilities of voting patterns $P(V)$
. GPT-3 models both voting patterns V and demographics
$P(V)$
. GPT-3 models both voting patterns V and demographics $B_{\mathrm {GPT3}}$
jointly as
$B_{\mathrm {GPT3}}$
jointly as $P(V,B_{\mathrm {GPT3}}){=}P(V|B_{\mathrm {GPT3}})P(B_{\mathrm {GPT3}})$
.
$P(V,B_{\mathrm {GPT3}}){=}P(V|B_{\mathrm {GPT3}})P(B_{\mathrm {GPT3}})$
.
However, the distribution of backstories $P(B_{\mathrm {GPT3}})$
does not match the distribution
$P(B_{\mathrm {GPT3}})$
does not match the distribution $P(B_{\mathrm {True}})$
in the populations of interest to most social scientists (say, among all voting-eligible citizens); without correction, conclusions about marginal voting patterns
$P(B_{\mathrm {True}})$
in the populations of interest to most social scientists (say, among all voting-eligible citizens); without correction, conclusions about marginal voting patterns $P(V){=}\int _{B} P(V,B_{\mathrm {GPT3}})$
will be skewed by this difference. To overcome this, we leverage the conditional nature of language models and sample backstories from a known, nationally representative sample (e.g., the ANES) and then estimate
$P(V){=}\int _{B} P(V,B_{\mathrm {GPT3}})$
will be skewed by this difference. To overcome this, we leverage the conditional nature of language models and sample backstories from a known, nationally representative sample (e.g., the ANES) and then estimate $P(V)$
based on those ANES-sampled backstories. This allows us to compute
$P(V)$
based on those ANES-sampled backstories. This allows us to compute $P(V|B_{\mathrm {ANES}})P(B_{\mathrm {ANES}})$
. As long as GPT-3 models the conditional distribution
$P(V|B_{\mathrm {ANES}})P(B_{\mathrm {ANES}})$
. As long as GPT-3 models the conditional distribution $P(V|B)$
well, we can explore patterns in any designated population.
$P(V|B)$
well, we can explore patterns in any designated population.
The conditional nature of GPT-3’s text completions creates a situation analogous to Simpson’s Paradox (Simpson Reference Simpson1951), in which the trends evident in a combined group do not reflect the trends of its composite distributions. Specifically, our silicon sampling method allows us to examine the distinct opinions, biases, and voting patterns of identified subpopulations, which can differ drastically from the patterns exhibited by generic (i.e., not demographically conditioned) GPT-3 text completions. Of course, the ability to sample from GPT-3’s component text distributions does not, in and of itself, guarantee that these distributions faithfully reflect the behavior of specific human subpopulations. For that, one must first examine the model’s algorithmic fidelity with respect to both the domain of study and the demographic groups of interest.
5 Study 1: Free-Form Partisan Text
Our first examination of algorithmic fidelity in GPT-3 involves a silicon replication of Rothschild et al.’s “Pigeonholing Partisans” data (Rothschild et al. Reference Rothschild, Howat, Shafranek and Busby2019). This survey asked respondents to list four words to describe both Republicans and Democrats. Rothschild et al. find that people talk about partisans in different ways, focusing on traits, political issues, social groups, or a combination of all three. Furthermore, people often talk about their own political party in more positive ways than the other party, in line with other research (Iyengar, Sood, and Lelkes Reference Iyengar, Sood and Lelkes2012; Mason Reference Mason2018). In this first test, we ask whether GPT-3 can produce texts about partisans that are, in the aggregate, indistinguishable from words generated by humans.
To accomplish this, we leverage our silicon sampling technique, generating a synthetic dataset by constructing a first-person backstory for each human subject in the Pigeonholing Partisans survey, as shown in Figure 1. Using these texts, we ask GPT-3 to sample new words. Because of the setup of our conditioning text, GPT-3 almost always responds with neatly delineated sets of four words, although—much like humans—it occasionally responds with long phrases, mini-essays or nothing at all. Post-processing with regular expressions extracted the final set of four words from each sample.
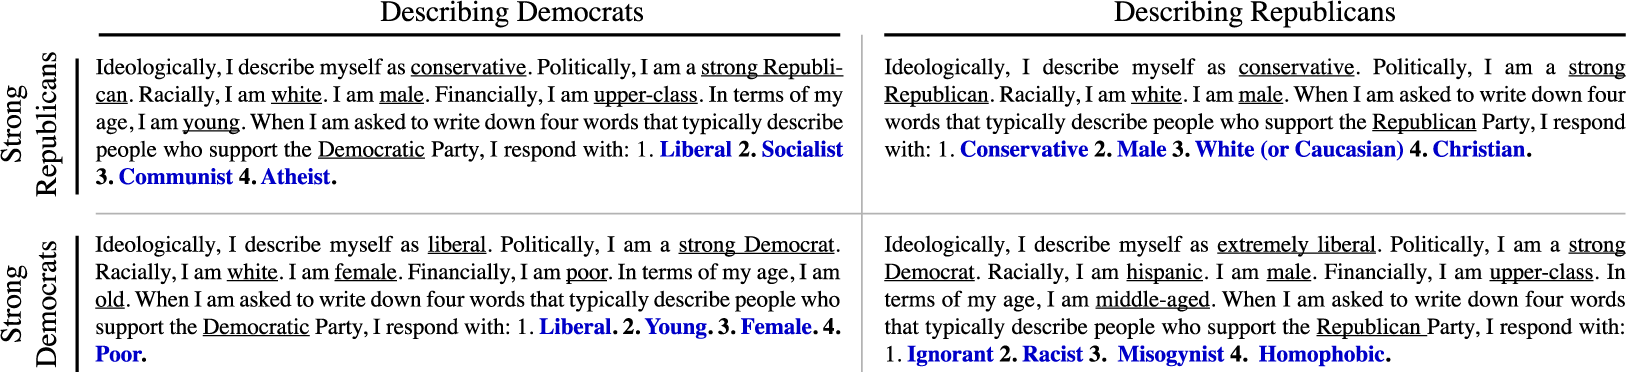
Figure 1 Example contexts and completions from four silicon “individuals” analyzed in Study 1. Plaintext indicates the conditioning context; underlined words show demographics we dynamically inserted into the template; blue words are the four harvested words.
For GPT-3 to generate four-word lists that mirror human texts demands significant algorithmic fidelity, for it requires listing words that in tone and content mirror those listed by humans with a particular background. Figure 2 compares the most frequent words used to describe Democrats and Republicans in our data, by data source (GPT-3 or human) and source ideology. Bubble size represents relative frequency of word occurrence; columns represent the ideology of the list writers. Qualitatively, both the human and GPT-3 lists look initially as political scientists might expect. For example, both GPT-3 and humans use a common set of words to describe Democrats, and rarely use those words to describe Republicans.
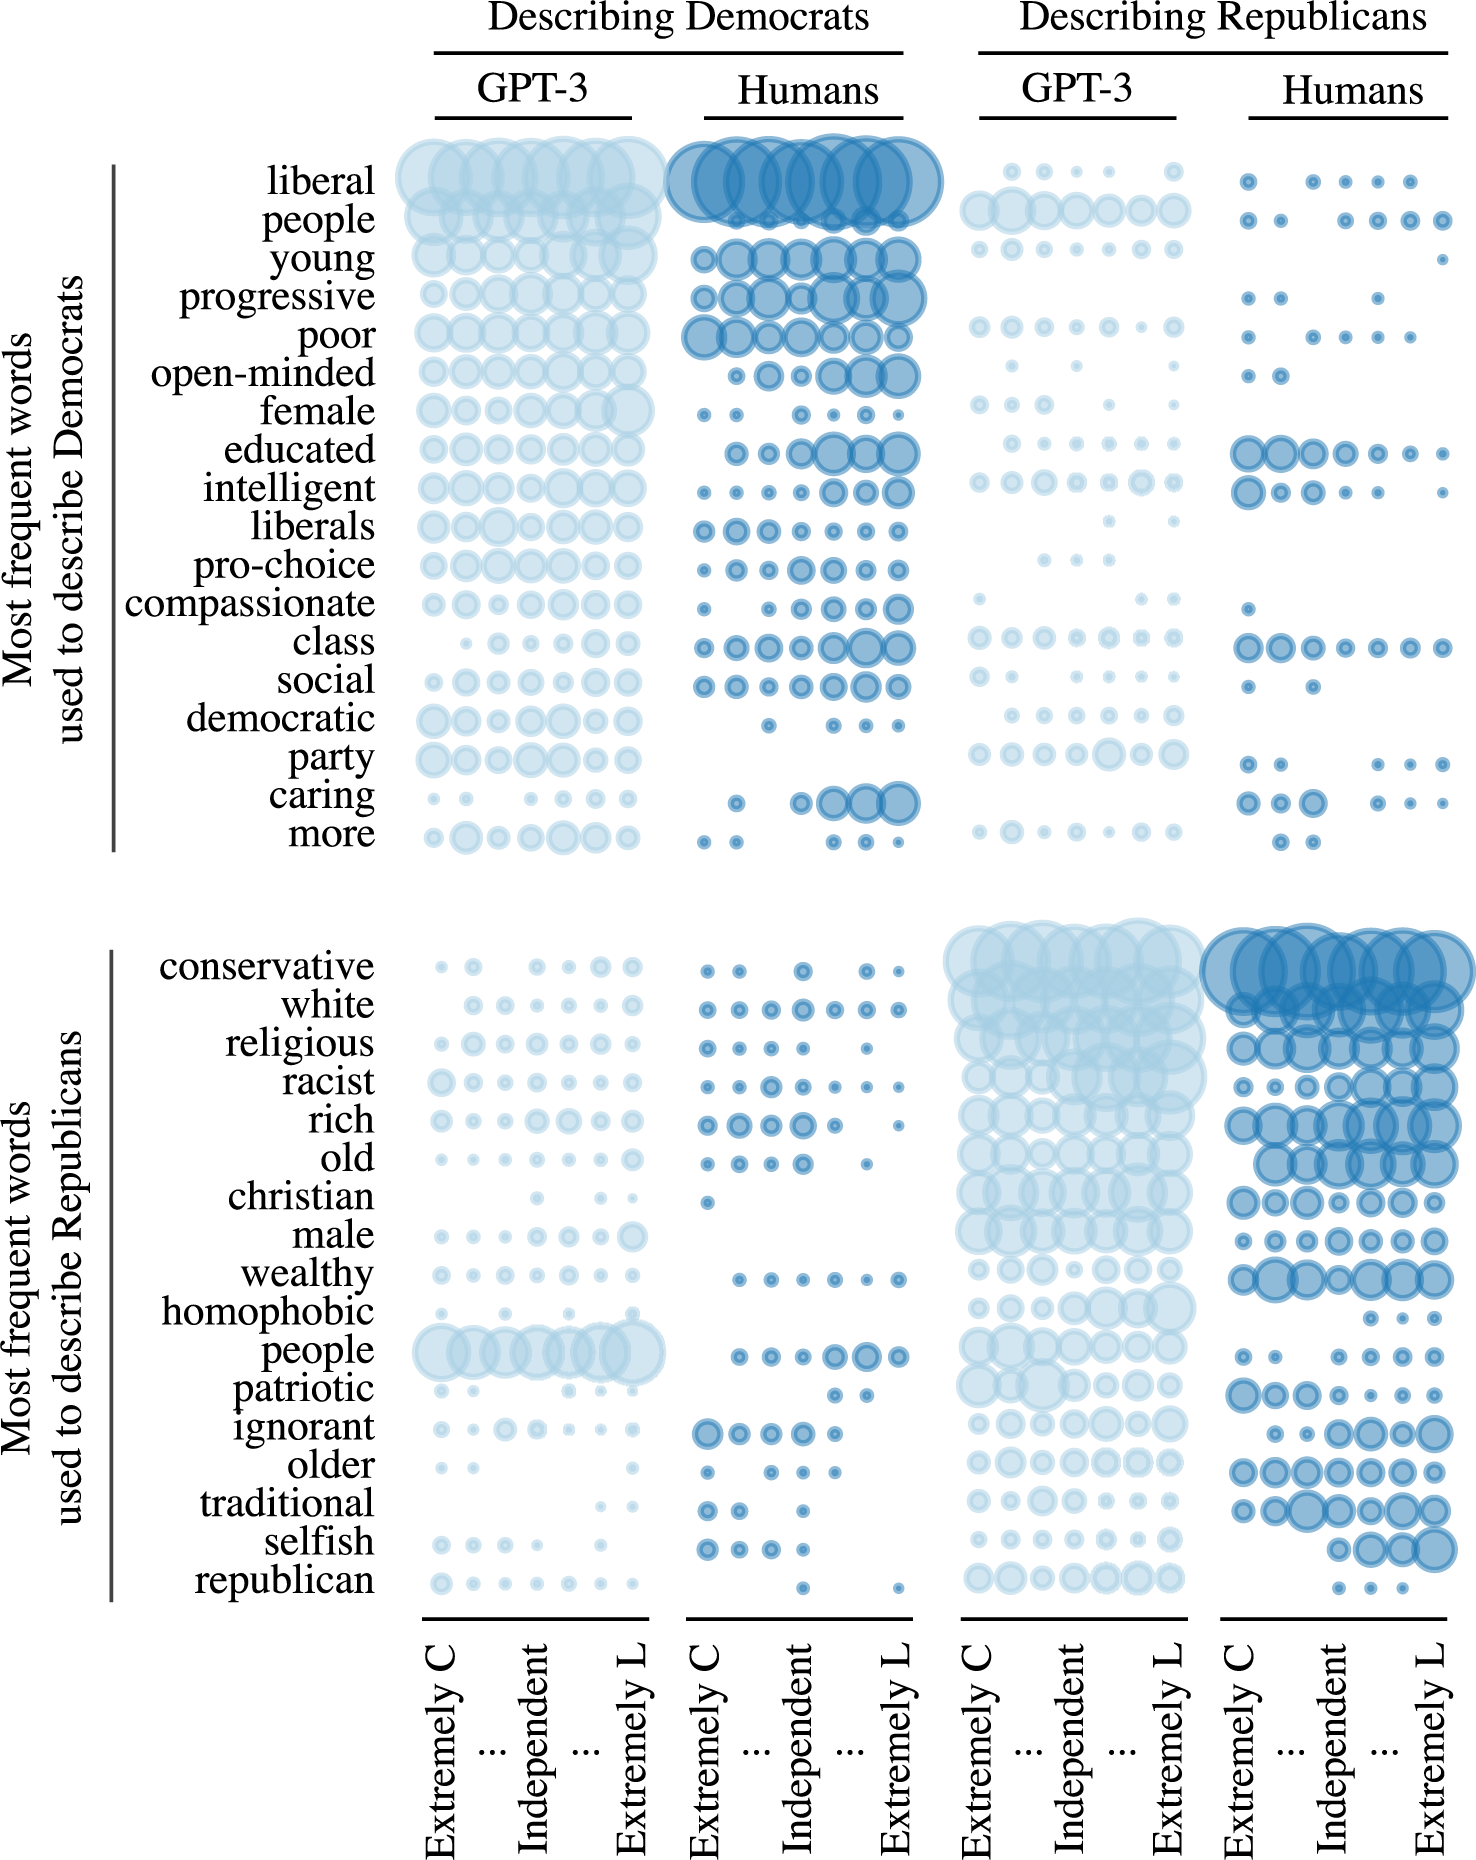
Figure 2 The original Pigeonholing Partisans dataset and the corresponding GPT-3-generated words. Bubble size represents relative frequency of word occurrence; columns represent the ideology of list writers. GPT-3 uses a similar set of words to humans.
To formally analyze this data, we hired 2,873 individuals through the survey platform Lucid (Coppock and McClellan Reference Coppock and McClellan2019) to evaluate the 7,675 texts produced by human and GPT-3 survey respondents, without any indication of which was which. Each individual evaluated eight randomly assigned lists, with each text evaluated by three different individuals.
We presented these evaluators with the four-word lists after the following preface: “Consider the following description of [Republicans/Democrats].” We then asked them to respond to six prompts. First, we asked them to guess the partisanship of the list writer (Republican, Democrat, or Independent). We then asked them to rate the list on five dimensions: (1) positive or negative tone, (2) overall extremity, and whether the text mentioned (3) traits, (4) policy issues, or (5) social groups. Participants then sequentially viewed eight additional randomly selected lists, were told that some of these lists were generated by a computer model, and were asked to guess whether each list was generated by a human or a computer. Extensive details on the lists, their writers, study participants, and the instructions can be found in the Supplementary Material. Data used for analysis can be found at Argyle et al. (Reference Argyle, Busby, Fulda, Gubler, Rytting and Wingate2022).
Using this design, we explore two social science variations of a Turing Test: (1) whether our human evaluators recognize the difference between human and GPT-3-generated lists, and (2) whether the humans perceive the content of lists from both sources as similar. These tests speak to Criterion 1 (Turing Test) and Criterion 2 (Backward Continuity).
We find evidence in favor of both criteria: participants guessed 61.7% of human-generated lists were human-generated, while guessing the same of 61.2% of GPT-3 lists (two-tailed difference p = 0.44). Although asking participants to judge if a list is human- or computer-generated leads them to guess that some lists do not come from humans (nearly 40% of both kinds of lists fell in this category), this tendency does not vary by the source of the list.
This is particularly interesting given the results of our second exploration: whether participants noted any differences in list characteristics between human and GPT-3-generated lists. To identify these differences, we estimate regression models using ordinary least squares, regressing each of the five characteristics by which lists were evaluated (positivity, extremity, and mentions of traits, issues, and groups) on a dichotomous source variable (0 = human, 1 = GPT-3) and a series of control variables recording the gender, ethnicity, income, age, and partisan identity of the original list-writers in the Rothschild et al. data. All models include fixed effects for evaluators (as each evaluated eight lists), and clustered standard errors by evaluator and list (as each list was evaluated three times).
Figure 3B plots the predicted percentage of all lists (human and GPT-3) evaluated as having each characteristic. The results show a remarkable degree of consistency in the evaluations of both human and GPT-3-generated lists in both content and tone. For example, human list-writers included more personality traits (e.g. “bigoted” and “moral”) than other components (72.6% of lists). So did GPT-3 (66.8% of lists). Less than half of both human and GPT-3-generated lists were evaluated as extreme (38.6% and 39.9%, respectively). This pattern of similarity holds across all five characteristics, with all but one characteristic hovering around 50%. The lone exception, with a substantially higher frequency in both human and GPT-3 data, is “traits.” This matches patterns in the original analyses of the human texts (Rothschild et al. Reference Rothschild, Howat, Shafranek and Busby2019). That GPT-3 mirrors this exception, and patterns in all other characteristics, is strong evidence of the depth of algorithmic fidelity it contains. Tables of results and further model details can be found in the Supplementary Material.
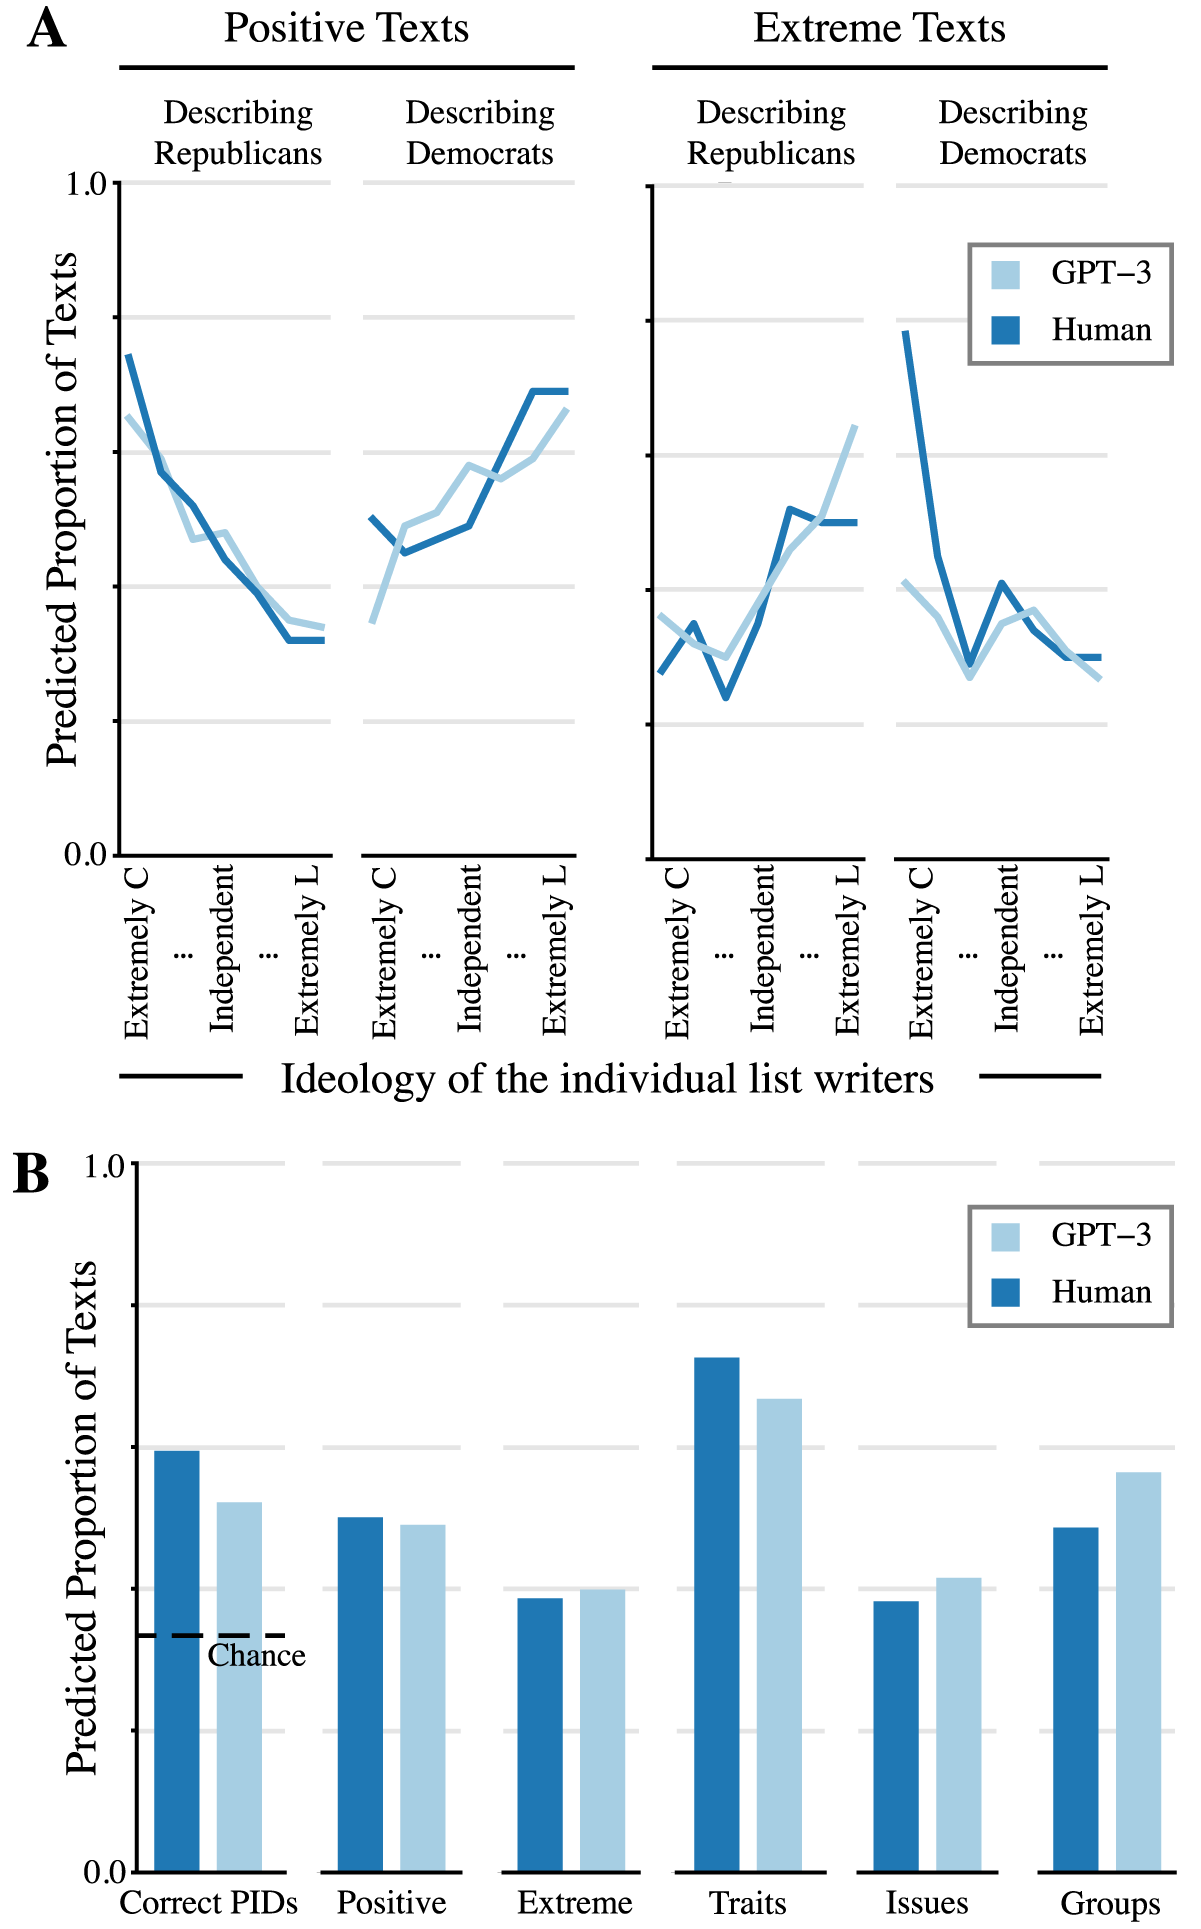
Figure 3 Analysis of GPT-3 and human responses from the Lucid survey. Part A (the top panel) displays the positivity and extremity of texts created by GPT-3 and humans. Part B (the bottom panel) presents the predicted percent of texts that had each of the listed characteristics.
Moreover, as Figure 3A indicates, when we drill down to greater levels of detail to explore underlying patterns behind these results, we find that GPT-3 reflects human-similar patterns at this level as well (Criterion 4, Pattern Correspondence). The similarity in the use of positive and extreme words by both humans and GPT-3, broken out by the ideological subgroup of the list writers, is striking.
We have shown that (1) human evaluators of the word lists could not correctly distinguish between human versus GPT-3-generated lists and (2) that they evaluated the content/characteristics of these lists as quite similar. We now assess the degree to which our participants were able to use these lists to correctly guess the true partisanship of the list writers. To explore this question, we estimate a model similar to those just presented, regressing a dichotomous variable identifying if participants correctly guessed the partisanship of list writers (1 = Yes; 0 = No) on the source of the list (GPT-3 vs. human) and the same controls. The leftmost bars of Figure 3B present the predicted percentage correct, by source type.
Participants presented with lists of words from both sources guess the correct partisanship of their writer significantly better than chance (33%, given respondents could guess Republican, Democrat, or Independent), providing strong additional evidence in favor of algorithmic fidelity in GPT-3. Participants who saw human-generated lists guessed successfully roughly 7.3% more often (59.5% vs. 52.2%) than those who saw GPT-3 lists, a statistically significant difference (two-tailed $p<0.001$
). However, texts from both humans and GPT-3 both clearly contain the sentiment cues necessary to guess the partisanship of the creator of the texts at significant levels.
$p<0.001$
). However, texts from both humans and GPT-3 both clearly contain the sentiment cues necessary to guess the partisanship of the creator of the texts at significant levels.
Results from Study 1 suggest a remarkably high degree of algorithmic fidelity within GPT-3. We find repeated, consistent support for Criterion 1 (Turing Test) and Criterion 2 (Backward Continuity) from these data, with some initial evidence for Criterion 4 (Pattern Correspondence). In all of these cases, we observe support for these criteria across different measures and for different subsets of the American population.
6 Study 2: Vote Prediction
Our next two studies draw on the ANES, a premier source of data in understanding American public opinion. In Study 2, we use the 2012, 2016, and 2020 waves of the survey.
We first consider the degree to which GPT-3 silicon samples, constructed to match the demographics of the 2012, 2016, and 2020 ANES participants, report similar distributions of vote choice as their matching human samples. This requires GPT-3 to generate text from a limited universe of options (e.g., vote for Trump or Clinton in 2016), but it must do so differently based on the human backgrounds we provide it. It therefore assesses Criterion 3, requiring forward compatibility of GPT-3 in producing a candidate’s name in response to the conditioning text, and Criterion 4, the expectation that the conditioning texts will produce predictable changes in the probability distribution of vote choice. To demonstrate algorithmic fidelity in this study, GPT-3 must contain human-like patterns of associations, where individuals from different ethnic groups, living in different locations, of different social backgrounds vote differently in ways identified but still debated by political scientists (Box-Steffensmeier, Boef, and Lin Reference Box-Steffensmeier, Boef and Lin2004; Cramer Reference Cramer2016; Jardina Reference Jardina2019; Tate Reference Tate1994). Study 2 also explores the temporal limits of GPT-3: the training corpus for GPT-3 ended in 2019 (Brown et al. Reference Brown2020), so data from 2020 allows us to explore how the algorithmic fidelity of the language model changes when probed outside the time of the original training corpus.
Drawing from research on voting in the United States, we used the following ANES variables to condition GPT-3: (1) racial/ethnic self-identification, (2) gender, (3) age, (4) conservative-liberal ideological self-placement, (5) party identification, (6) political interest, (7) church attendance, (8) if the respondent reported discussing politics with family and friends, (9) feelings of patriotism associated with the American flag (not available in 2020 at the time of analysis), and (10) state of residence (not available in 2020 at the time of the analysis). We then recorded the probabilities from GPT-3 that the sentence “In [year], I voted for…” would be completed with the Republican or Democratic candidate given the each conditioning backstory (see the Supplementary Material for further detail, including examples of the conditioning context). Using these variables as conditioning text in GPT-3 allows us to compare how well a GPT-3 silicon sample replicates the relationships between each variable and vote choice in our human sample. In all the comparisons that follow, we code vote choice as 1 when the respondent/GPT-3 indicates a vote for the Republican candidate and a 0 for a vote for the Democratic candidate in that election. To make the predictions from GPT-3 match the observed human data, we dichotomized the probability predictions at 0.50, where higher values were scored as a vote for the Republican candidate. Data used for analysis can be found at Argyle et al. (Reference Argyle, Busby, Fulda, Gubler, Rytting and Wingate2022).
We observe a high degree of correspondence between reported two-party presidential vote choice proportions from GPT-3 and ANES respondents. Averaged across the whole sample, GPT-3 reported a 0.391 probability of voting for Mitt Romney in 2012; the same percentage from the ANES was 0.404. In the 2016 data, GPT-3 estimated a 0.432 probability of voting for Trump, and the probability from the 2016 ANES was 0.477. In 2020, the GPT-3-generated probability of voting for Trump was 0.472, while the percentage from the ANES respondents was 0.412. In all three cases, we see evidence of a mild amount of overall bias in GPT-3: GPT-3 was a little predisposed against Romney in 2012, against Trump in 2016, and against Biden in 2020. However, the substantive difference between the ANES and GPT-3 estimates is relatively small and, in keeping with our larger arguments about algorithmic fidelity and corrections for skewed marginals, does not preclude strong and consistent correlations between GPT-3’s simulated responses and the reactions of subgroups in the American population.
To explore these correlations in detail, we turn to the statistics reported in Table 1. This table reports two forms of correlations between the self-report of voting from the ANES and a binary version of the vote report from GPT-3 (other metrics support these two and can be found in the Supplementary Material). We dichotomize the GPT-3 vote probability to match our human measure, a binary report of voting from the ANES. Across all 3 years of survey data, we see remarkable correspondence between GPT-3 and human respondents. The 2012 tetrachoric correlation across all respondents 0.90, the 2016 estimate was 0.92, and the 2020 value was 0.94. We find this consistently high correlation remarkable given the differences in context across years.
Table 1 Measures of correlation between GPT-3 and ANES probability of voting for the Republican presidential candidate. Tetra refers to tetrachoric correlation. Prop. Agree refers to proportion agreement. GPT-3 vote is a binary version of GPT-3’s predicted probability of voting for the Republican candidate, dividing predictions at 0.50.
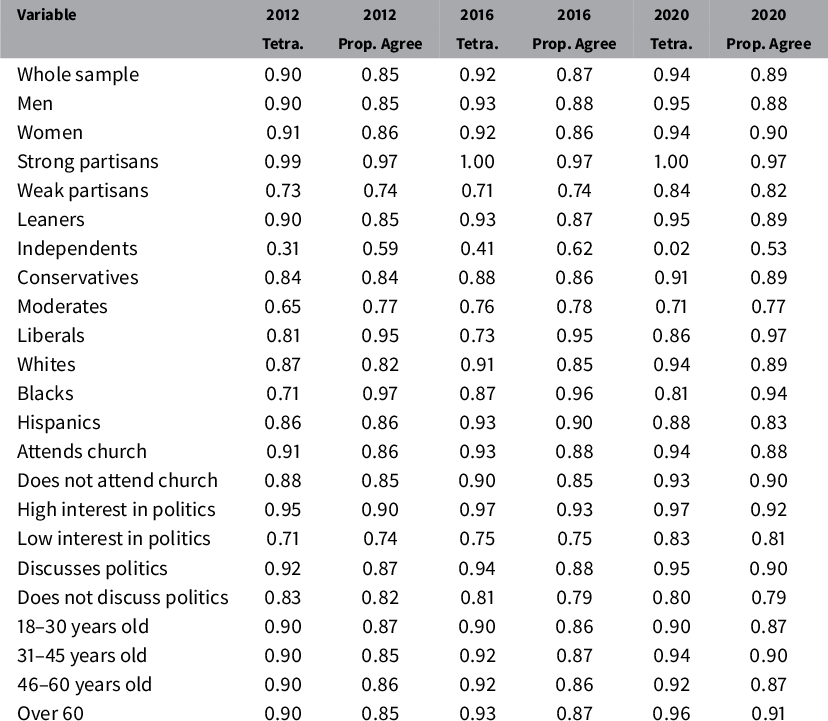
This same high degree of pattern correspondence occurs for various subgroups in the American population. More than half of the tetrachoric correlations between the reported vote by GPT-3 and the ANES are 0.90 or higher, and this is true for all 3 years. The proportion agreement column of Table 1 also indicates high levels of raw agreement between the two reports of vote choice in 2012, 2016, and 2020. Impressively, there is only one exception to this overall pattern: the estimates of vote choice do not match well for pure independents, especially in 2020. However, this is the only deviation from the overall trend in Table 1, where all other measures of correspondence exceed 0.65 (and are generally closer to 0.8 or 0.9). Furthermore, existing political science research suggests that this group of individuals should be especially hard to predict as they are the most conflicted about the two-party choices, the least likely to vote, the least politically knowledgeable, and the least interested in politics (Keith et al. Reference Keith, Magleby, Nelson, Orr and Westyle1992; Klar and Krupnikov Reference Klar and Krupnikov2016; Magleby, Nelson, and Westlye Reference Magleby, Nelson, Westlye, Sniderman and Highton2011). Overall, then, the results in Table 1 provide strong, additional evidence for algorithmic fidelity, with repeated, consistent support for Criteria 3 (Forward Continuity) and 4 (Pattern Correspondence). Section 3 of the Supplementary Material contains additional results, including an ablation study investigating the effect of removing backstory elements, and a model comparison showing how alternative language models perform on this task.
The ability of GPT-3 to capture the voting preferences of different groups of Americans is not restricted to one moment in time. Moreover, results from the 2020 ANES data indicate the possibility that GPT-3 can be used, with the right conditioning, to understand people and groups outside its original training corpus.
7 Study 3: Closed-Ended Questions and Complex Correlations in Human Data
Study 3 examines GPT-3’s ability to replicate complex patterns of association between a wide variety of conceptual nodes. Given the complexity of this task, we conduct it just for the 2016 data from the ANES. Building on the voting predictions in Study 2, we expand the set of information outputs we ask GPT-3 to produce, and use the resulting data to evaluate a more complex structure of associations. This is our most rigorous evaluation of Criterion 4 (Pattern Correspondence).
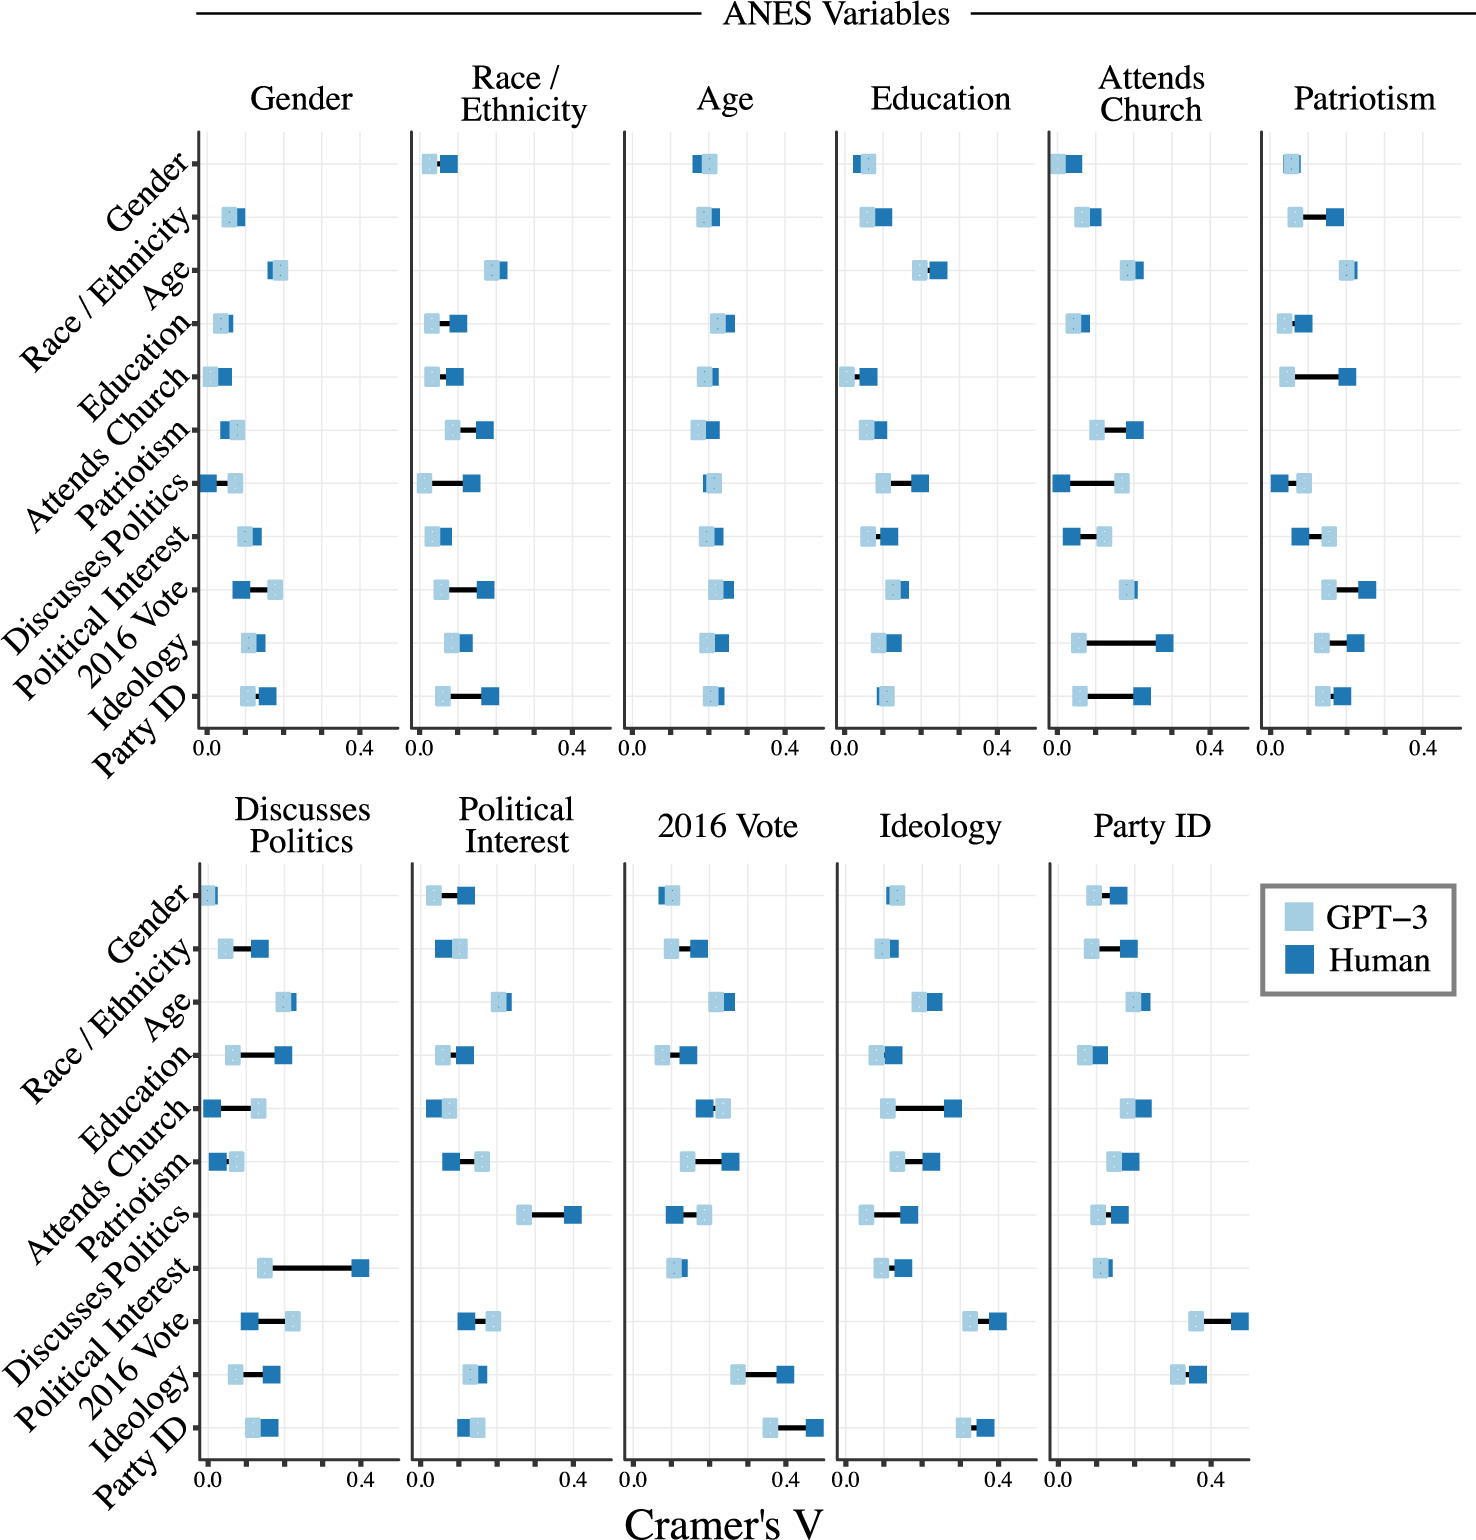
Figure 4 Cramer’s V correlations in ANES vs. GPT-3 data.
This study represents both a technical and substantive research challenge. Absent the naturally self-limiting set of likely responses when asking about vote choice in a particular election (i.e., “Donald Trump” vs. “Hillary Clinton”), we develop a method to condition GPT-3 to provide specific responses from a list of options. Additionally, mirroring the widespread and varied use of survey data in social science applications, we push beyond high-level conditional probabilities and explore whether GPT-3 demonstrates algorithmic fidelity in inter-relationships among a variety of underlying attitudes, demographics, and reported behaviors.
For this task, we produce an interview-style conditioning template (see the Supplementary Material for an example). The purpose of this approach is twofold. First, leveraging the zero-shot learning property of language models (Brown et al. Reference Brown2020), the format induces GPT-3 to respond to survey questions using short strings of tokens drawn from options provided by the “Interviewer.” Second, the questions incorporated in the conditioning text provide necessary demographic and attitudinal background information to generate each distinct silicon subject. We generate the conditioning text using responses that humans gave on the 2016 ANES to 11 survey questions. We then use GPT-3 to predict the response to the twelfth. Data used for analysis can be found at Argyle et al. (Reference Argyle, Busby, Fulda, Gubler, Rytting and Wingate2022).
Using the ANES and silicon data, we calculate Cramer’s V for each combination of survey items in the ANES sample (“Human”), and between the ANES conditioning values and the resulting GPT-3 produced answer (“GPT-3”). Cramer’s V provides a simple summary measure of association that accounts for the variation in base rates in the raw data (Cramér Reference Cramér1946). Figure 4 displays the comparison in Cramer’s V between the two data sources. We again find remarkably high correspondence between the patterns of associations in human survey data and these same patterns in GPT-3 produced survey data. The mean difference between the Cramer’s V values is 0.026. As can be seen, the Cramer’s V for GPT-3-generated responses is not uniformly high or low, but instead mirrors stronger and weaker relationships present in the human data. Where two concepts are not strongly associated in the human data, they likewise show little association in the GPT-3 data. The converse is also true. And while there is variation in Figure 4 in terms of how precisely the patterns of relationships in GPT-3 match those in the ANES, the overall pattern is a stunning correspondence between GPT-3 and the ANES in the vast majority of cases.
Although we provide first-person backstories based on specific human survey profiles, we do not expect the values in the silicon sample to exactly match the human response on the individual level. For each text completion, the language model uses a stochastic sampling process to select the completion from the distribution of probable next tokens. Therefore, with a large enough sample size, we expect the overall distribution of text responses in the silicon sample to match the overall distribution in the human data, but we do not evaluate correspondence at the individual level. Additionally, as with all stochastic processes, we expect some variation in different draws of the silicon sample. In the Supplementary Material, we report on variation in the pattern correspondence based on different sampling parameters in GPT-3.
These results again provide compelling, consistent, repeated evidence for Criterion 4 (Pattern Correspondence). GPT-3 reproduces nuanced patterns of associations not limited to aggregated toplines. When provided with real survey data as inputs, GPT-3 reliably answers closed-ended survey questions in a way that closely mirrors answers given by human respondents. The statistical similarities extend to a whole set of inter-correlations between measures of personal behaviors, demographic characteristics, and complex attitudes. We again see this as strong evidence for algorithmic fidelity.
8 Where Do We Go from Here?
Thus far, our emphasis has been on documenting the algorithmic fidelity of GPT-3 by comparing its outputs to human data. However, our purpose is not limited to these particular human–computer comparisons; if this were the case, the usefulness of GPT-3 would be dramatically limited. Instead, we provide evidence that algorithmic fidelity is a crucial attribute of tools like GPT-3 because it demonstrates that these language models can be used prior to or in the absence of human data.
To illustrate this, consider the conclusions we would have drawn with only our data from GPT-3. The data from our silicon sample in Study 1 suggests that (1) people describe Republicans and Democrats with different terms that highlight distinct stereotypes of both groups; (2) the affective content and extremity of these texts is tied to individuals’ political beliefs and identity in systematic ways that can be used to generate theory; (3) stereotypes of partisans contain issue, group, and trait-based content, although trait references are most common; and (4) others can guess the partisanship of individuals based on their stereotypes of Democrats and Republicans. All of this is evident using only the data from GPT-3. With this information, interested researchers could design survey questions, experimental treatments, and codebooks to guide human research. Crucially, this can be done with substantially fewer resources than a parallel data collection with human respondents: Study 1 cost $29 on GPT-3 (see the Supplementary Material for further cost information).
The same is true for Studies 2 and 3. The ablation analysis for Study 2 (contained in Section 3 of the Supplementary Material) suggests which variables researchers should include in their studies of public opinion if they want to accurately understand Americans’ voting behavior. Study 3 could be used by social scientists to target important connections between characteristics and views that merit further exploration. Based on the results from GPT-3, a social scientist could design an experiment or observational study to confirm and dissect this relationship in a rigorous and causal way. The results also indicate which variables operate as potential confounds that should be included in pre-analysis plans for regression and other econometric models that have causal aspirations. Again, all of these insights would be clear to researchers with only access to GPT-3 and without our human baselines. These studies suggest that after establishing algorithmic fidelity in a given model for a given topic/domain, researchers can leverage the insights gained from simulated, silicon samples to pilot different question wording, triage different types of measures, identify key relationships to evaluate more closely, and come up with analysis plans prior to collecting any data with human participants.
9 Discussion
In this paper, we introduce the concept of algorithmic fidelity as a means to justify the use of large-scale language models as proxies for human cognition at an aggregate level, and as general-purpose windows into human thinking. We propose four criteria to establish the algorithmic fidelity of these models and demonstrate empirical methods for their evaluation.
Using these concepts and methods, we show that GPT-3, one of the largest publicly available language models, contains a striking degree of algorithmic fidelity within the realm of public opinion in the United States. Study 1 shows that GPT-3 passes a social science version of the Turing Test (Criterion 1) and exhibits both strong Backward Continuity (Criterion 2) and Pattern Correspondence (Criterion 4). Studies 2 and 3 provide compelling evidence of Forward Continuity (Criterion 3) as well as additional, much more granular evidence for Pattern Correspondence (Criterion 4). As noted in Studies 2 and 3, careful conditioning of GPT-3 allows us to address issues of temporality and replicability, points further supported in results presented in the Supplementary Material. Importantly, in all studies, we find evidence that GPT-3 is capable of replicating the viewpoints of demographically varied subpopulations within the U.S. Taken together, these studies show consistent, repeated evidence for these criteria across a range of data sources, measures, and points in time.
These studies also provide examples of some of the many ways in which large scale language models like GPT-3 might be used for social science research. We can envision many others, and expect that this method will have strengths and weaknesses in comparison to traditional social science methods (as we highlight in Section 5 of the Supplementary Material, cost is certainly a strength of this method). We note, however, that while this work lays exciting groundwork for the beneficial use of these models in social science, these tools also have dangerous potential. Models with such fidelity, coupled with other computational and methodological advances, could be used to target human groups for misinformation, manipulation, fraud, and so forth (Brown et al. Reference Brown2020). We acknowledge these dangers, and both join with and strongly endorse the work of others in pushing for a clear standard of ethics for their use in research and deployment (Ross Reference Ross2012; Salganik Reference Salganik2017). We believe that transparent, research-based, and community-accountable exploration and understanding of these tools will be essential for recognizing and preventing abuse by private actors who will inevitably employ these models for less noble ends.
While the current study is restricted to a specific domain, the underlying methodology is general purpose and calls for additional work to quantify both the extent and limitations of GPT-3’s algorithmic fidelity in a wide array of social science fields. Such an effort goes well beyond what one research team can hope to accomplish; we extend this invitation to the wider scientific community.
Acknowledgments
The authors thank the Departments of Computer Science and Political Science at Brigham Young University for support and for feedback on this manuscript. They also thank the editor and anonymous reviewers at Political Analysis for comments that greatly improved the manuscript. Finally, Chris Bail, Sarah Shugars, Luwei Ying, Diogo Ferrari, and Christopher Karpowitz provided invaluable feedback.
Data Availability Statement
Replication code and data for this article are available on the Political Analysis Dataverse at https://doi.org/10.7910/DVN/JPV20K.
Conflict of Interest
The authors have no conflicts of interest to disclose.
Supplementary Material
For supplementary material accompanying this paper, please visit https://doi.org/10.1017/pan.2023.2.


